The Russian invasion of Ukraine has thrust global food security issues into the international spotlight due to destroyed croplands and the seizure of vital grain reserves. Since wheat is one of the world’s most ubiquitous and critical crops, disruptions to the trade of wheat globally will likely have rippling effects throughout the world food system, especially downstream to predominantly low-income countries that rely on Ukrainian grain.
This immediate crisis is not only devastating in its own right, but it also foreshadows looming food security crises related to climate change. For the short and long term, we can better understand global food security spatially using ArcGIS Living Atlas and ArcGIS Pro through advances in satellite imagery and machine learning.
In the short term: The war and its rippling consequences
In terms of its total landcover, Ukraine is one of the world’s most agriculturally rich nations. It ranks third behind two much smaller nations (neighboring Moldova and microstate San Marino) in terms of percent of the country devoted to cropland. Of Ukraine’s territory, 75% is cropland, and that figure is even higher in Eastern Ukraine – where some of the heaviest conflict has been raging since February.
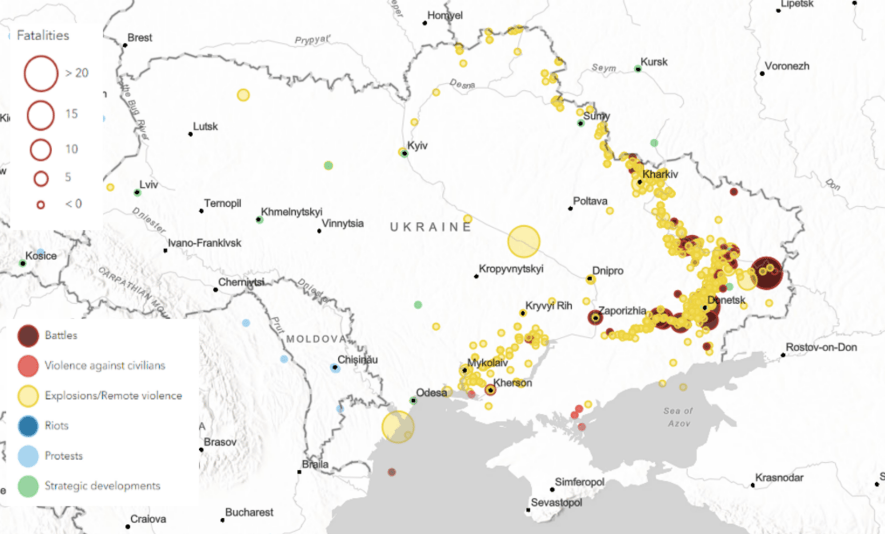
The Russian invasion has destroyed much of that cropland.
Within Living Atlas, the Armed Conflict & Event Data Project (ACLED) shows the location and scale of riots, explosions, and warfare globally. This layer currently shows the extent of fighting in Eastern Ukraine – a heavily agricultural region – as of early July 2022.
We can use satellite imagery to better understand this disruption. Living Atlas includes 10m Multispectral Sentinel Imagery updated daily.
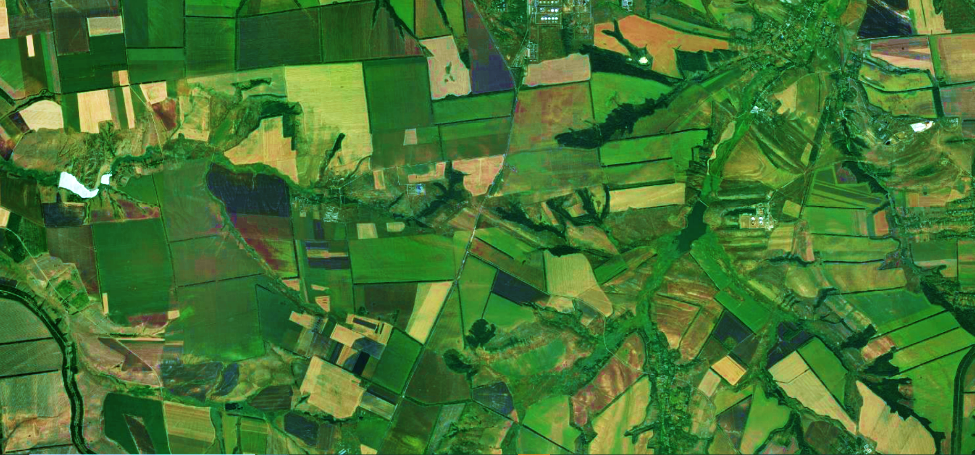
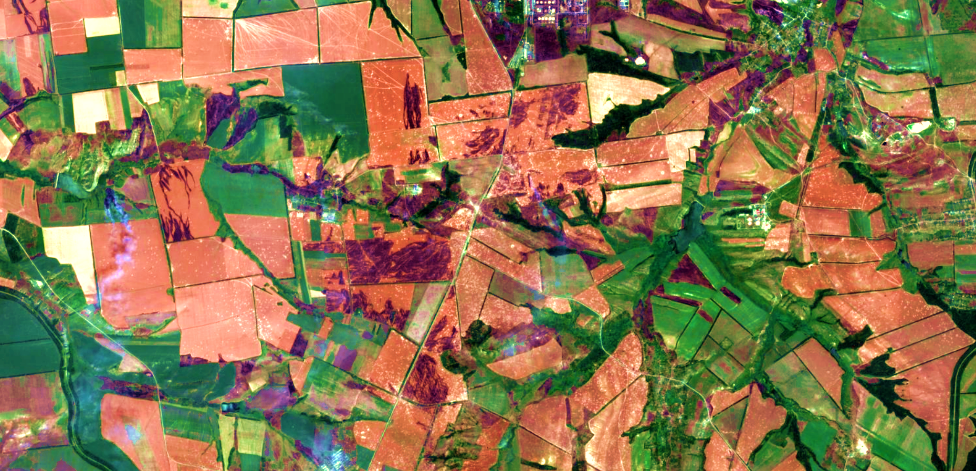
Above is a view of rural farmland outside of Sievierodonetsk in eastern Ukraine, an area hit by heavy fire since the Russian invasion began. Basemap imagery taken in August 2021 (top image) shows green, productive wheat fields. Imagery obtained this week of July 2022 (bottom image)shows massive shelling and subsequent fires have destroyed that same cropland.
While the devastation within Ukraine is enormous, Ukraine will not be the only nation to suffer due to Russia’s invasion. Only a handful of temperate countries export most of the worlds grain. Together Russia, the United States, Canada, France, and Ukraine are responsible for 65% of global wheat exports.
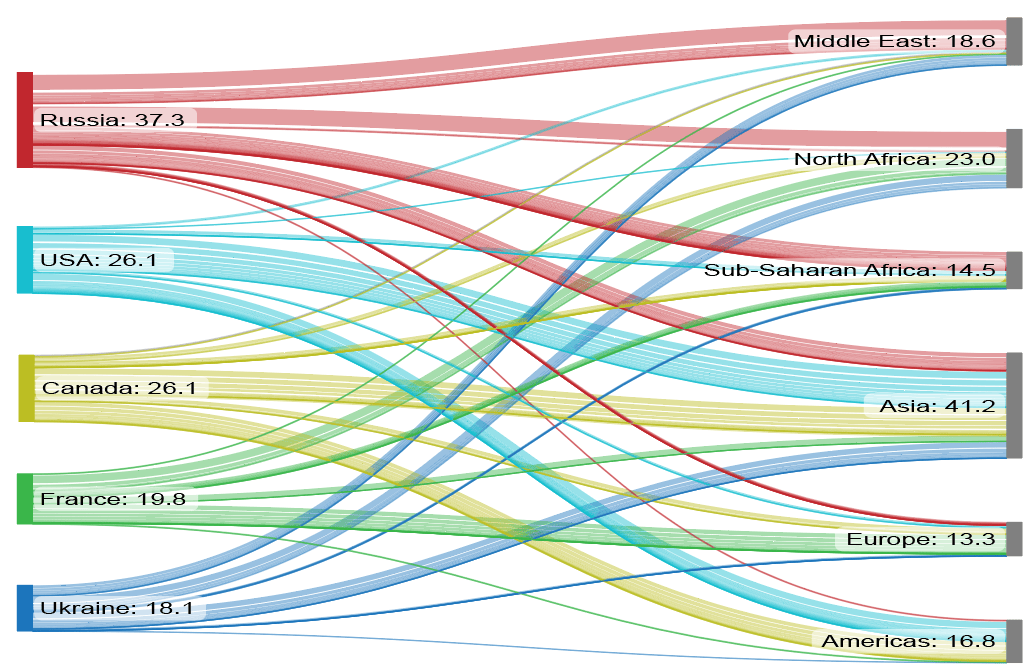
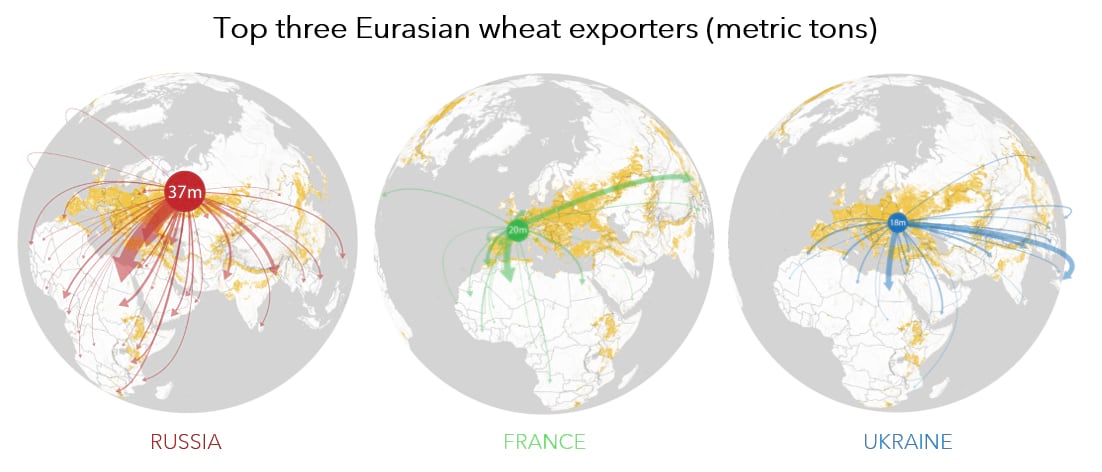
As one of the world’s greatest grain producers, Ukraine exports 18 million metric tonnes of wheat (9% of all wheat exports). Most Ukrainian wheat flows to the Middle East, North Africa, and Southeast Asia – already food-insecure places. Any disruption to Ukraine’s production or export capabilities will seriously impact these downstream, food-insecure nations.
The long term: climate change and its impacts
The crisis in Ukraine has exposed one of the major vulnerabilities to the global food supply chain: low-income countries with the most vulnerable populations are often reliant on imported grain. Already 18 of the most food insecure nations collectively import two-thirds of their wheat from only four countries (the United States, Russia, Ukraine, and Canada). In Lebanon, where 2 million people area already extremely food insecure, 55% of grain imports come from Ukraine. In the short term, Lebanon will be squeezed by smaller and fewer Ukrainian wheat imports; however, in the long term, Lebanon and countries like it face a more existential threat.
Climate change will exacerbate existing shortfalls in global food security; areas near the equator will become less able to cultivate grain locally as temperatures become more extreme and their need for imports greater. With warming temperatures pushing grain-suitable land further to the poles, grain production will be concentrated in a smaller number of countries. The result is that warm-climate, low-income nations will be increasingly reliant on a smaller number of producers that will have more leverage over global food supply.
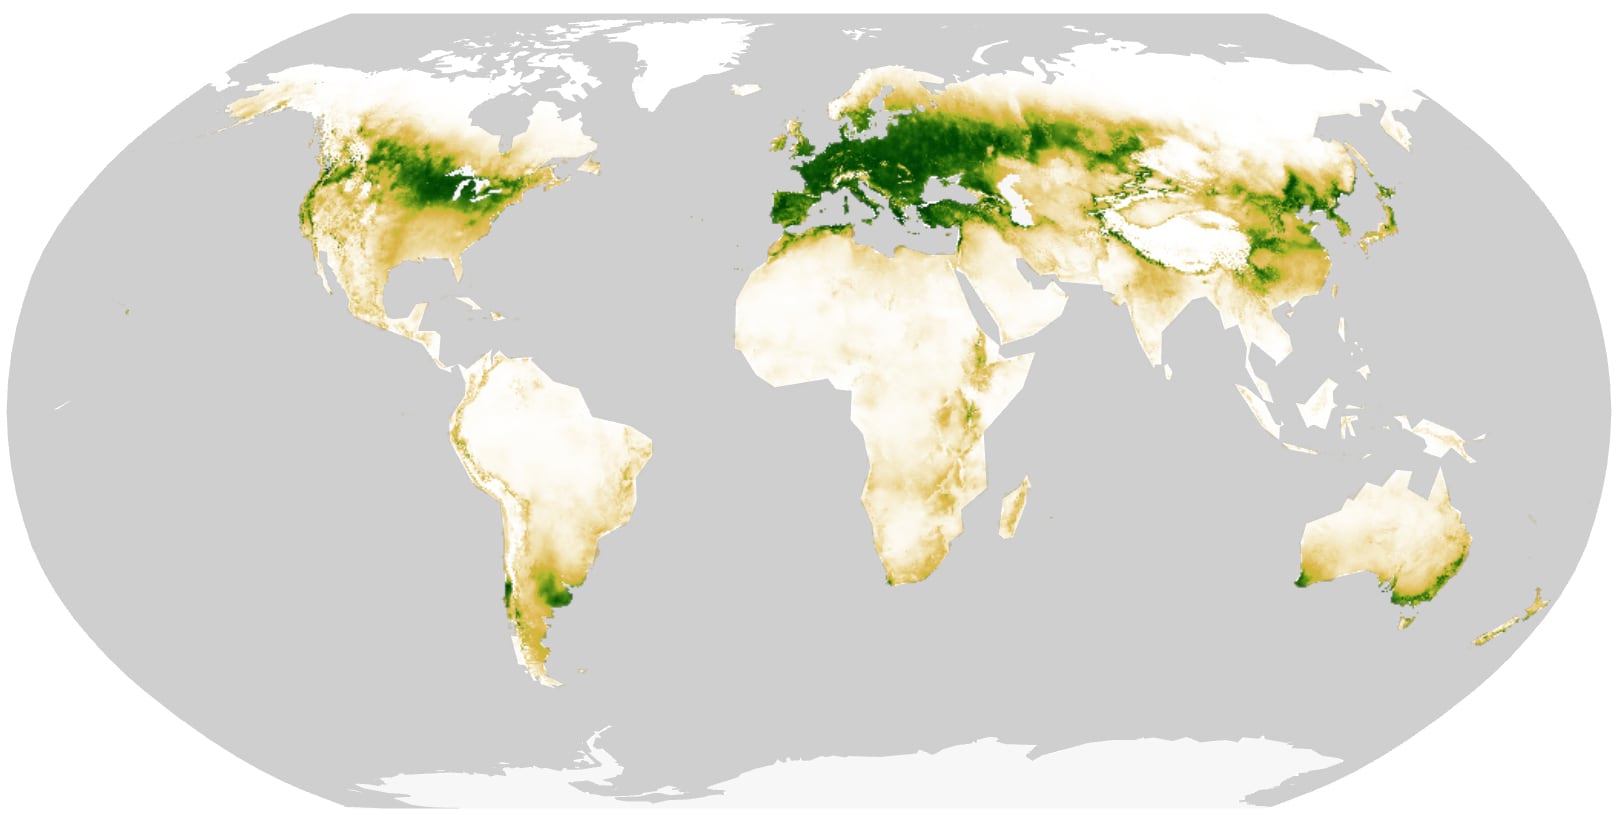
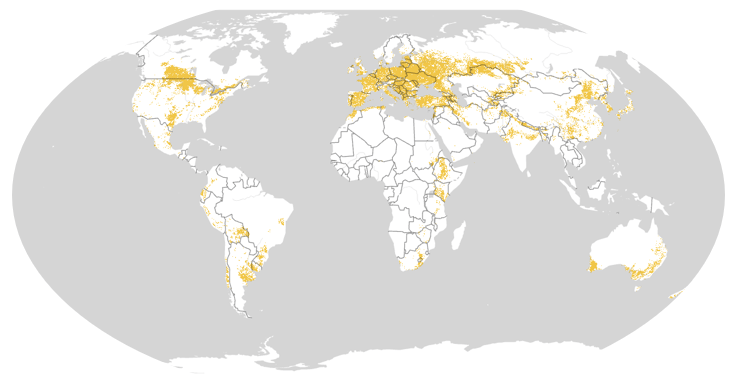
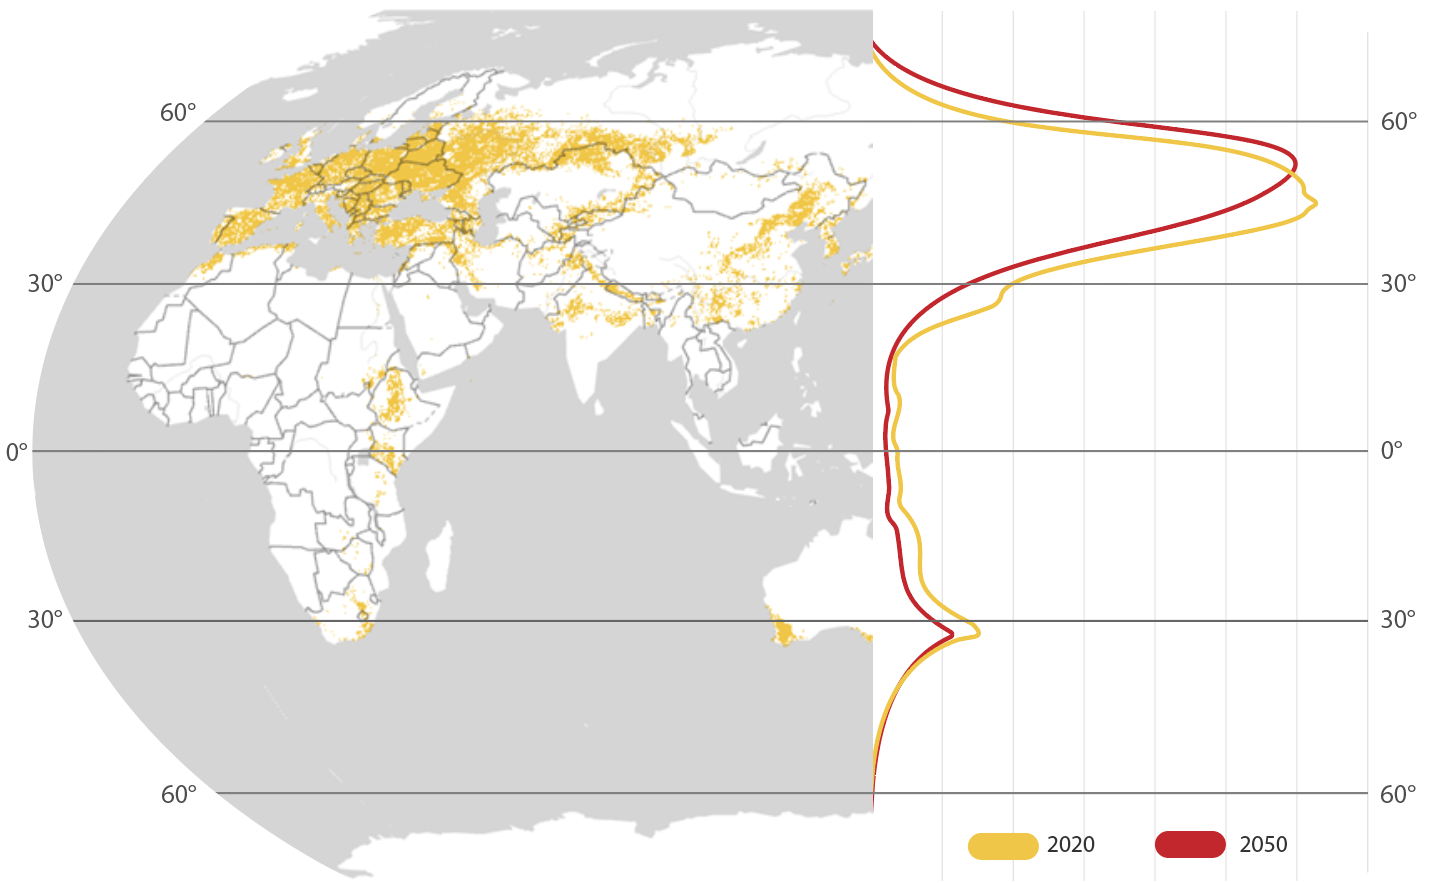
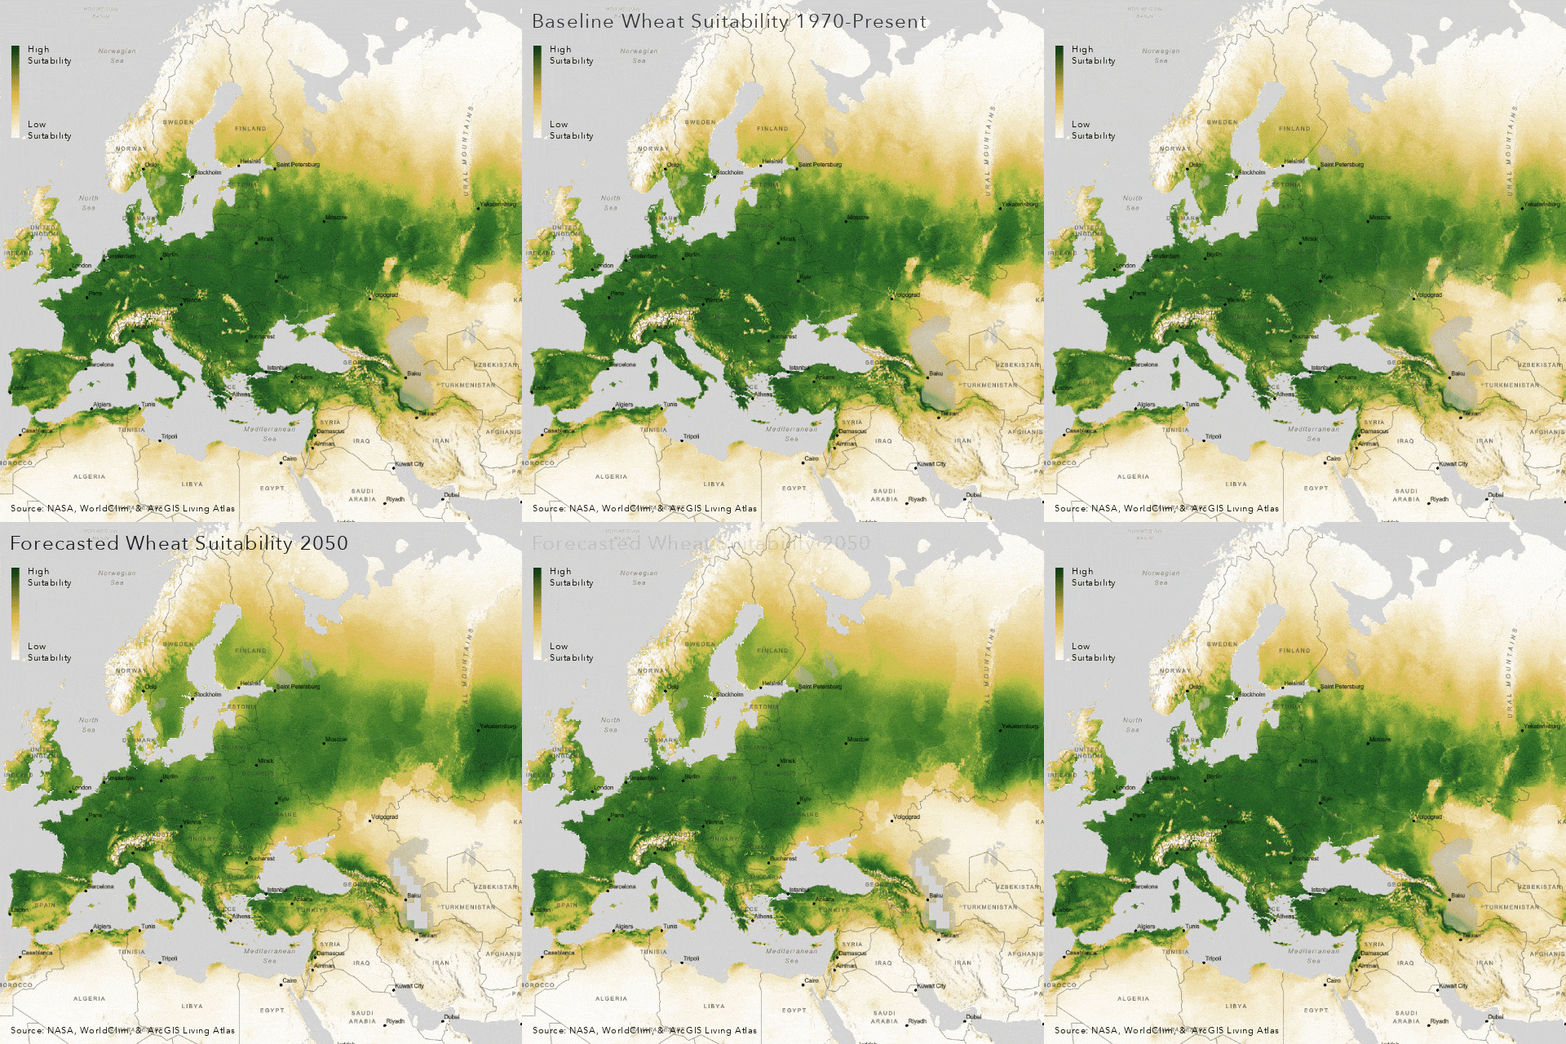
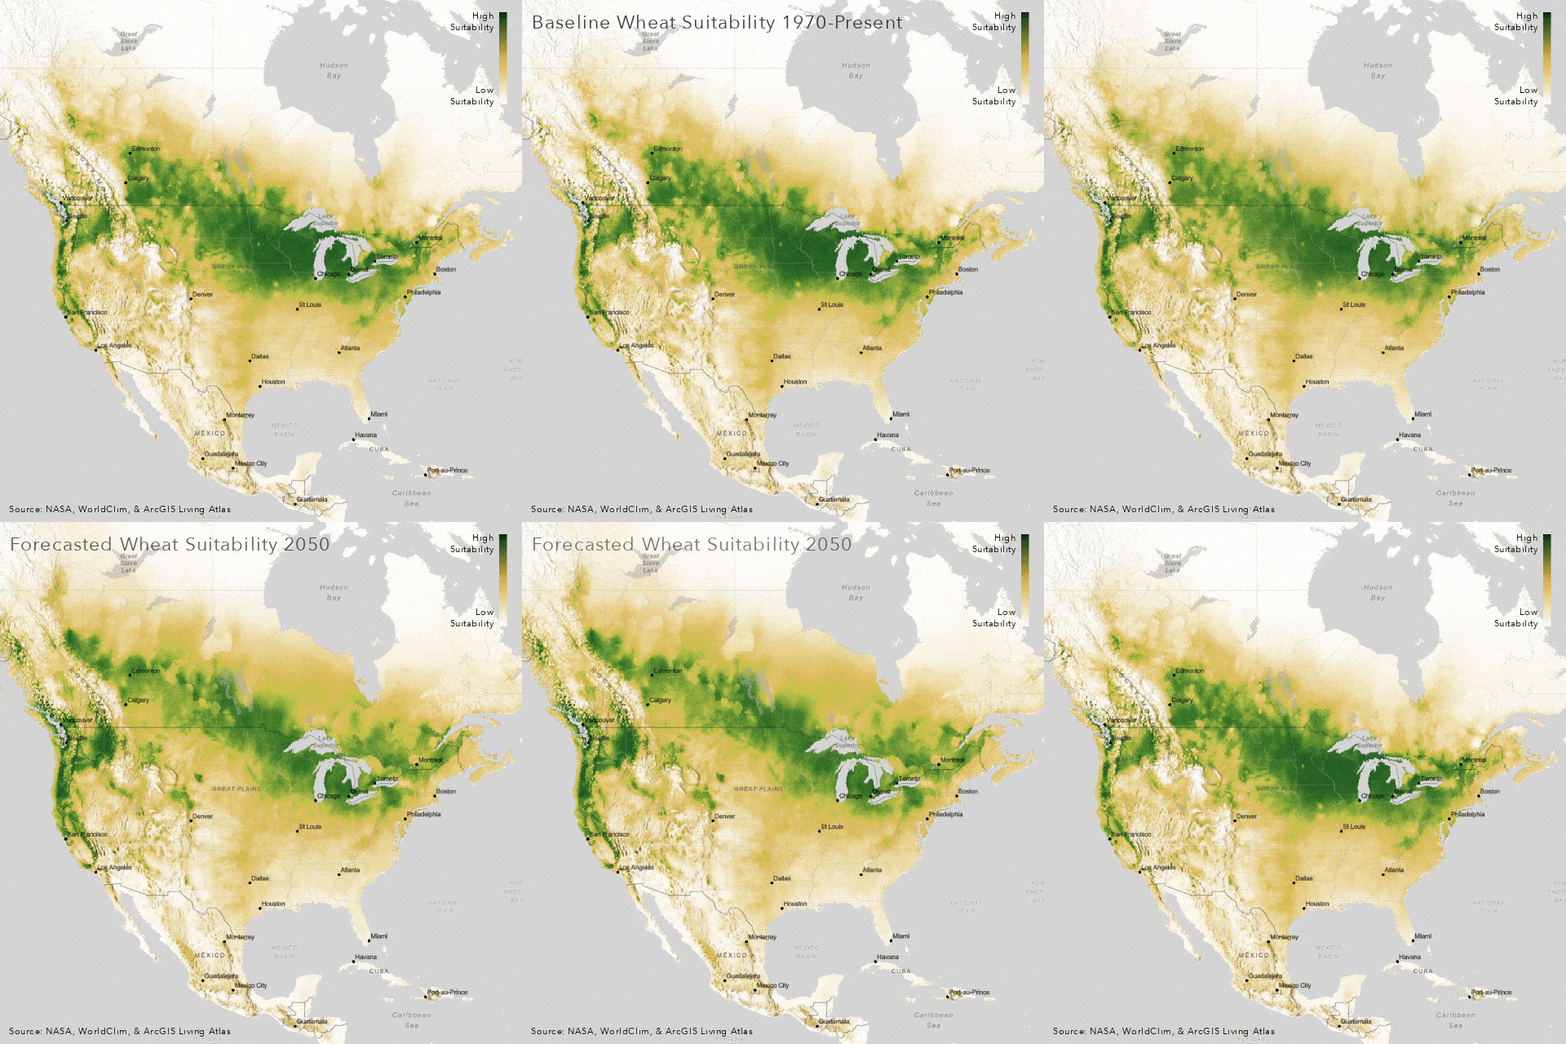
To better understand how climate change will impact global wheat suitability between now and 2050,you can use the new modeling tools that are available in ArcGIS Pro. Using the Presence-Only Prediction tool within the Spatial Statistic toolbox we applied correlative machine learning to study wheat suitability. We trained the model on NASA cropland data with 19 bioclimatic and two topographic layers and predicted using 2050 RCP 8.5 climate data, representing the “business as usual” emissions scenario. The model intrinsically learns the relationship between climate and wheat presence and can essentially predict wheat suitability across the entire globe.
The results show that wheat suitability is expected to shift dramatically to more extreme latitudes. Today, most of the world’s wheat is grown in the between 45 and 57 °N. Of those wheat-cultivating regions of the world, most will experience a decrease in wheat suitability. Areas beyond approximately 55 degrees of latitude may experience increased wheat suitability by 2050.
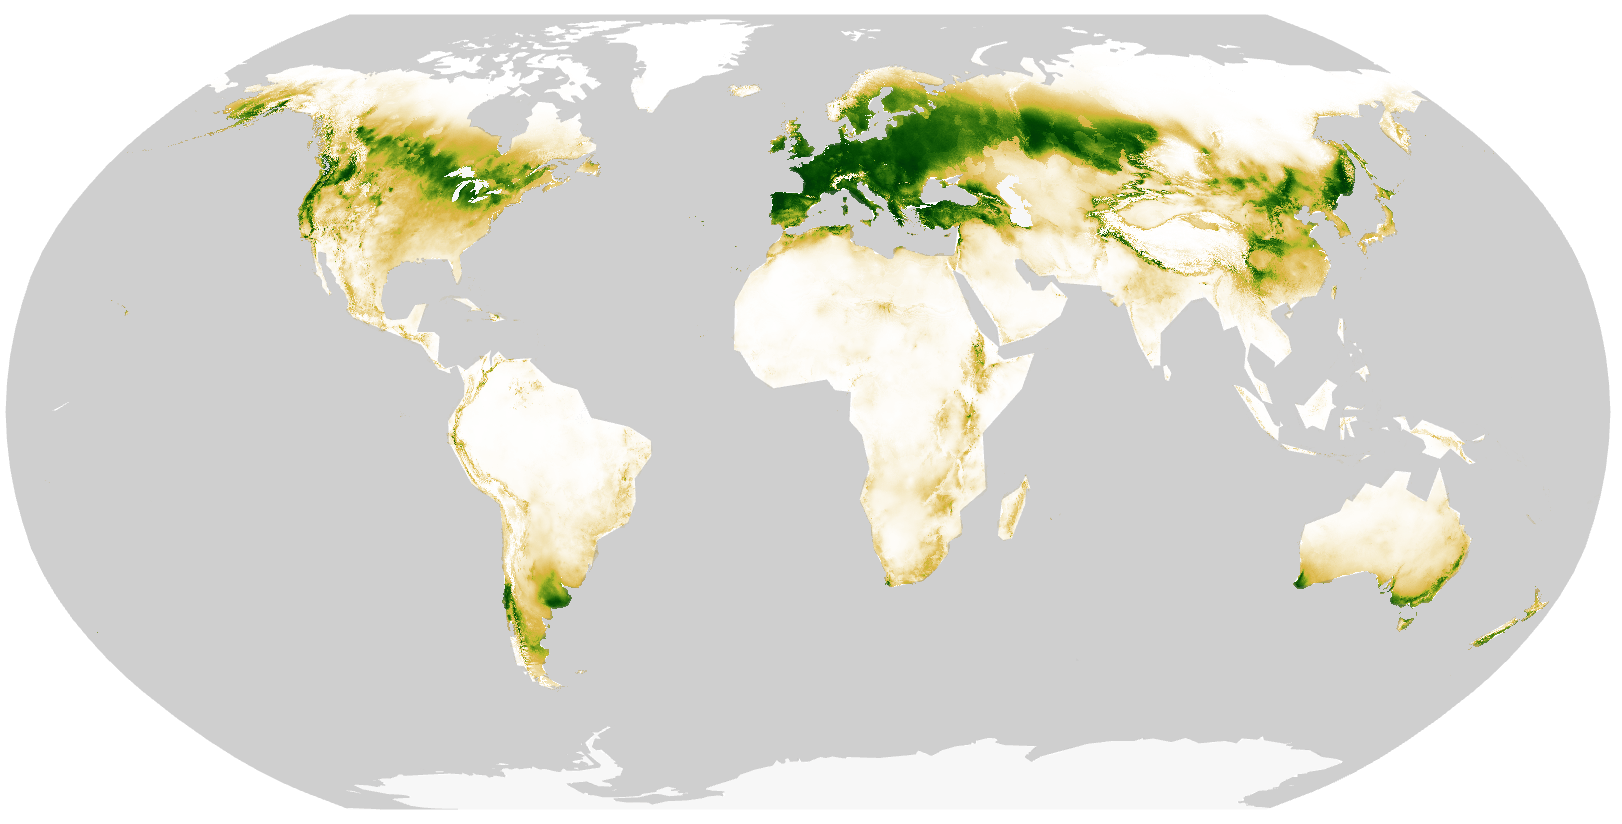
The latitudinal shift is strongest and most evident in the Northern Hemisphere due to the simple fact that there is more land in the Northern Hemisphere. This northward shift will likely mean that wheat cultivation will be further concentrated in the few countries set to see increases in suitability (Canada, Russia, and Scandinavia) at the expense of countries closer to the equator and more reliant of imports.
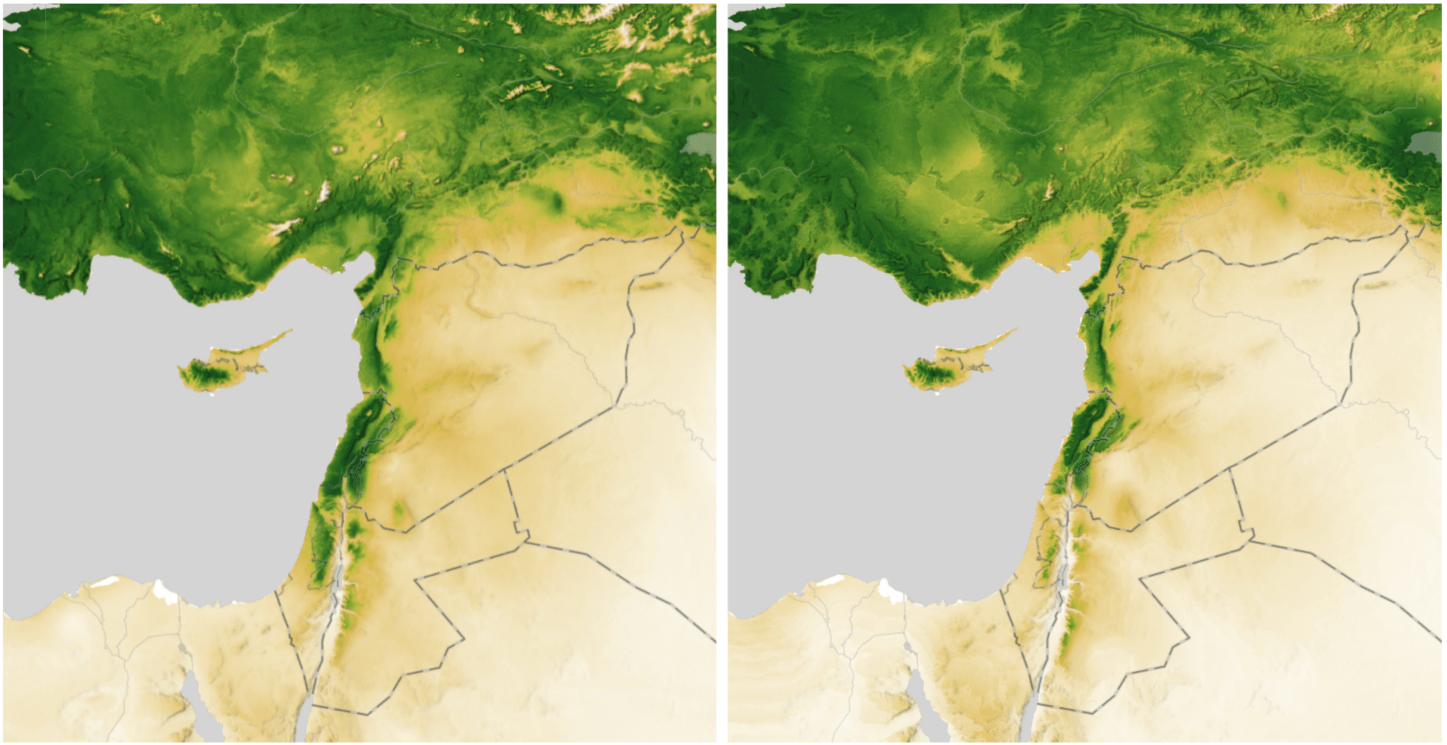
Lebanon
Though wheat may have been first cultivated in this region – what is now Iraq, Syria, and Jordan – the region is far from suitable to the crop now. Wheat suitability increases closer to the coasts and the foothills of the Caucasus.
By 2050, however, even these more suitable areas will become too hot for extensive wheat cultivation. In a region already troubled by recent conflict and civil war, food security of vital concern. Lebanon in particular has 2 million people who are severely food insecure, and as it stands, Lebanon imports 1.2 million metric tonnes of wheat annually – more than half of it coming from Ukraine. While the invasion of Ukraine will affect food security in Lebanon acutely, climate change also poses a more long-term threat. Wheat suitability will likely decrease notably within Lebanon. Such decrease in suitability will make Lebanon and neighboring countries more reliant on imports – whether from Ukraine or elsewhere – to support their populations.
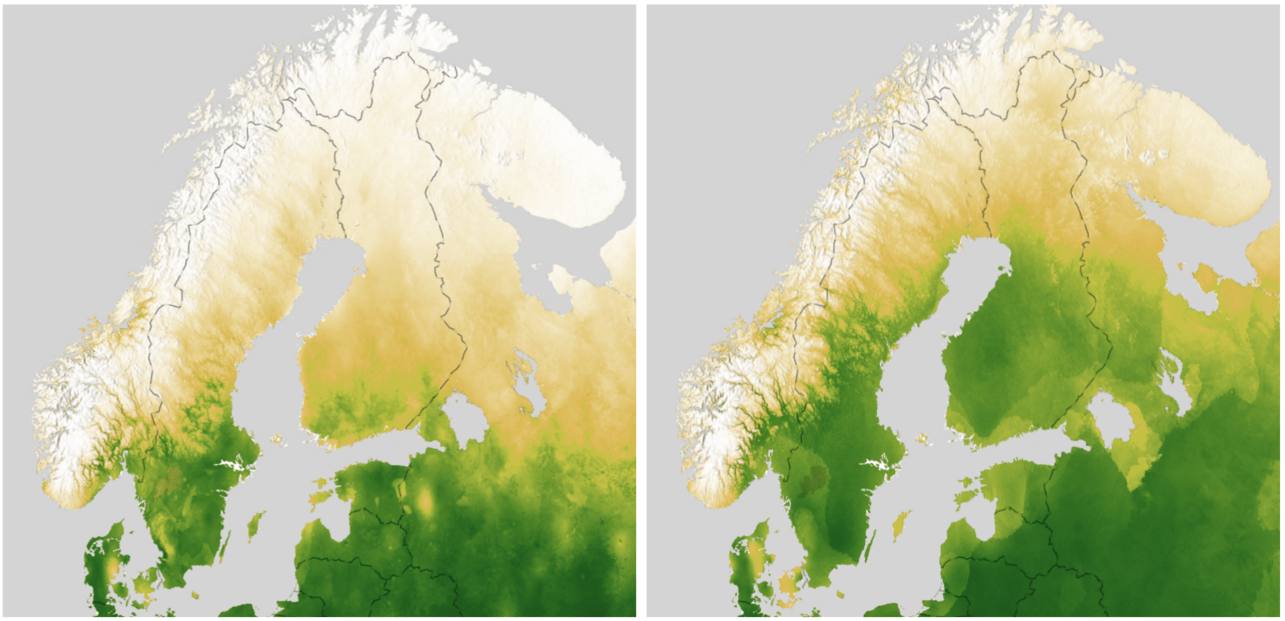
Scandinavia
While most of the world will see decreases in wheat suitability, Scandinavia is one of the few regions where wheat cultivation could increase. A region with a historically short growing season, Scandinavia will likely experience warmer, longer summers due to climate change. As a result, wheat suitability will creep northward into the subarctic regions of these countries.
The region as a whole exports very little wheat currently (1.2 million metric tonnes in Finland, Norway, and Sweden), but this value could increase as the region warms. Increased suitability in Scandinavia could help counterbalance losses elsewhere in the world if Scandinavia capitalizes on this opportunity and exports to countries where suitability will decrease.
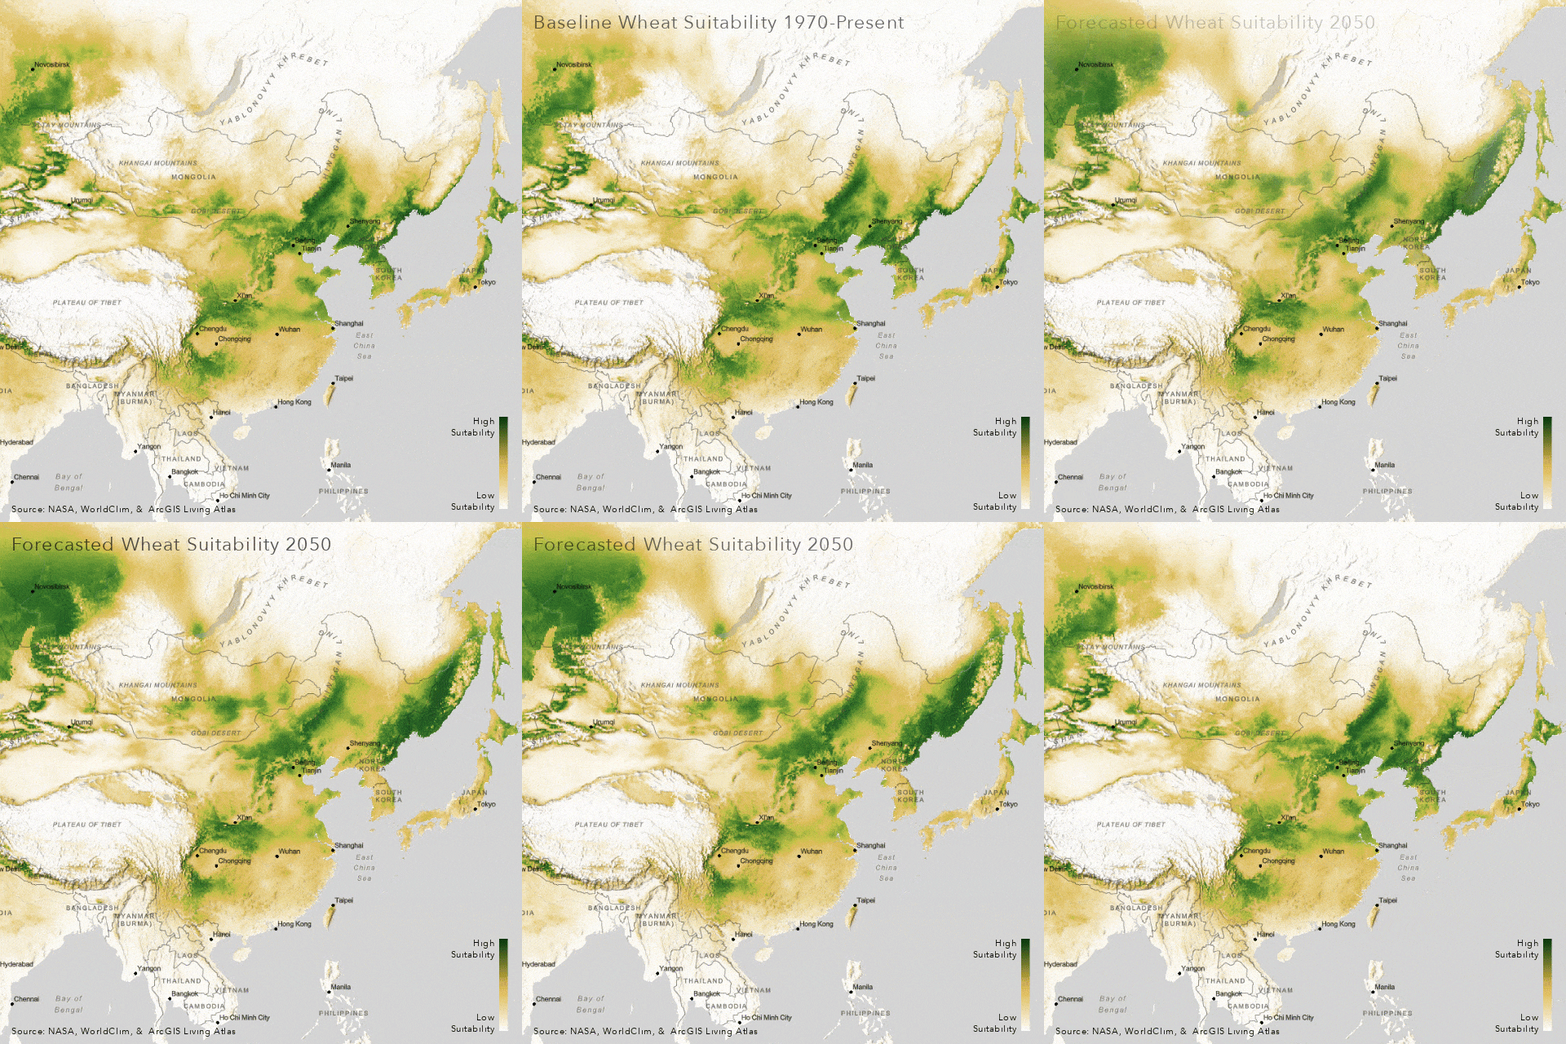
Animated Wheat Suitability
These were some of the most dramatic global shifts we saw of wheat suitability and thought they would be best represented as animations.
Asia
Europe
United States
Food suitability forecast: Implications
Predicting changes in food security is often bleak. Between conflict and climate change, many factors contribute to cropland destruction, supply disruptions, and decreased cultivation. With this foresight however, we can anticipate and plan for the impacts that climate change will bring. Data available within the Living Atlas can help demonstrate the risk climate changes poses to global agriculture and provide tools to understand and mitigate those risks.
Please see the webmap here to interact with the images and layers highlighted in this blog. If you have questions or comments about the methodology, we are happy to answer those questions directly.


Article Discussion: