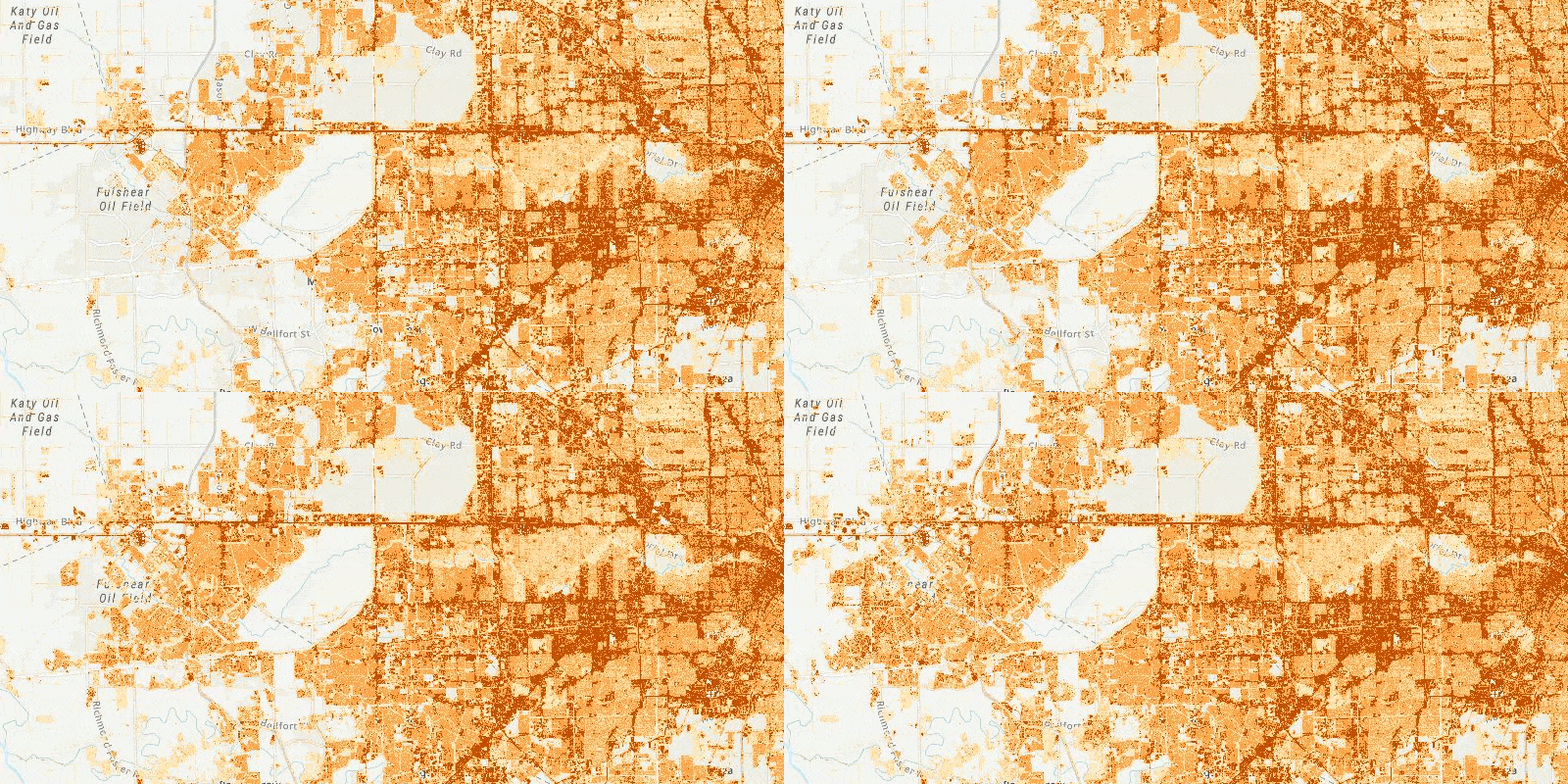
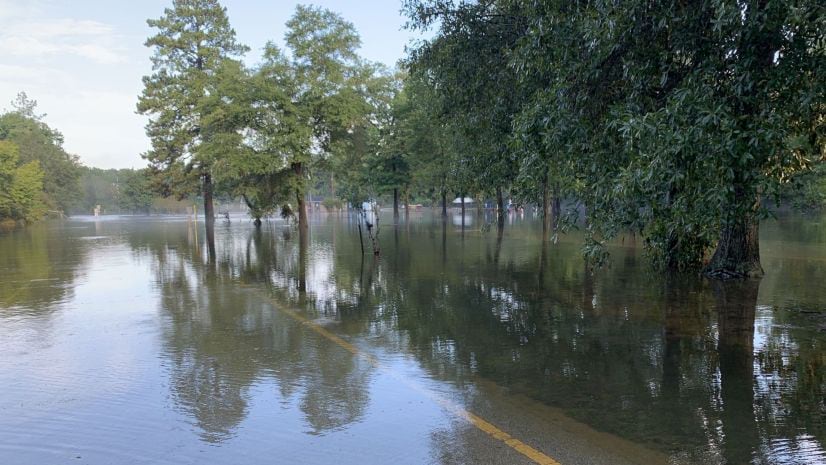
How does new construction change the landscape? Many of us know that the hard surfaces replacing bare soil and vegetation create an increase in surface runoff. But there are other effects of increased use of impervious surfaces. Hardscape creates places where pollutants collect. The runoff from rain events may contain pollution, especially if it hasn’t rained in a while. Furthermore, the storm water is diverted from entering the water table, so streams may shrink or dry up. How can planners keep track of these changes?
A new layer in the ArcGIS Living Atlas of the World provides a unique view into impervious surfaces in the Conterminous United States. The USA NLCD Impervious Surface Time Series shows the change in the extent and the percentage hardscape of the surfaces over time.

The images in the time series were produced by MRLC, the Multiresolution Land Characteristics Consortium, a 20 year partnership responsible for producing land cover updates of the United States. Direct project partners for this work include the United States Department of Interior, US Department of Agriculture, the LandFire consortium, USGS, US Forest Service, and NOAA.
The four impervious images are arranged into a single time series layer, served from a time enabled mosaic, which plays by default in the ArcGIS platform as an animation. But there’s much more to this layer than its film role will let on. There is real analytical power within this new service arrangement.
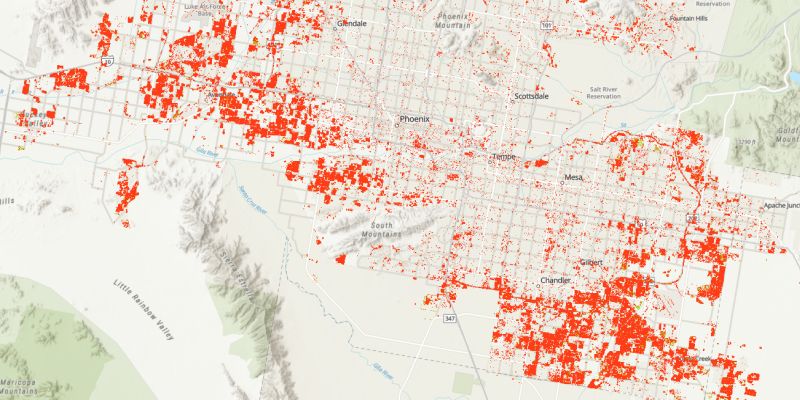
By using definition queries and raster functions in ArcGIS Pro, it’s possible to create a powerful new map which shows the areas that became impervious between any two dates in the series.

To see an example of how powerful this layer can be for analysis, check out this blog which shows how to make an impervious surface change map using this layer and ArcGIS Pro.
Also, be sure to check in with the Living Atlas community in GeoNet if you have questions or comments.


Commenting is not enabled for this article.