It is February 2025, and we are happy to announce the availability of Sentinel-2 Explorer. Sentinel-2 Explorer joins a collection of imagery exploration apps available in ArcGIS Living Atlas of the World. Simple, Accessible, and Insightful, these apps support our mission to help democratize remote sensing data and technology and engage a broader user community.
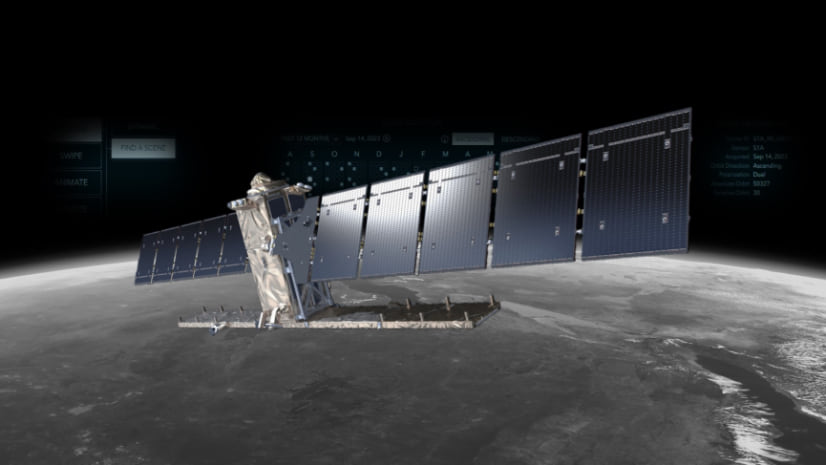
With its multispectral sensor and wide swath coverage, the Sentinel-2 mission not only offers continuity with the Landsat missions, it also expands upon them by offering greater spatial resolution and unique spectral capabilities for monitoring agriculture and vegetation around the world.
Powered by the Sentinel-2 Level-2A multispectral imagery from ArcGIS Living Atlas, and the ArcGIS Maps SDK for JavaScript, Sentinel-2 Explorer provides unprecedented ease of use and accessibility to the full archive of Sentinel-2 Level-2A science products. Whether educating the next generation of managers, scientists, influencers, and decision makers, or helping today’s community unlock useful insights, the app has something for everyone, furthering the reach of Sentinle-2 imagery and enabling innovation.
This article will step through and briefly describe the various modes of Sentinel-2 Explorer, serving as a reference guide and tutorial for the app. Enjoy!

Quick Links
Use the links below to jump to sections of interest.
The modes:
- Explore -> Dynamic
- Explore -> Find a Scene
- Swipe
- Animate
- Analyze -> Index Mask
- Analyze -> Temporal Profile
- Analyze -> Spectral Profile
- Analyze -> Change Detection
Dynamic Mode
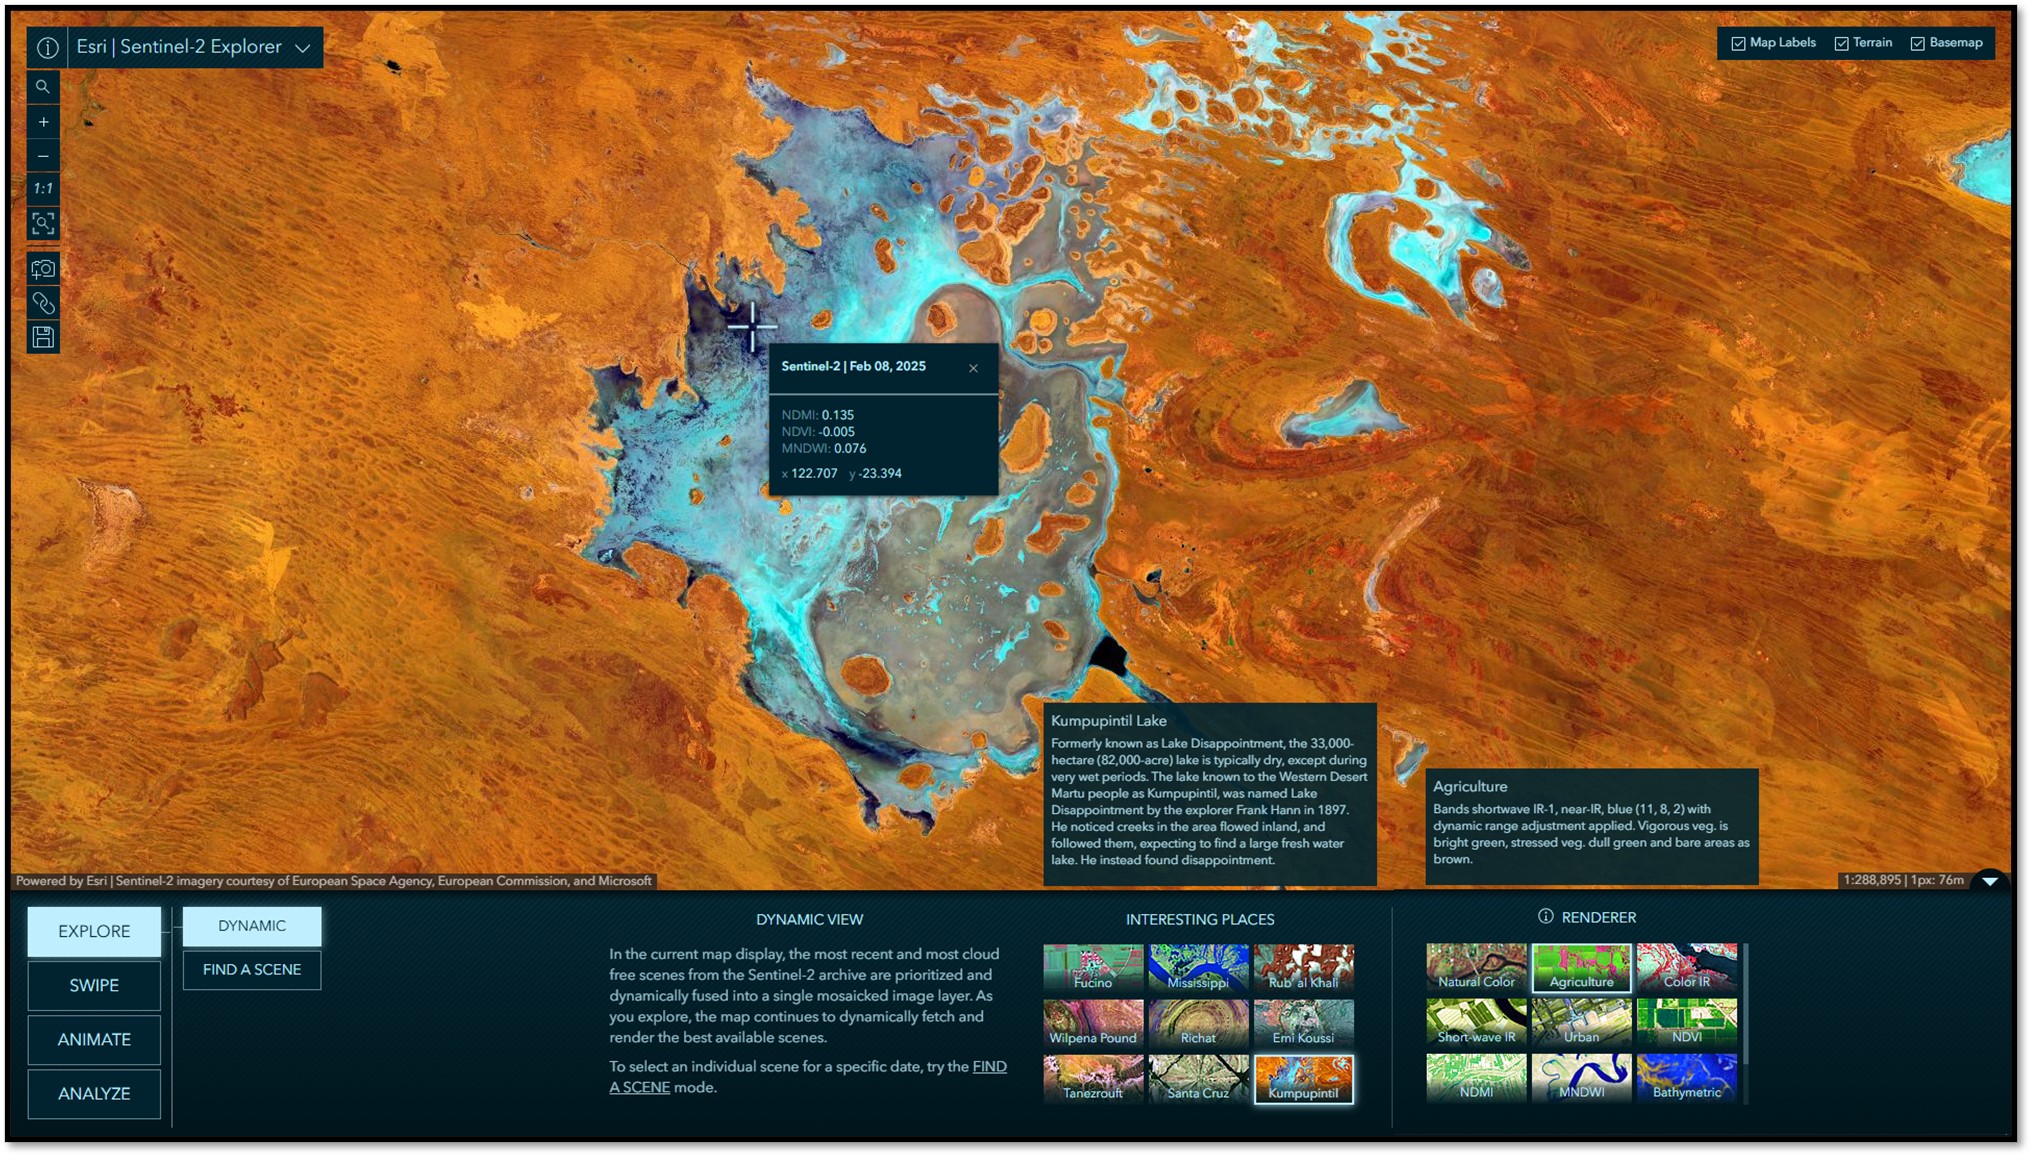
The app opens in Dynamic mode by default. In this mode, the most recent and most cloud free scenes from the Sentinel-2 archive are prioritized and dynamically fused into a single mosaicked image layer. As you pan and zoom, the map continues to dynamically fetch and render the best available scenes. You can select and learn about a variety of interesting locations around the world. You can also select from different spectral renderings of the imagery, highlighting different types of information.
Find a Scene
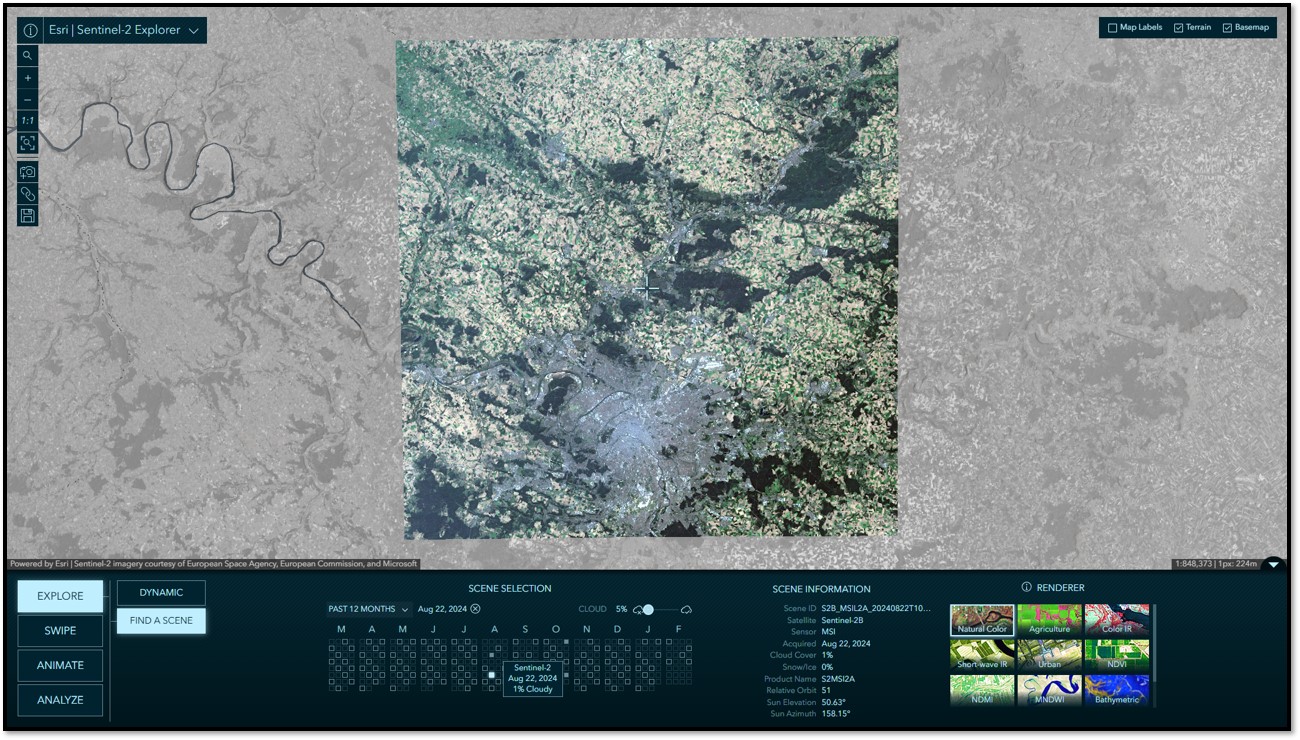
This mode allows for the selection of individual Sentinel-2 scenes by year, month, and day. By default, the calendar displays the past 12-months of available scenes. Available scenes can also be filtered by cloud cover. The scenes matching your criteria are included in the calendar and those meeting the specified cloud cover tolerance are highlighted with a solid fill. Hover over a square for an information tool tip and click on it to load that scene into the map view. Detailed information about the selected scene is provided in the Scene Information panel. The “find a scene” functionally is leveraged throughout the app, simplifying the discovery and selection when and where you need it.
Swipe
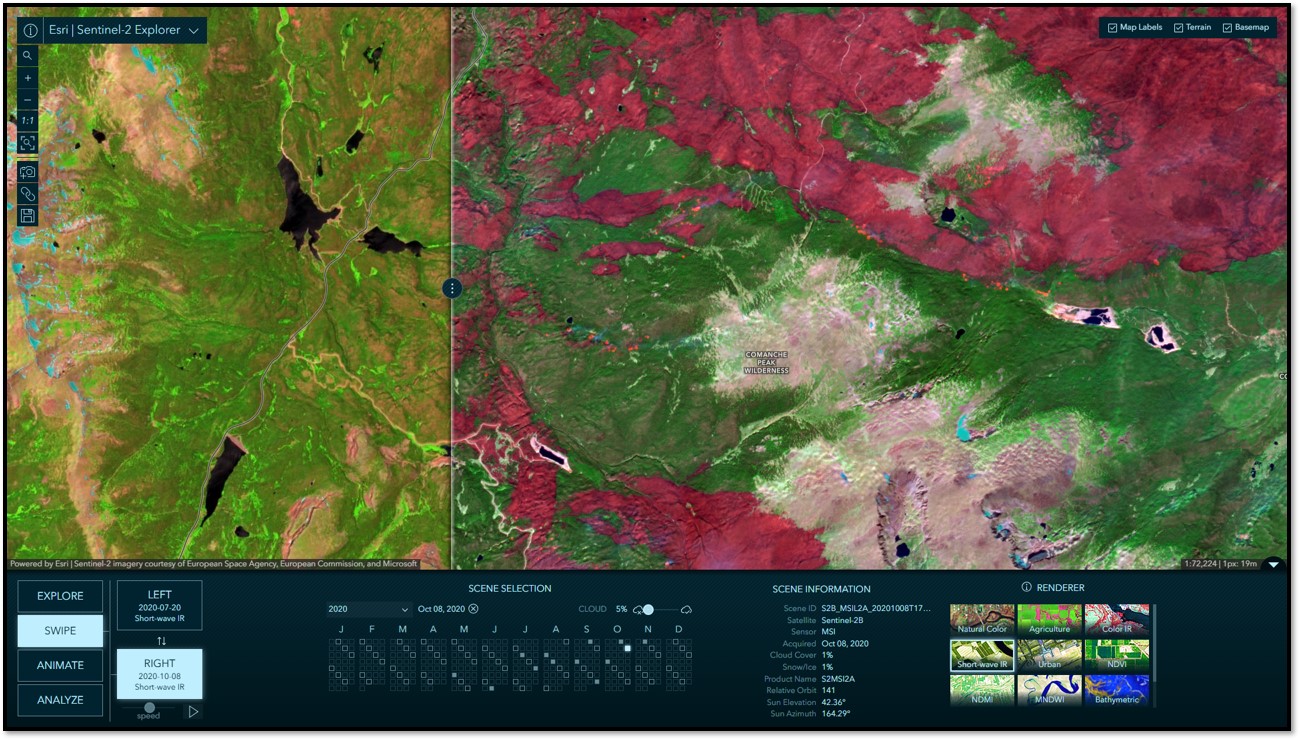
In Swipe mode, you can select two scenes to swipe and visually compare differences between them. It is common to choose between scenes of different dates, but you can also swipe and compare different renderings of the same date, or mix and match. Swipe is a simple yet very powerful way to visually detect, explore, and analyze differences and similarities between two images. Below is a before and after comparison from a portion of the 2020 Cameron Peak fire in Colorado, USA. The image on the left shows pre-fire conditions, while the image on the right is post-fire, where the burn scars are readily visible as a fuchsia color in this Short Wave Infrared spectral rendering. Also visible in the image on the right are some active fire hot spots shown in orange.
Animate
In Animate mode, you can select multiple scenes to create compelling time animations. Click “+ Add a Scene”, select a date, and repeat. When you have gathered your collection of images, click the play button to start the animation. During playback, you can choose your frame rate and optionally export your animation to an MP4 with the layout of your choosing. The animation below was assembled in just a few minutes, showing seasonal center-pivot agricultural field variation in the desert near Tubarjal, Saudi Arabia throughout 2024.

Index Mask
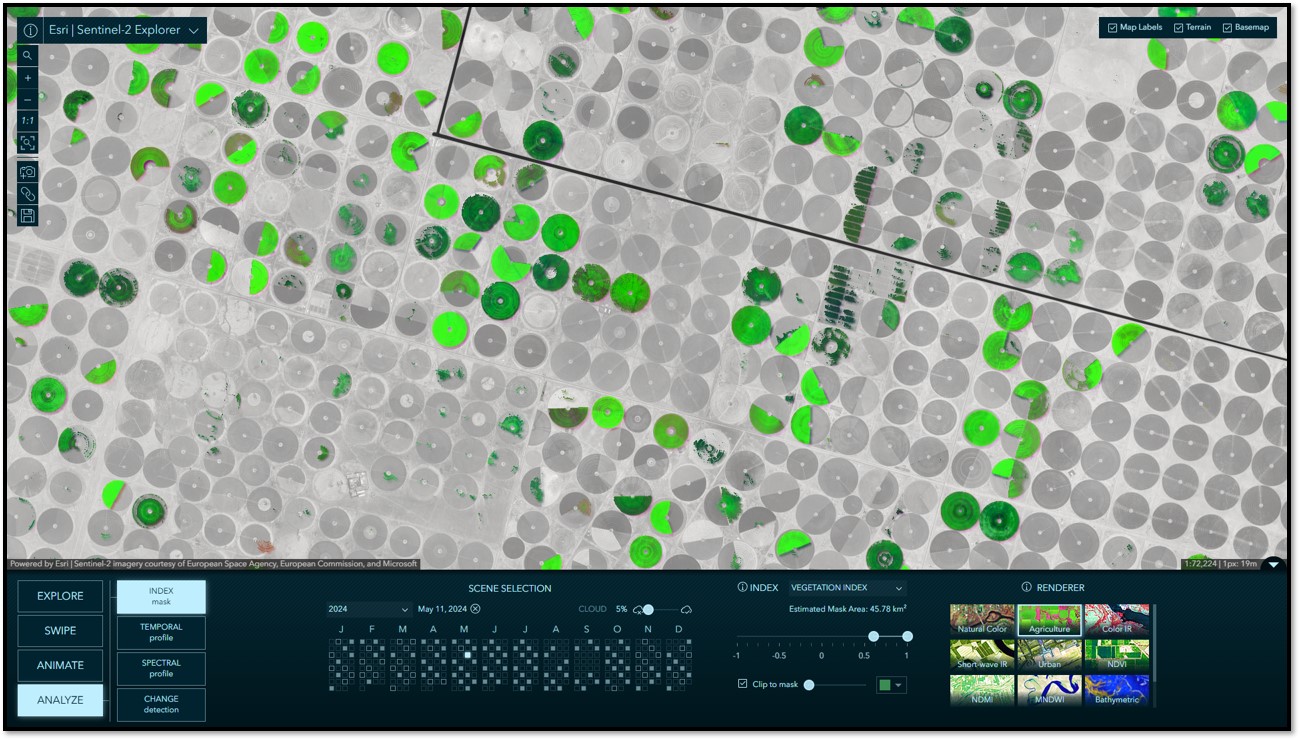
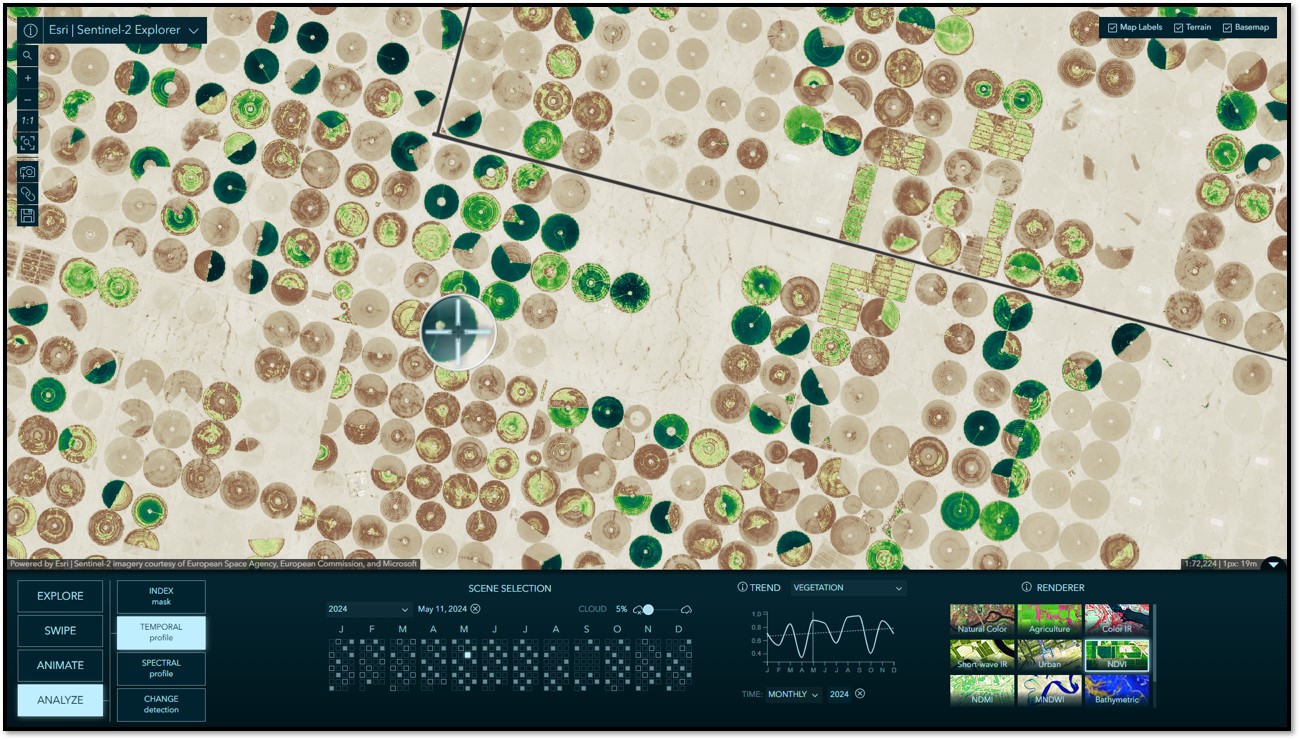
In this mode you can use spectral indices, derived from band arithmetic, to measure relative abundance of things like water, moisture, and vegetation. As you move the slider, a mask is dynamically rendered on screen indicating the areas meeting the specified thresholds. Alternatively, the mask can be used to clip the image and only show the original image pixels meeting the specified thresholds. In the example below, over the same agricultural fields near Tubarjal, Saudi Arabia, only the pixels in the selected image with an NDVI value greater than 0.6 (dense green vegetation) are displayed.
Temporal Profile
Using the temporal profile tool you can detect categorical trends over time, including moisture, vegetation, and water. When “Yearly” is selected, you can specify the target month you would like to be sampled year over year. This option is best for identifying long term patterns and trends. When “Monthly” is selected, you specify the target year and all 12-months within that year will be sampled. This option is useful for seeing seasonal patterns and fluctuations throughout the year. Here, we clicked within a field and can see the monthly vegetation index (NDVI) values at that point for the selected year.
Spectral Profile
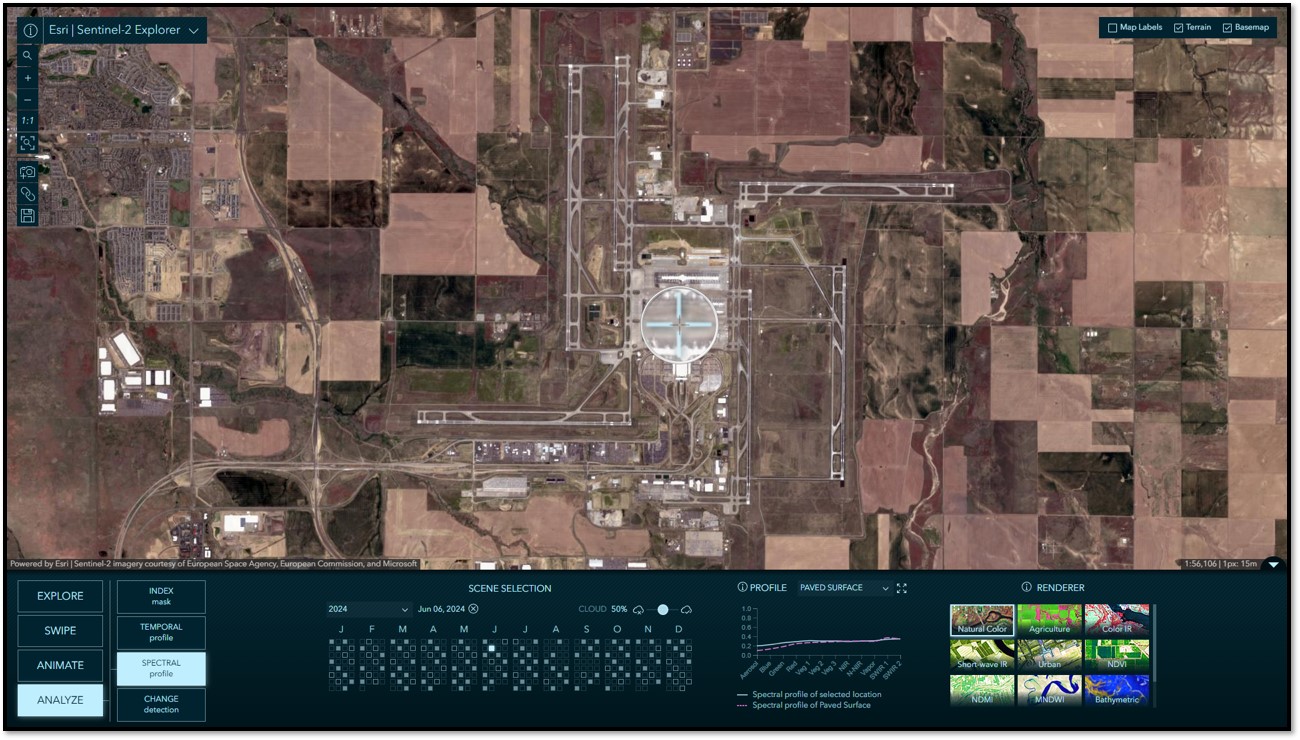
Multispectral imagery provides measurements of the varying amounts of light that different materials reflect. In other words, their spectral responses. By collecting samples of the spectral response for the same type of material on the Earth’s surface, it is possible to build a spectral signature for that material. In this tool, you can click anywhere on the map and a spectral profile for that point will be generated. Simultaneously, we will try to match that selected point with one of the pre-defined spectral signatures available in the dropdown list. You will find plenty of correct matches, but you will also find false matches. This can be attributed to multiple factors, including our sampling methodology and some inherent limitations in the data. However, this should be taken as an opportunity to imagine what is possible with Sentinel-2 imagery.
Change Detection
In this mode, you are able to select two images and calculate the difference between them. You can create change masks based on vegetation, water, and moisture indices. Creating difference images allows you to then do further analysis, such as estimating forest and vegetation loss in the event of a wildfire. Using the same two before and after images from Cameron Peak fire in the Swipe example above, we can calculate the difference in vegetation between the images to create a difference mask. Then, we are able to use the threshold slider to quickly get an approximate delineation and surface area of the vegetation loss due to the fire.
More Information
Sentinel-2 Explorer: New vs Classic
For anyone familiar with or still using the Classic version of Sentinel-2 Explorer, you should know that it has been placed into mature support and is no longer being updated. It will still be around to allow time to transition, but we do encourage you to begin using the new app: https://livingatlas.arcgis.com/sentinel2explorer
A suite of imagery explorer apps
Sentinel-2 joins a small but significant collection of imagery exploration apps in Living Atlas.
Sharing the code
In the interest of innovation, all of the source code for these Living Atlas imagery explorer apps is available for anyone to access on GitHub.
As always, many thanks to the talented team I have the great pleasure of working with:
App development: Jinnan Zhang
UX/UI and cartographic design: John Nelson
Sentinel-2 archive and image service development: Vijay Pawar, Abhijit Doshi, and James Sill
DevOps: Sreekumar Sreenath


Article Discussion: