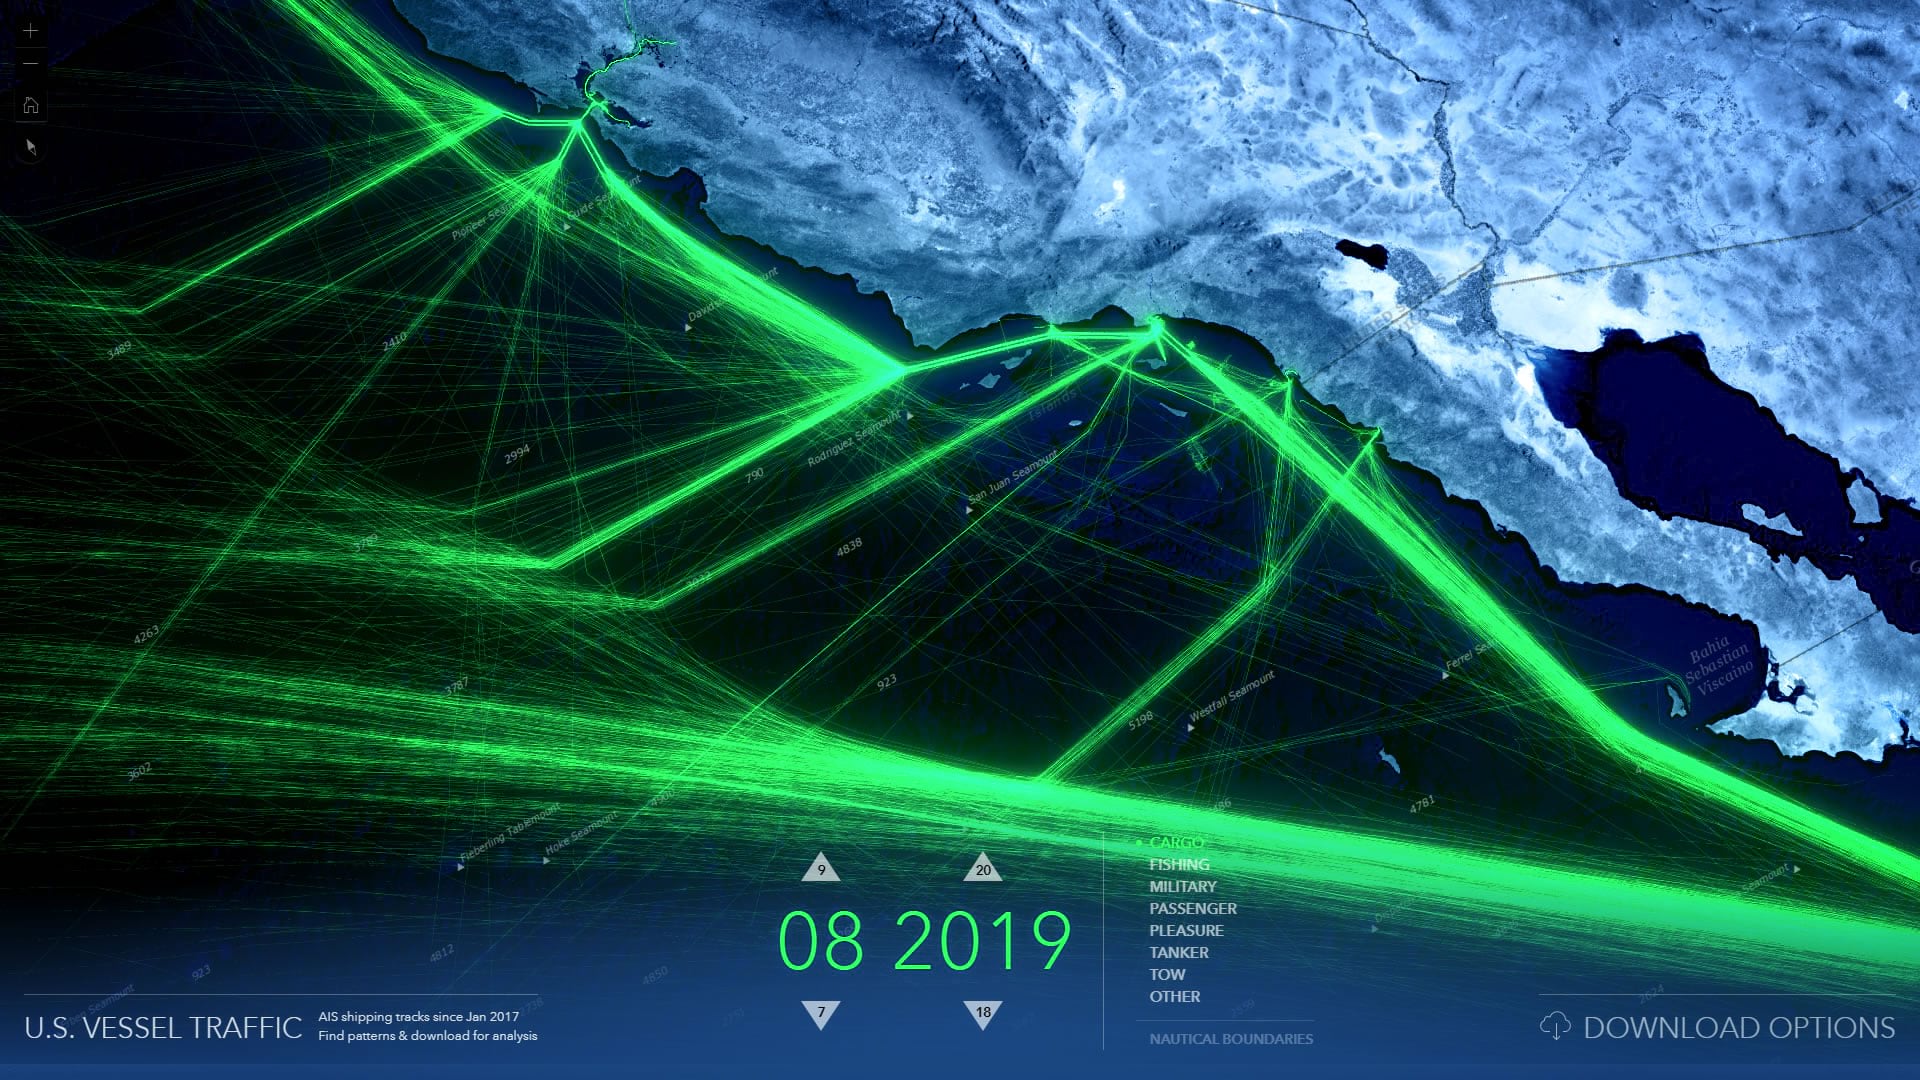
The Living Atlas U.S. Vessel Traffic application is a new and fun tool that lets you explore the paths of vessels in and around U.S. waters, look for patterns and trends by time, vessel type, and place, and it provides a simple and efficient way to download manageable-sized, area-specific, excerpts.
Give it a look here:
livingatlas.arcgis.com/vessel-traffic
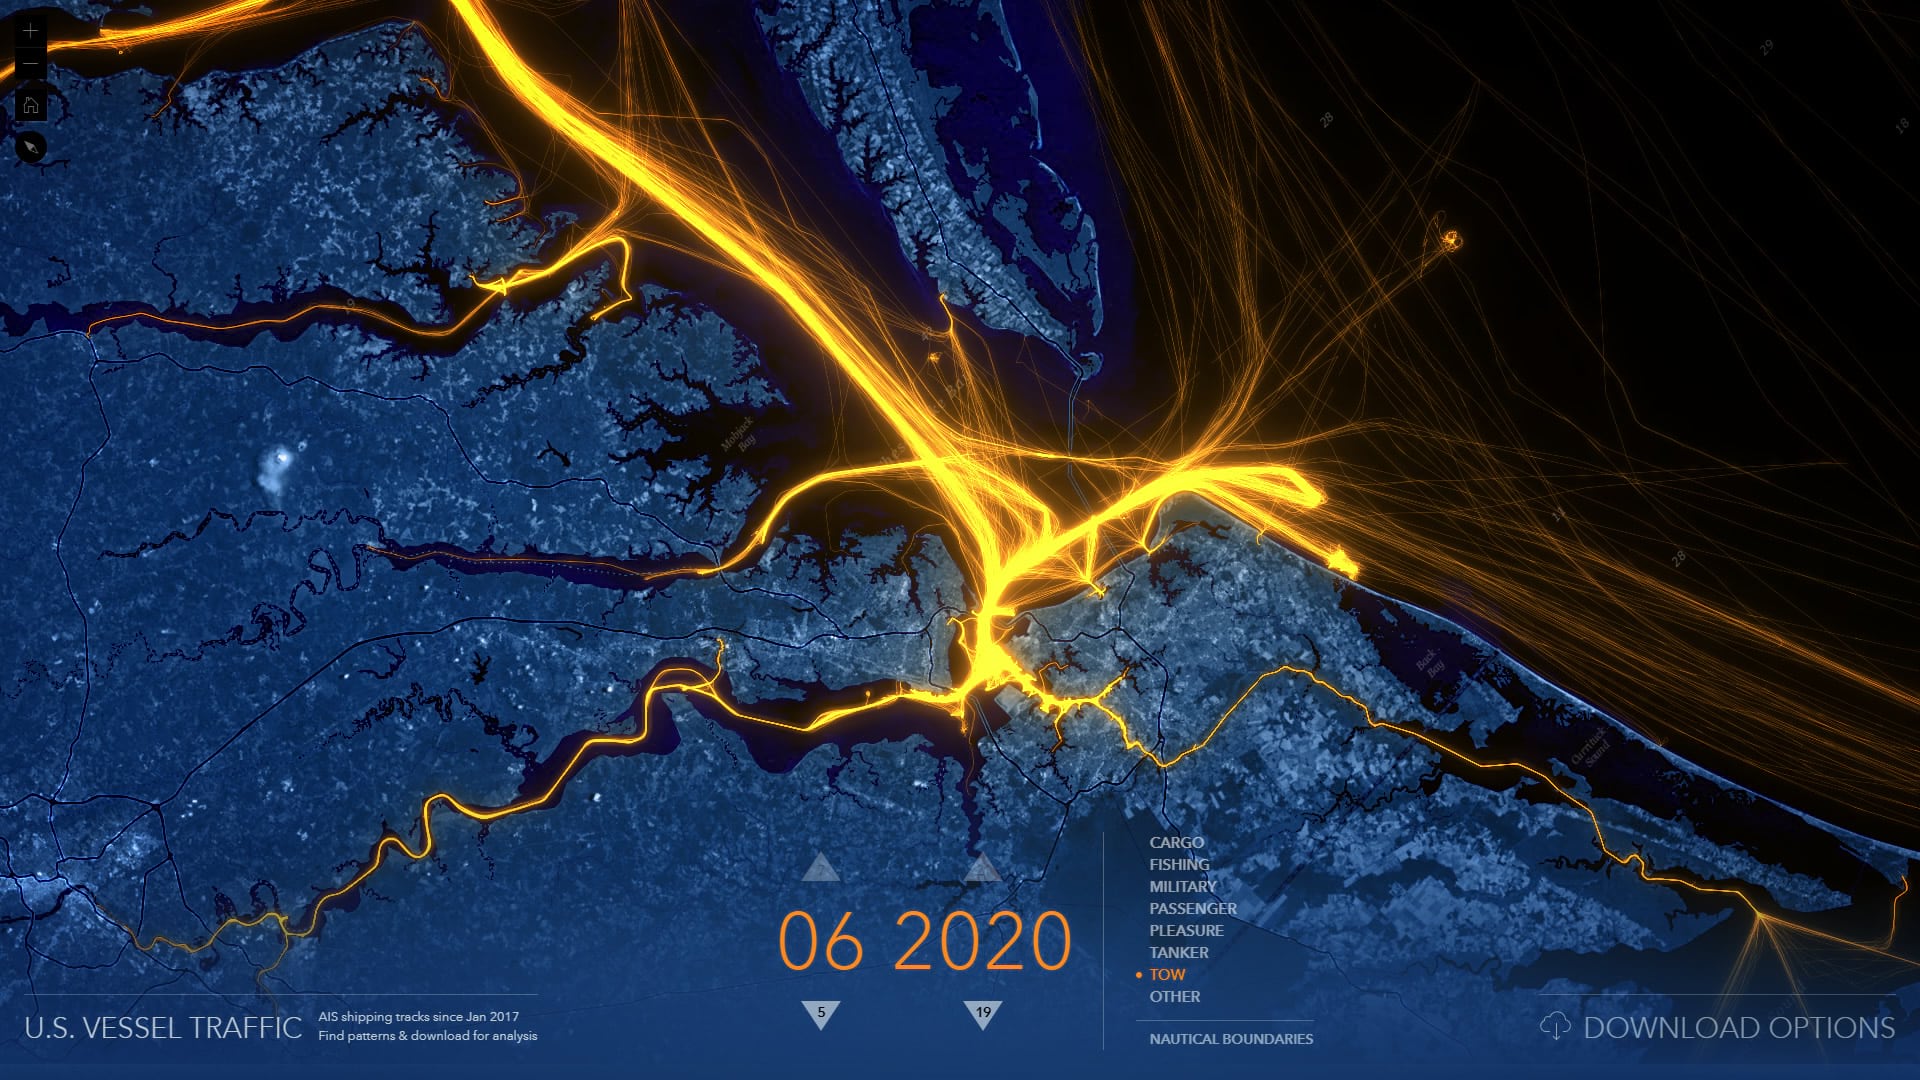
What
U.S. Vessel Traffic is a web map, built with the ArcGIS API for Javascript, to provide a simple tool to visualize and access the massive, and ever-growing, footprint of nautical transportation and commerce. The data is sourced from the Automatic Identification System (AIS) provided by the USCG, NOAA, and BOEM through Marine Cadastre.
The time filter allows for the selection of a specific month, currently dating back to the beginning of 2017 and extending into the most recently-available month of processed vessel traffic. A categorical filter segments vessels into seven popular types and one catch-all other category. Nautical boundaries are available as a reference to provide context at close scales.
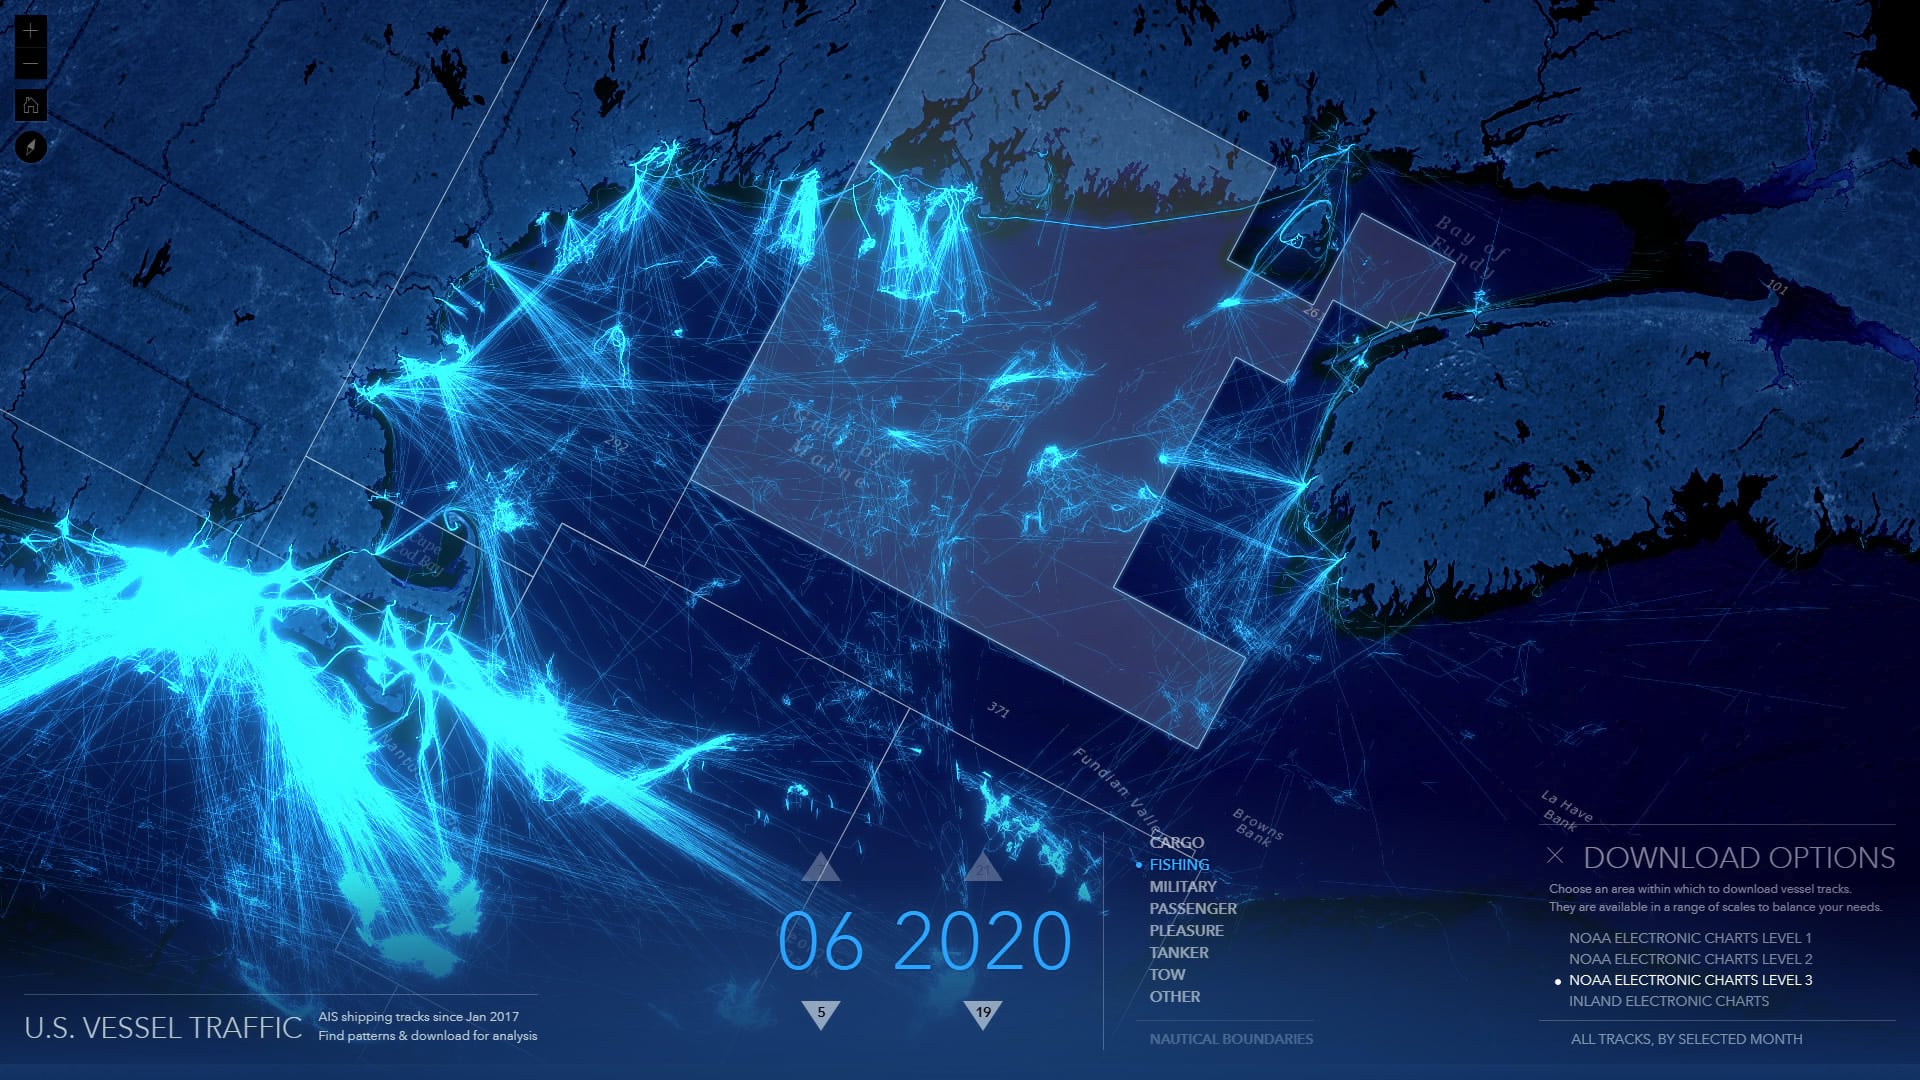
A category of areas of interest (NOAA Electronic Navigation Chart areas) provide geographic subsets within which vessel tracks can be downloaded. They are available at a number of scales, from level 1 (vast) to level 3 (regional) as well as inland waterways.
Why
Because it’s there! AIS data is wonderful and fascinating but its size can be an immediate impediment to would-be virtual explorers. The primary purpose of the AIS system is to provide vessels themselves with nearly-current information about other vessels in their area, for safe navigation and collision avoidance. Great heaps of historic points, however, can be used to connect breadcrumb-style, time-informed paths of vessels. While this point data is made freely available, the prospect of first downloading, converting, and managing gigabytes of data is a considerable barrier to entry —even for those with the tools, bandwidth, and inclination to do it. The U.S. Vessel Traffic app aims to provide an engaging visualization of, and access to, all that data.
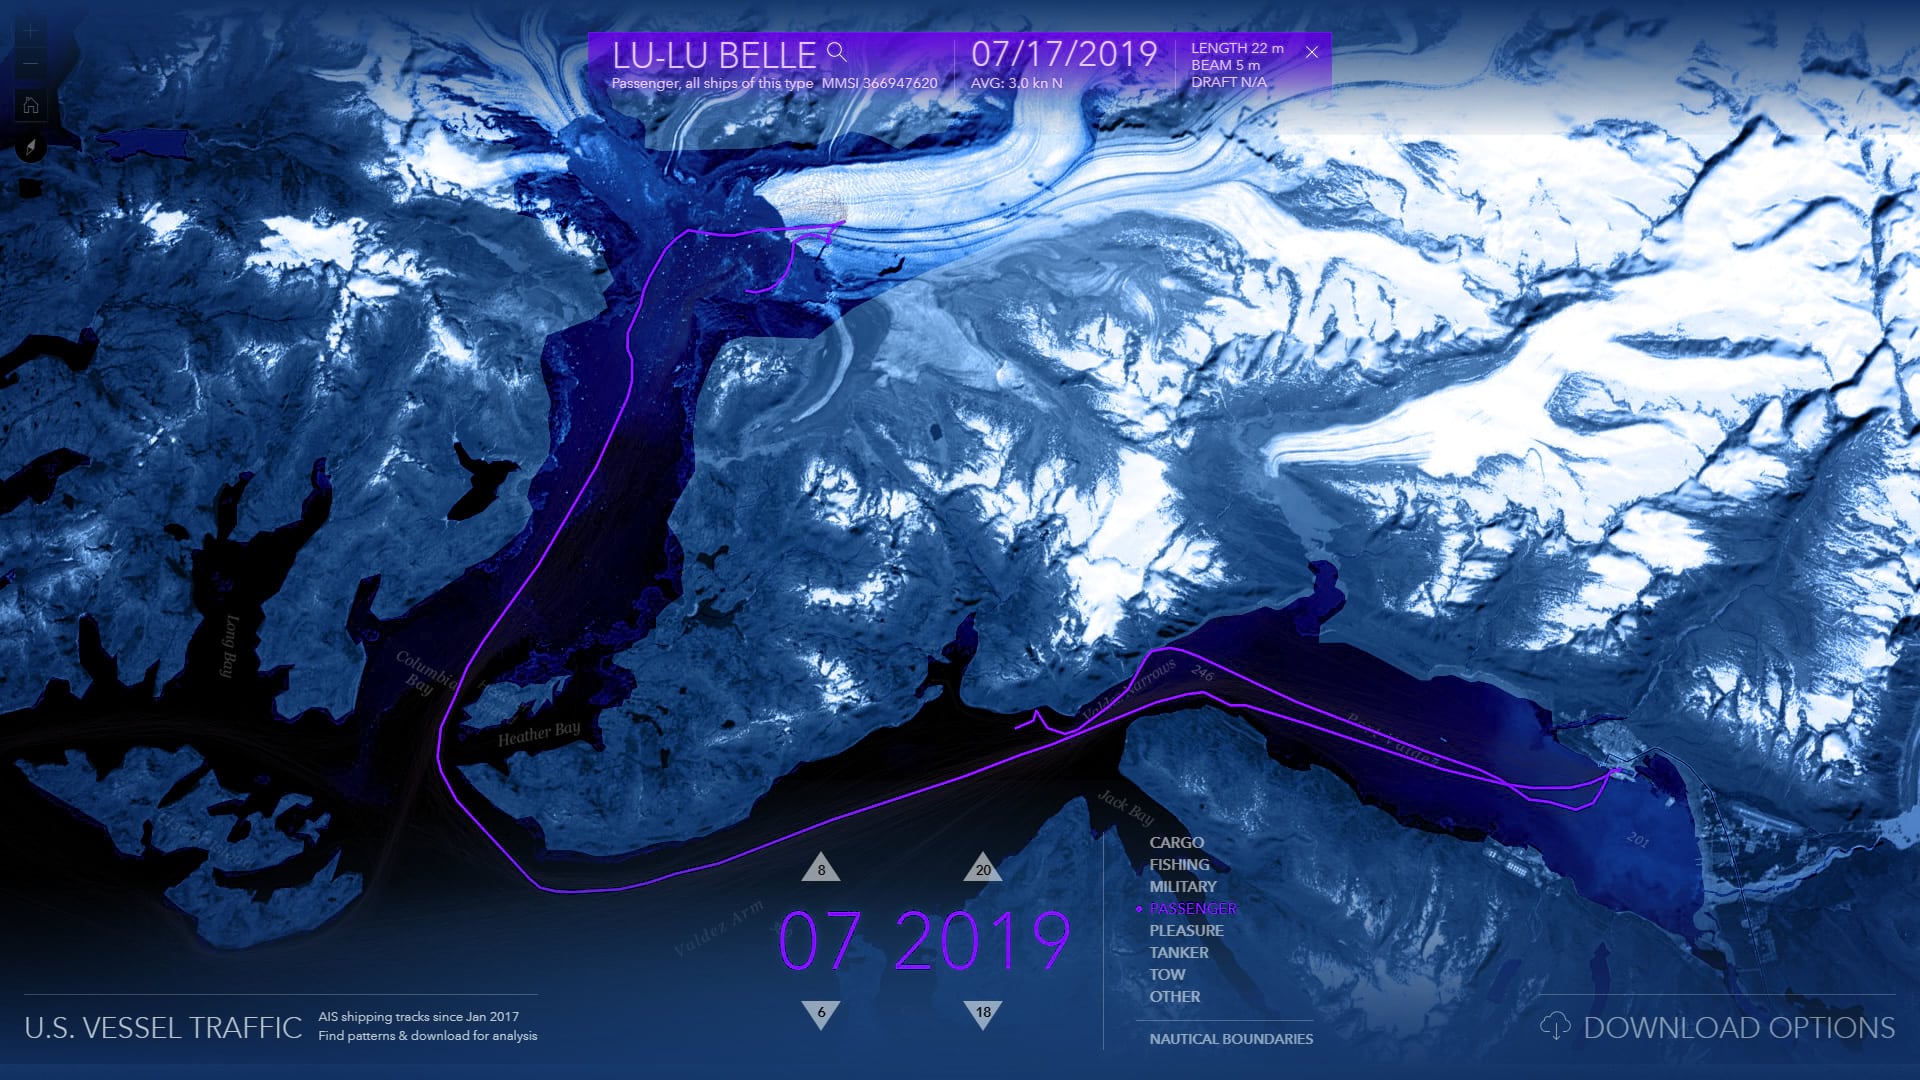
Visualizing stacks and stacks of paths provides windows into understanding the drivers of vessel traffic, which, like any other social science data, reveal echoes of other harder-to-measure phenomena. We’ll provide some interesting examples and explanations in a follow-up post, but for now we hope you enjoy tripping through the intricate web of marine traffic and find interesting patterns of your own.
How
Explorers
Navigate around and have a look. In many cases, that will be the long and the short of it. And that’s cool because there are so many patterns to explore and question. But if you are interested in downloading this data for your own analysis here’s how…
Analysts
The Download Options panel in the lower-right corner of the screen provides some predefined areas of interest, based on NOAA’s nautical charts. Choose the scale that best fits your needs; these reference areas will appear on the map (some of the areas can be pretty large, so if you don’t see anything try zooming out). Click any of these areas to get a geodatabase of tracks within; you’ll get all vessel types, for all months since 2017.
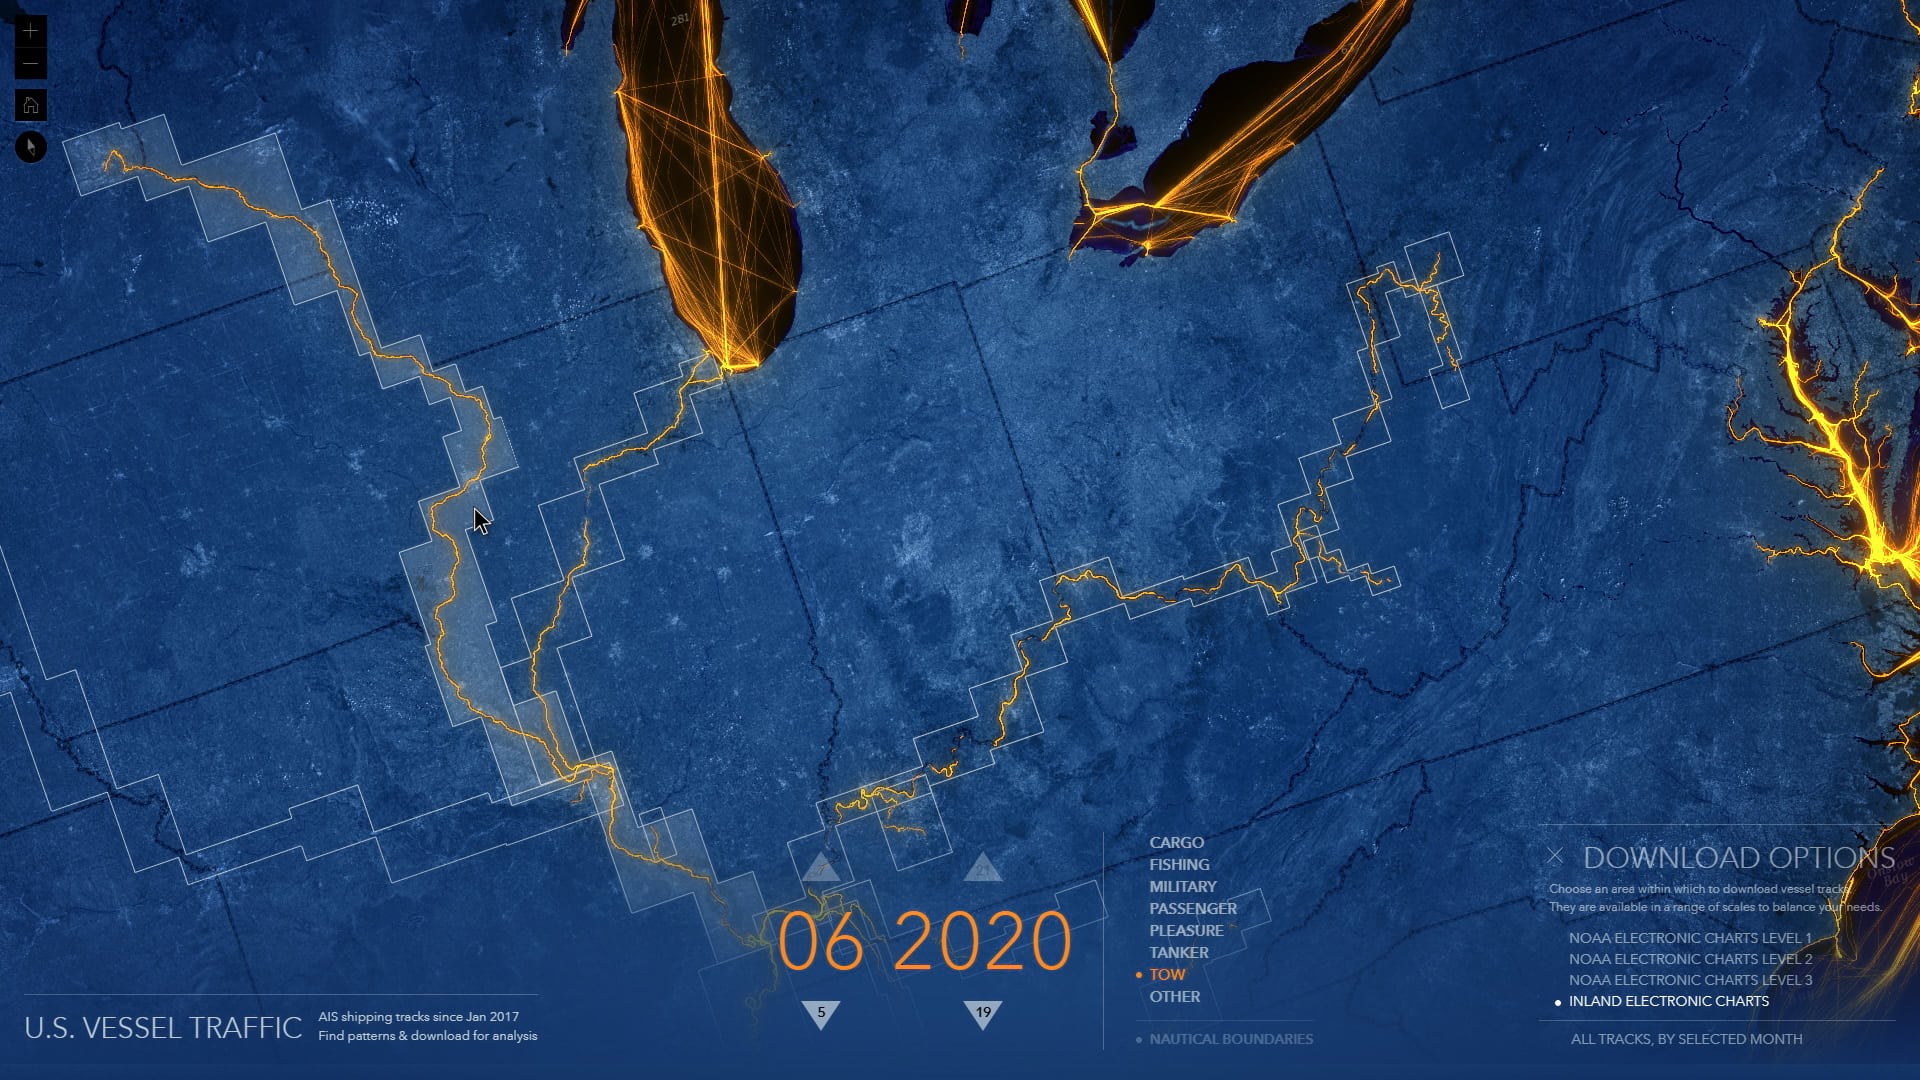
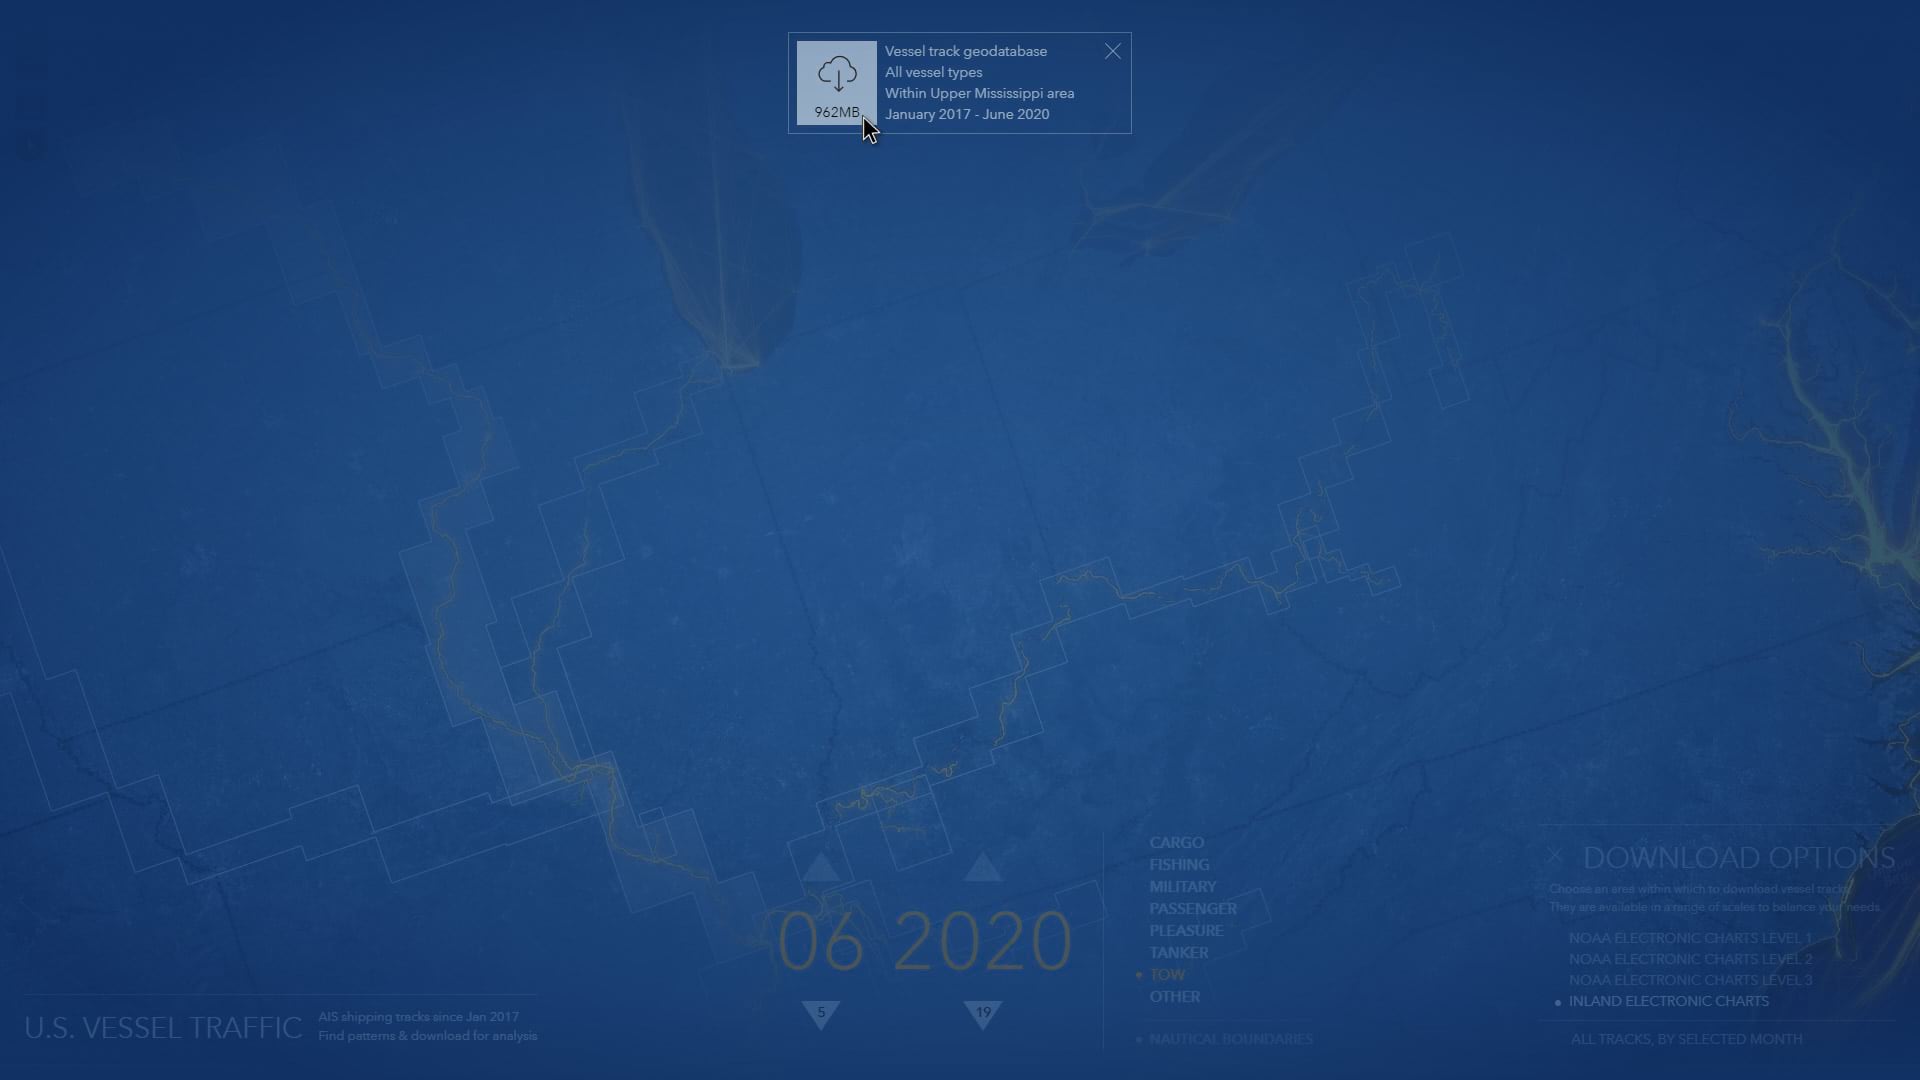
If, instead, you’d like to download the full geography of tracks, rather than restrict it to a specific area, then choose the “all tracks, by selected month” button in the download options panel. This will let you grab all vessel types for the full area, but is limited (to keep file sizes lean and mean) to the selected month.
Bold Data Wielders
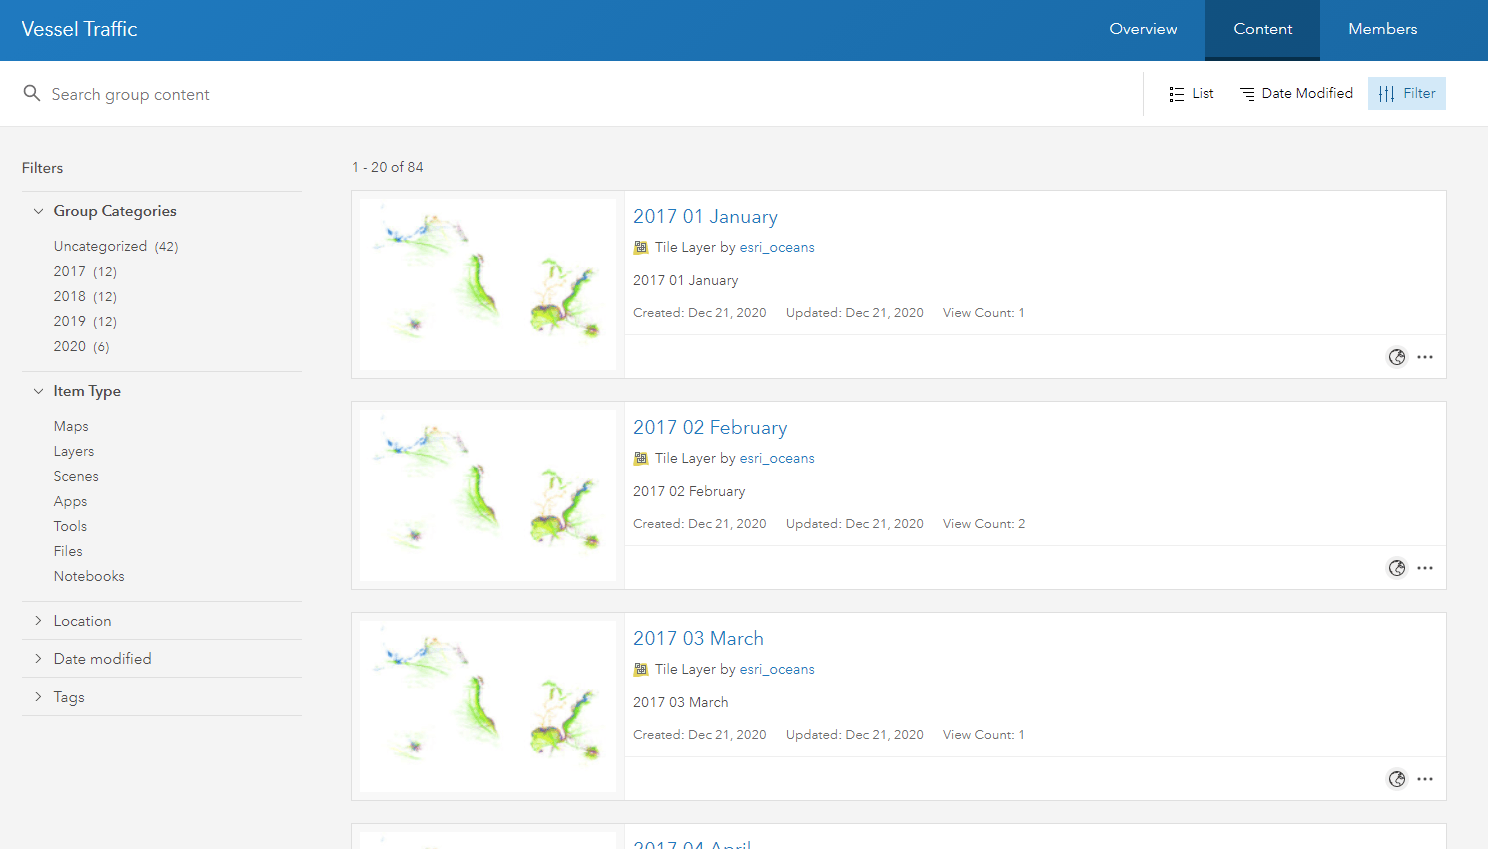
Ok ok, maybe you are just after the data and you want to sweep away this user experience and just dive right into accessing the content directly. No problem, you can visit this ArcGIS Online group to find the geodatabases and/or tile layers that suit you.
Stay tuned for two follow-up blog posts where we share some especially interesting patterns within this data and show you how it was made using the ArcGIS API for JavaScript. In the meantime, happy exploring!


Article Discussion: