
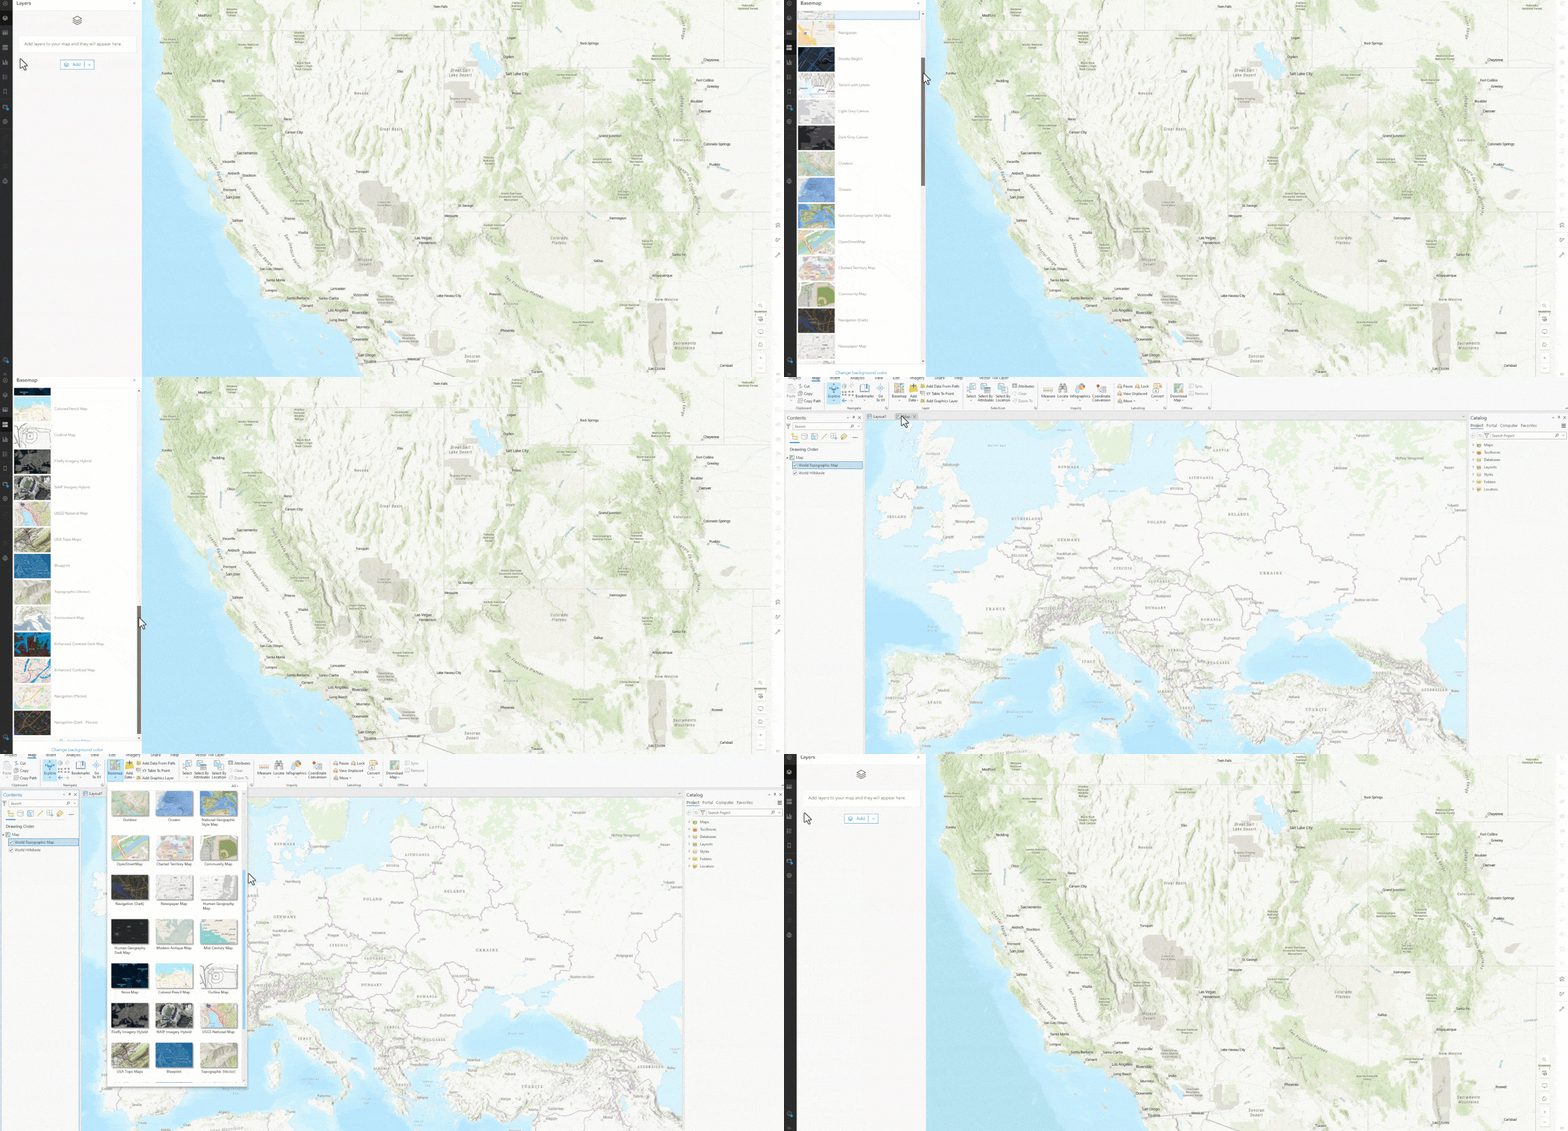
Esri is proud to offer the Environment Map, available across the ArcGIS platform, accessed by clicking on the Basemap dropdown list in both ArcGIS Online and ArcGIS Pro. Most traditional basemaps are human focused, displaying roads, municipal boundaries, and other human-centric/human created features. The Environment Map is Esri’s first ever Environment focused basemap, designed to let the environmental data speak for itself, and more easily expose environmental trends and patterns.
Use this basemap with your physical geography data about the landscape, natural resources, hydrologic features, soils, ecology and other data themes. The neutral backdrop with environmentally relevant features and labels makes it fast and easy to build a powerful and compelling webmap with your data. We are so happy to announce the release of this map as part of the Basemap Gallery and ArcGIS Living Atlas.
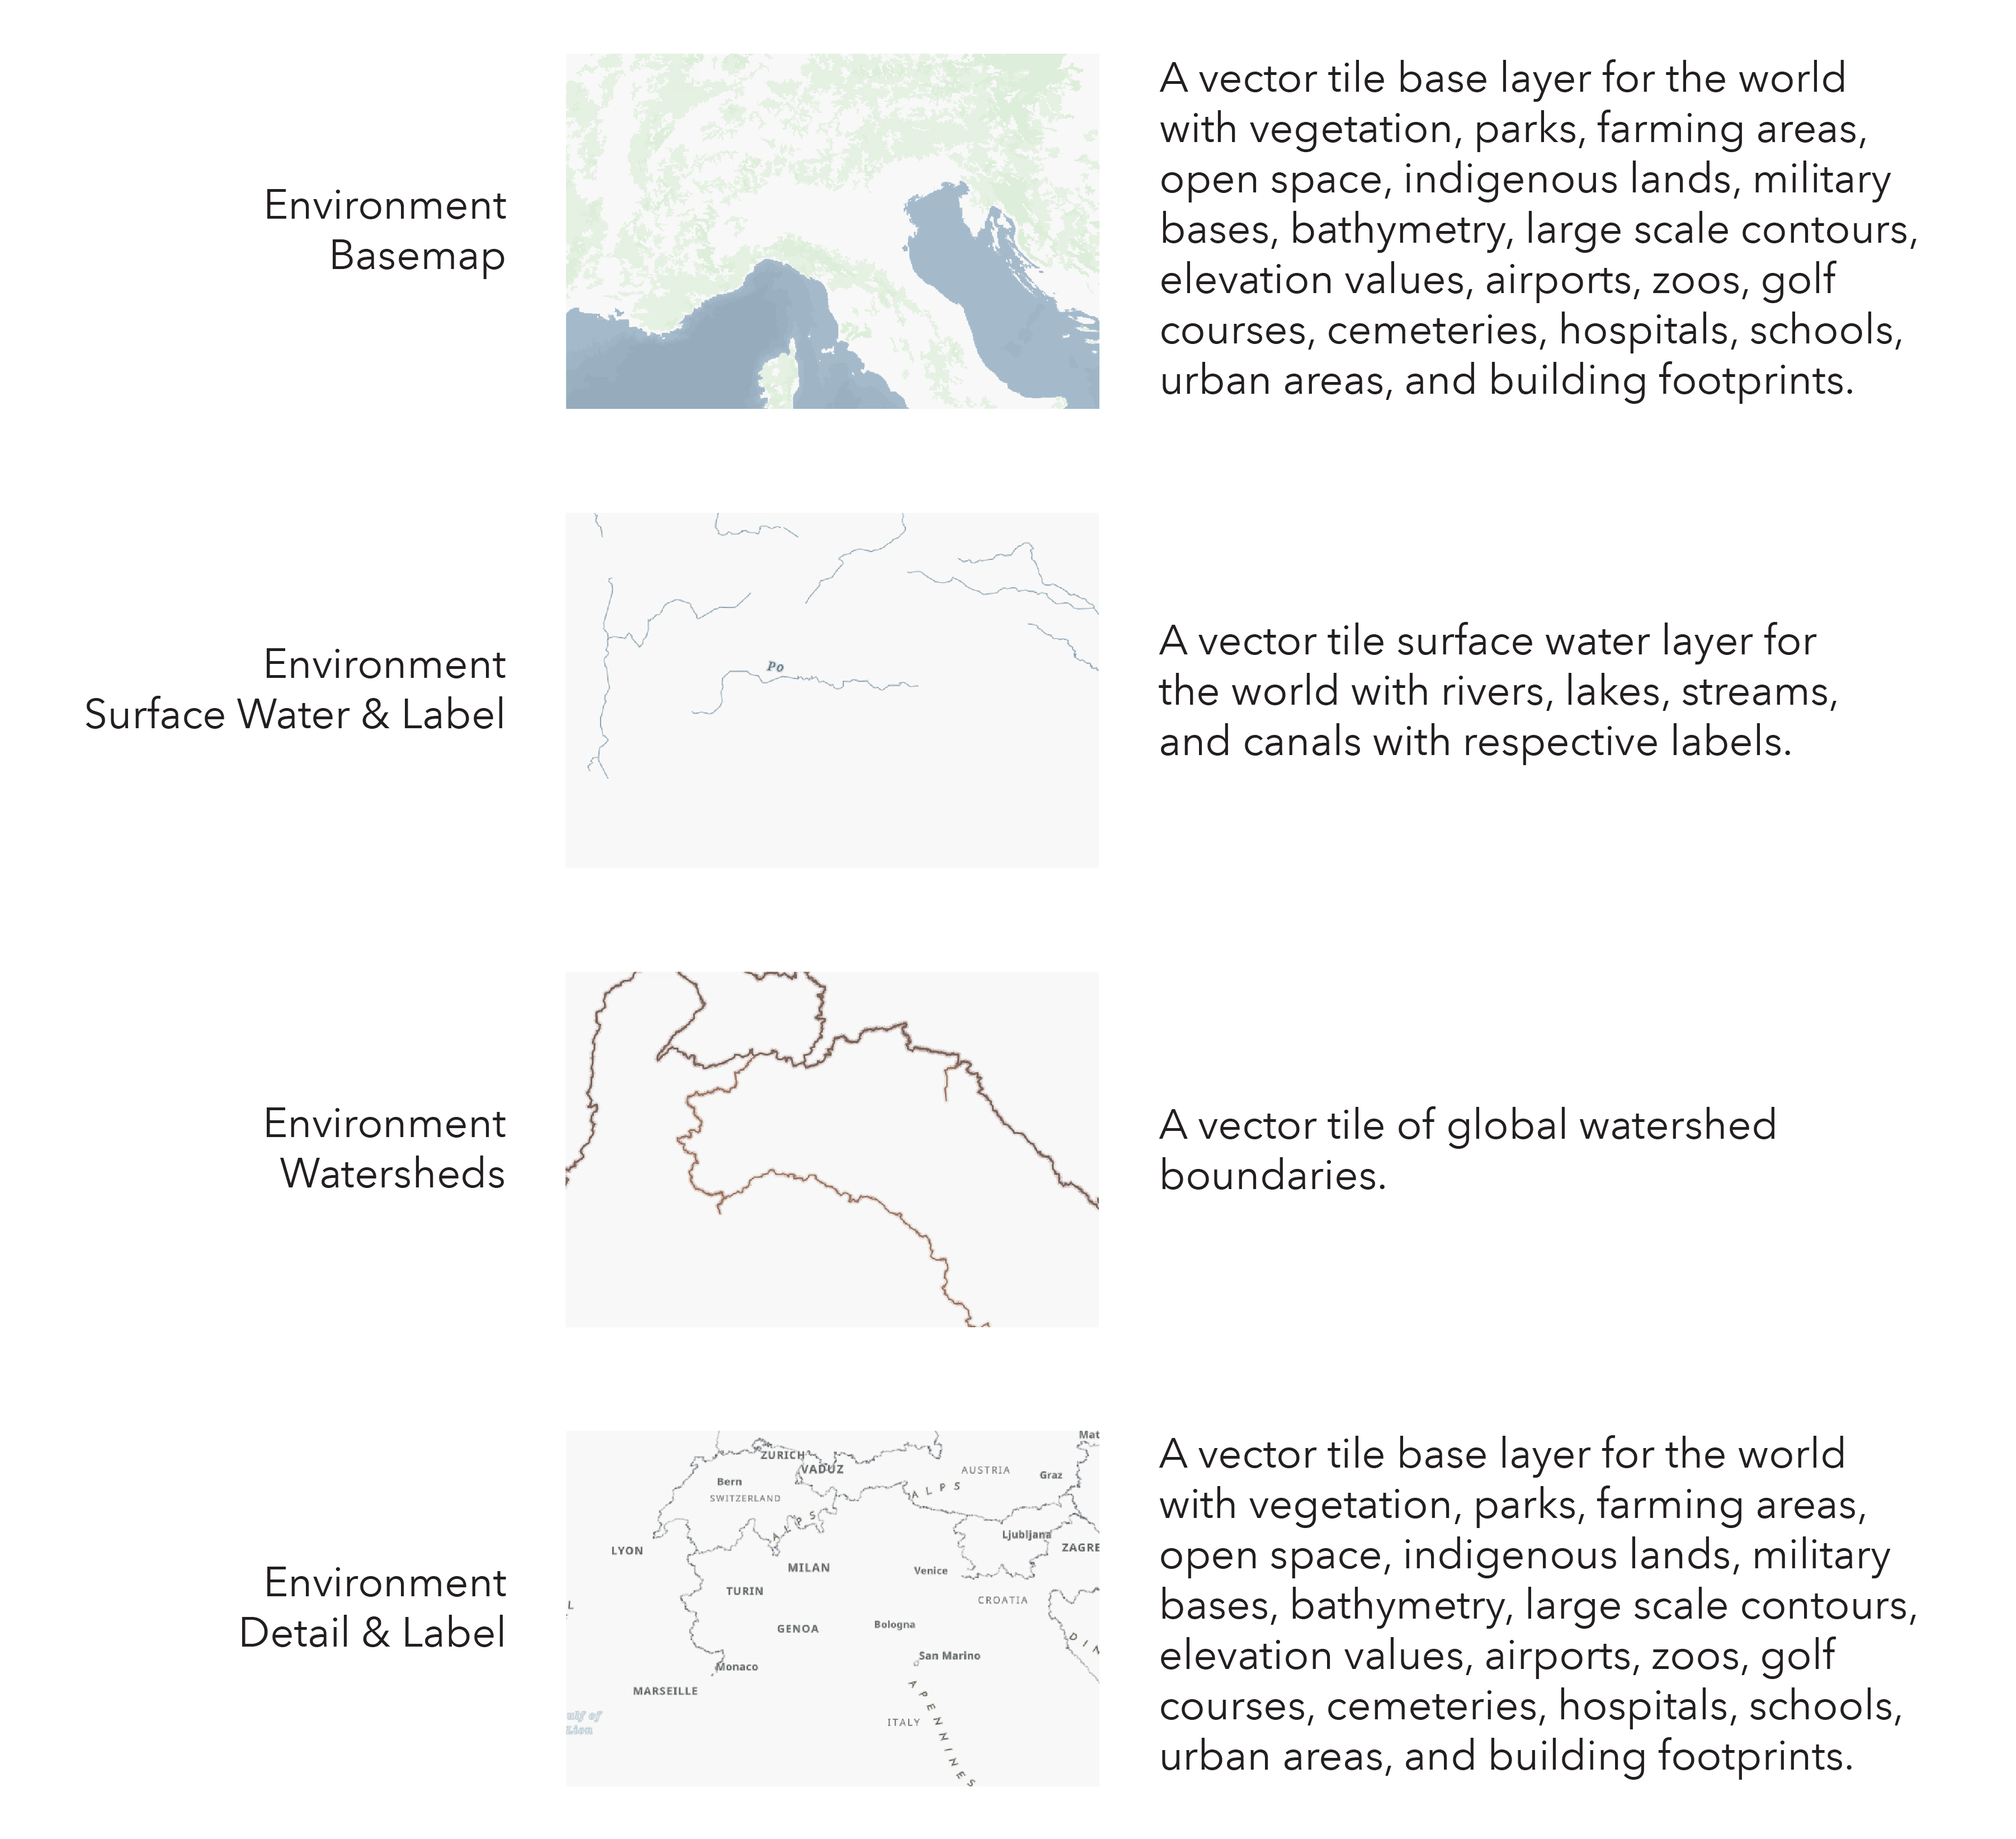
The Environment Map consists of a base layer and three additional reference layers:
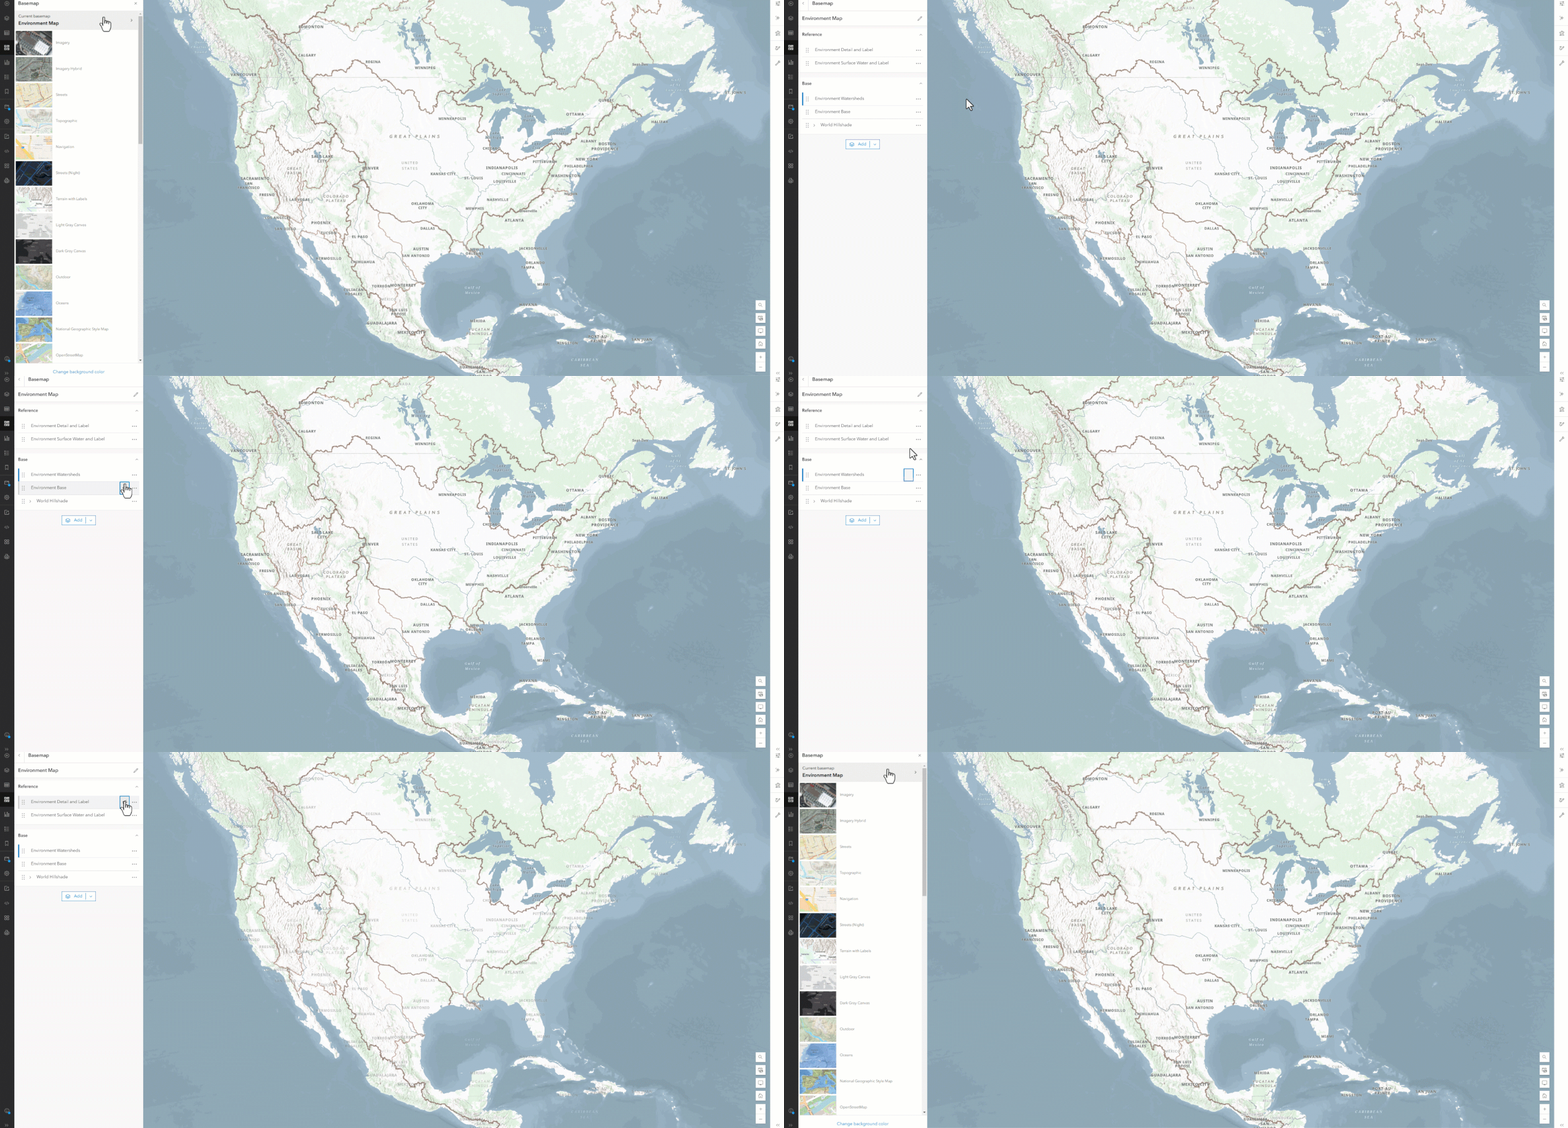
Access these layers in ArcGIS Online by expanding the Environment Map. The basemap was designed with four layers to provide the option to turn on or off specific features, tailoring the map around the type of environmental data you are displaying.
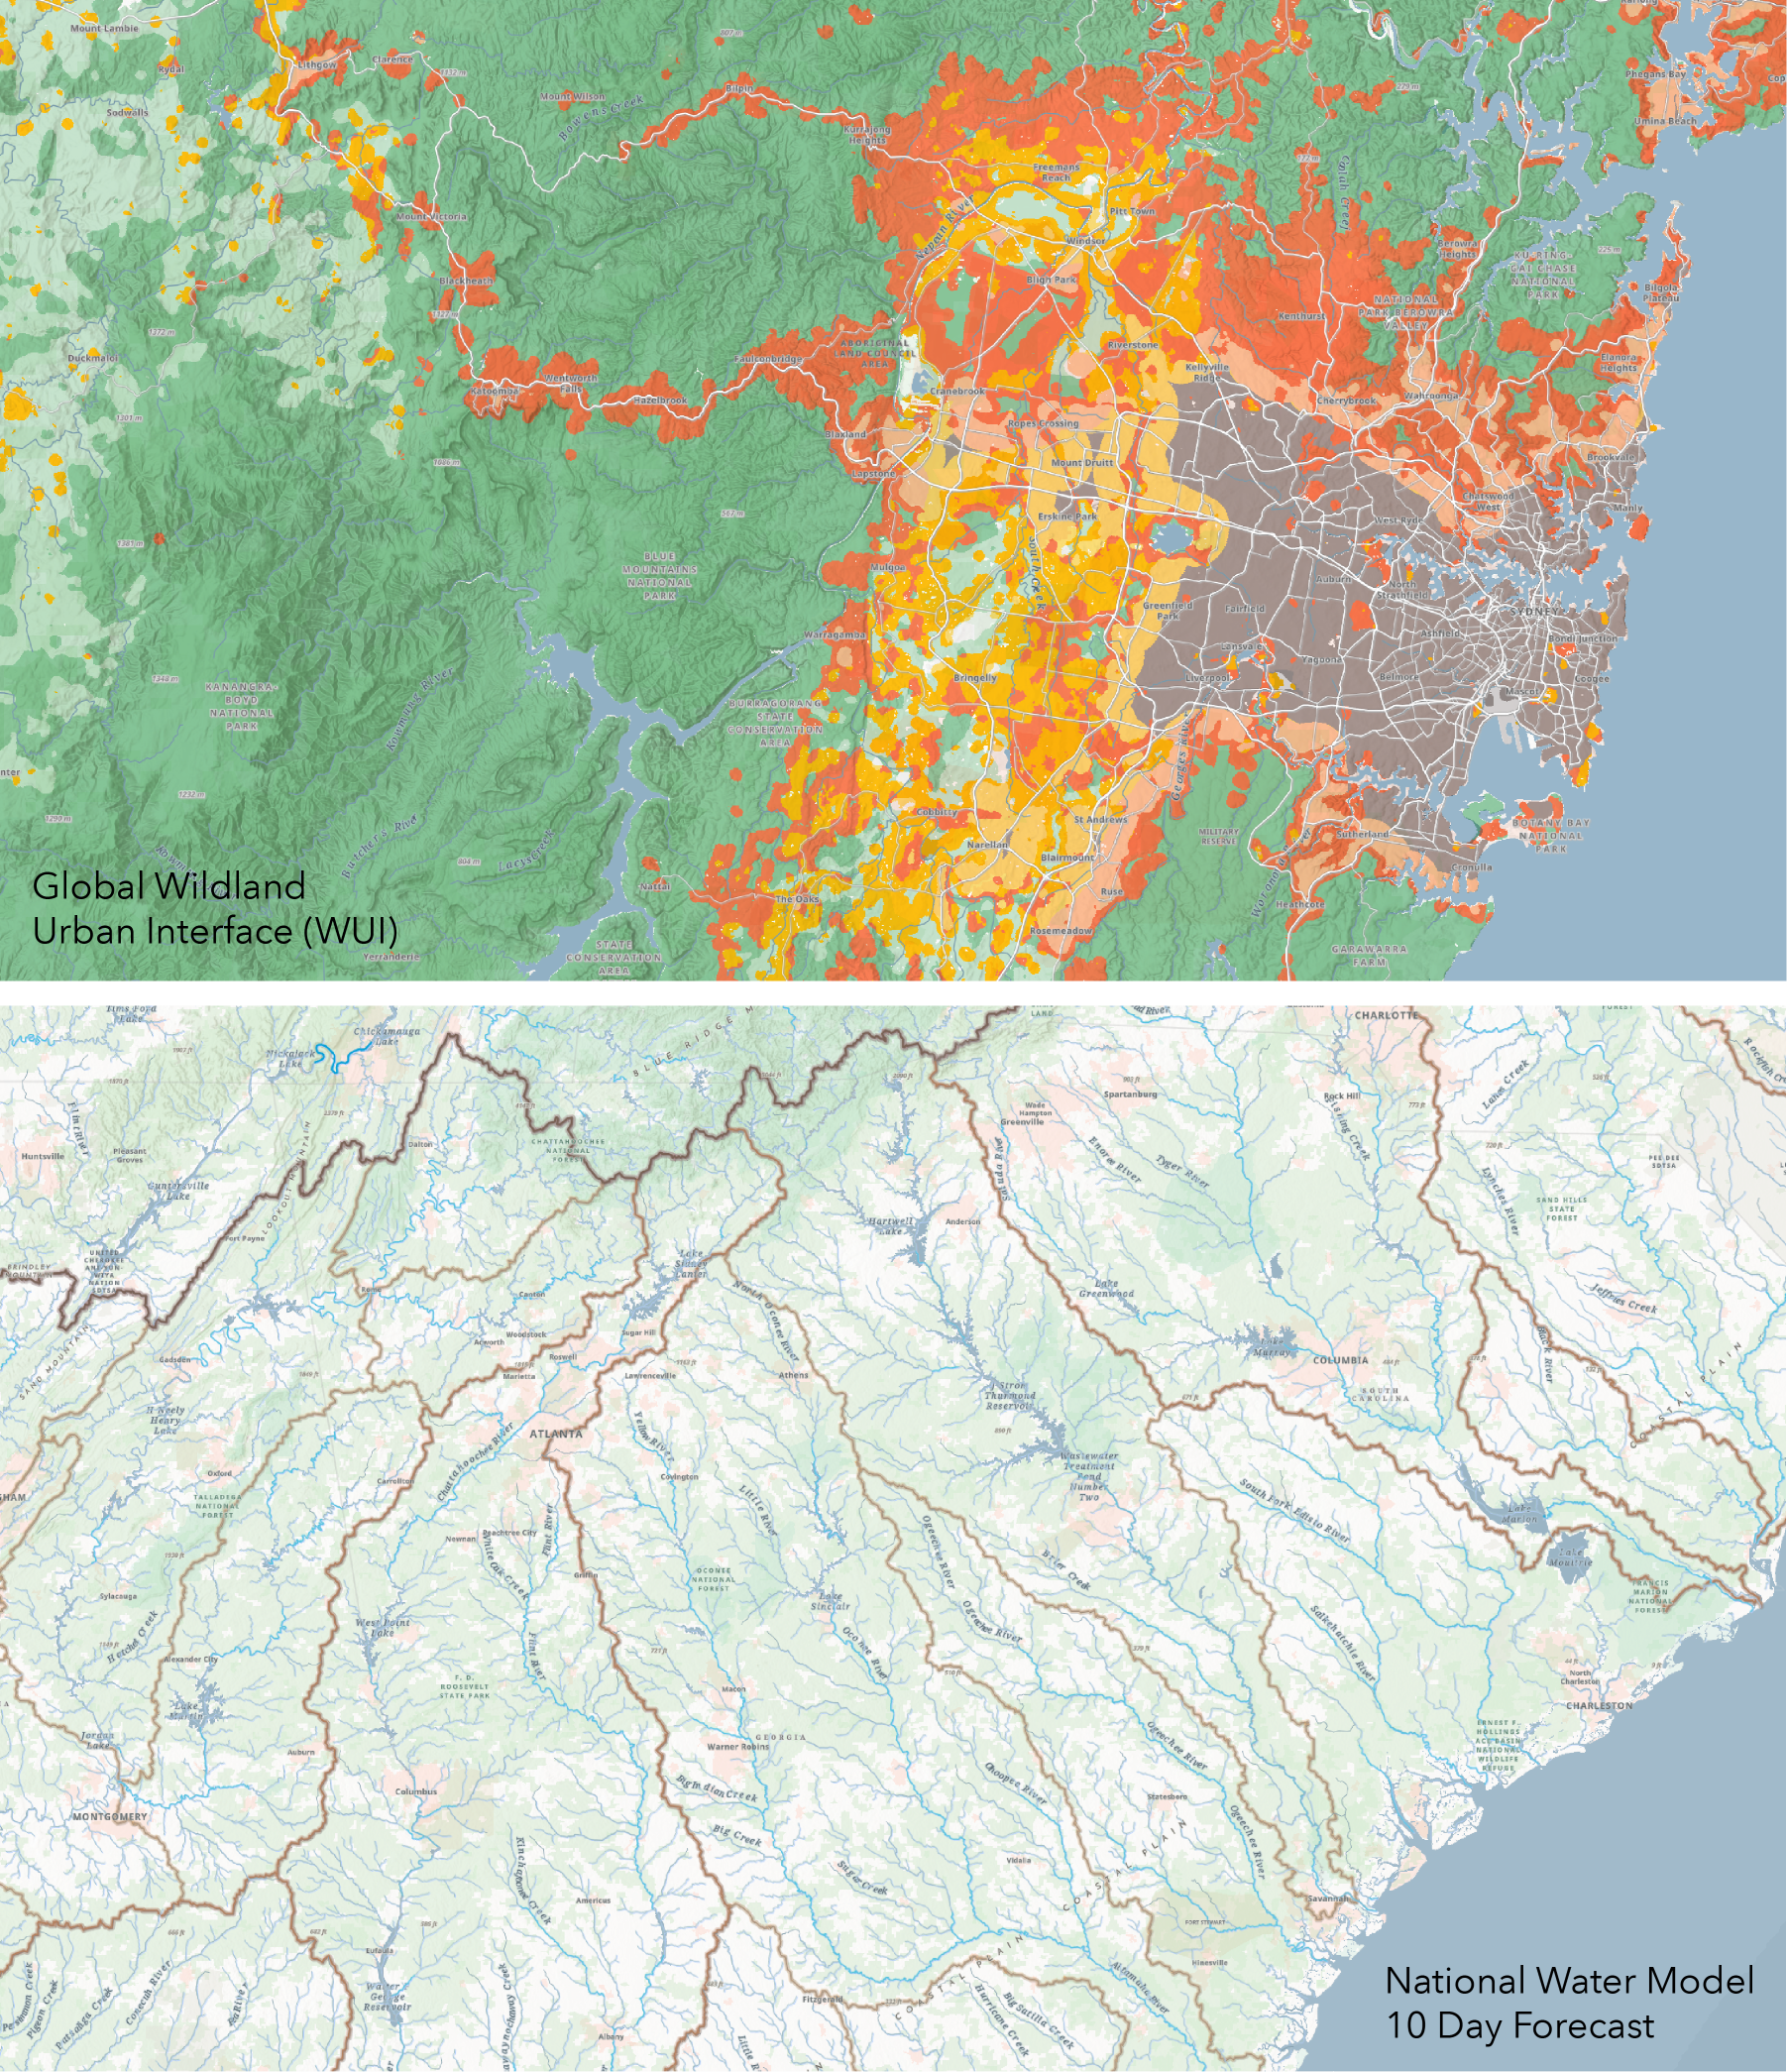
For example, you might want to turn off the Watersheds in your map about Global Wildland Urban Interface, but keep them on in your map about the United States National Water Model. Watershed Boundary information could help us understand our physical geography in some cases, but in other cases it may not be as relevant. Offering this map in multiple layers gives you the flexibility to make it work with your data.
Another way to utilize the flexibility of this basemap is to use only one component layer. For example, we had many requests for a surface water features only layer, that users could drop on top of their landscape themed data, or use it as a starting point for building your map. This is now possible with the Environment Surface Water and Label layer. You have the ability to single out the surface water features in the map, and add them to any other webmap.
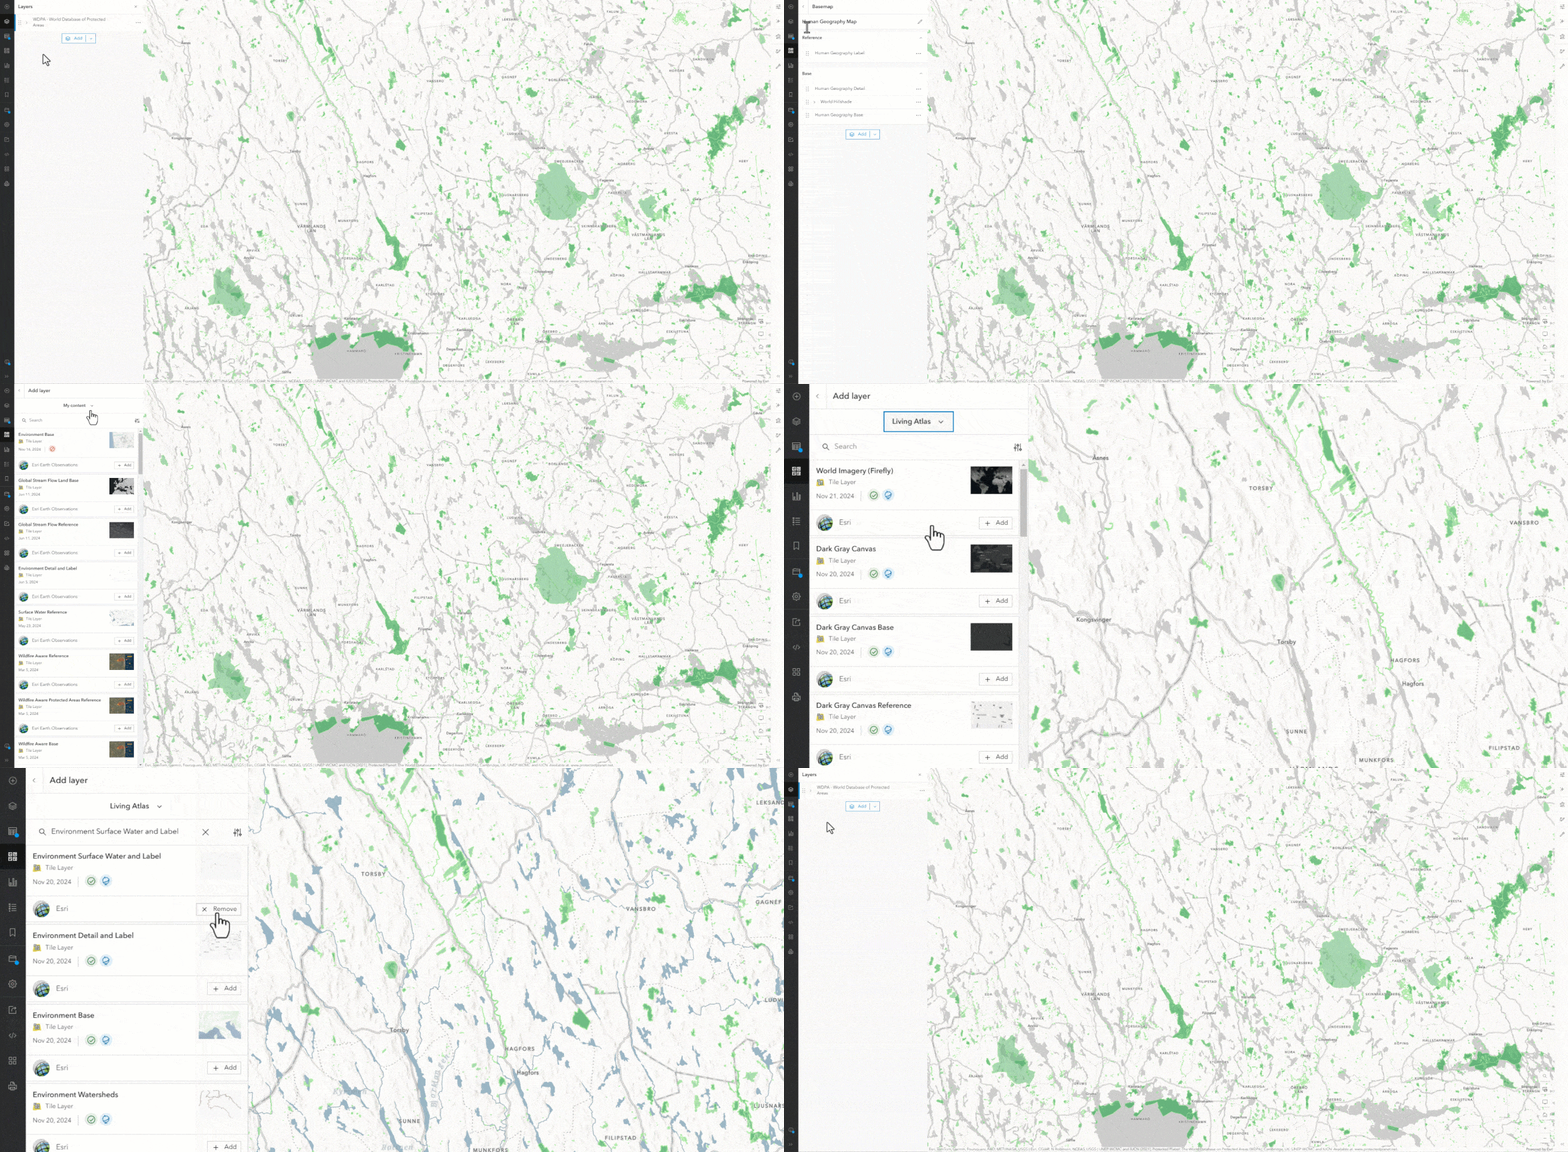
The Environment Map is also a complete Basemap, designed so the layers work together to best showcase your environmental content. This basemap de-emphasizes human landscape features, allowing the physical characteristics of the earth to take the spotlight, while also maintaining a neutral palette which helps illustrate the story within your data. A neutral palette allows you to see patterns and trends more clearly.
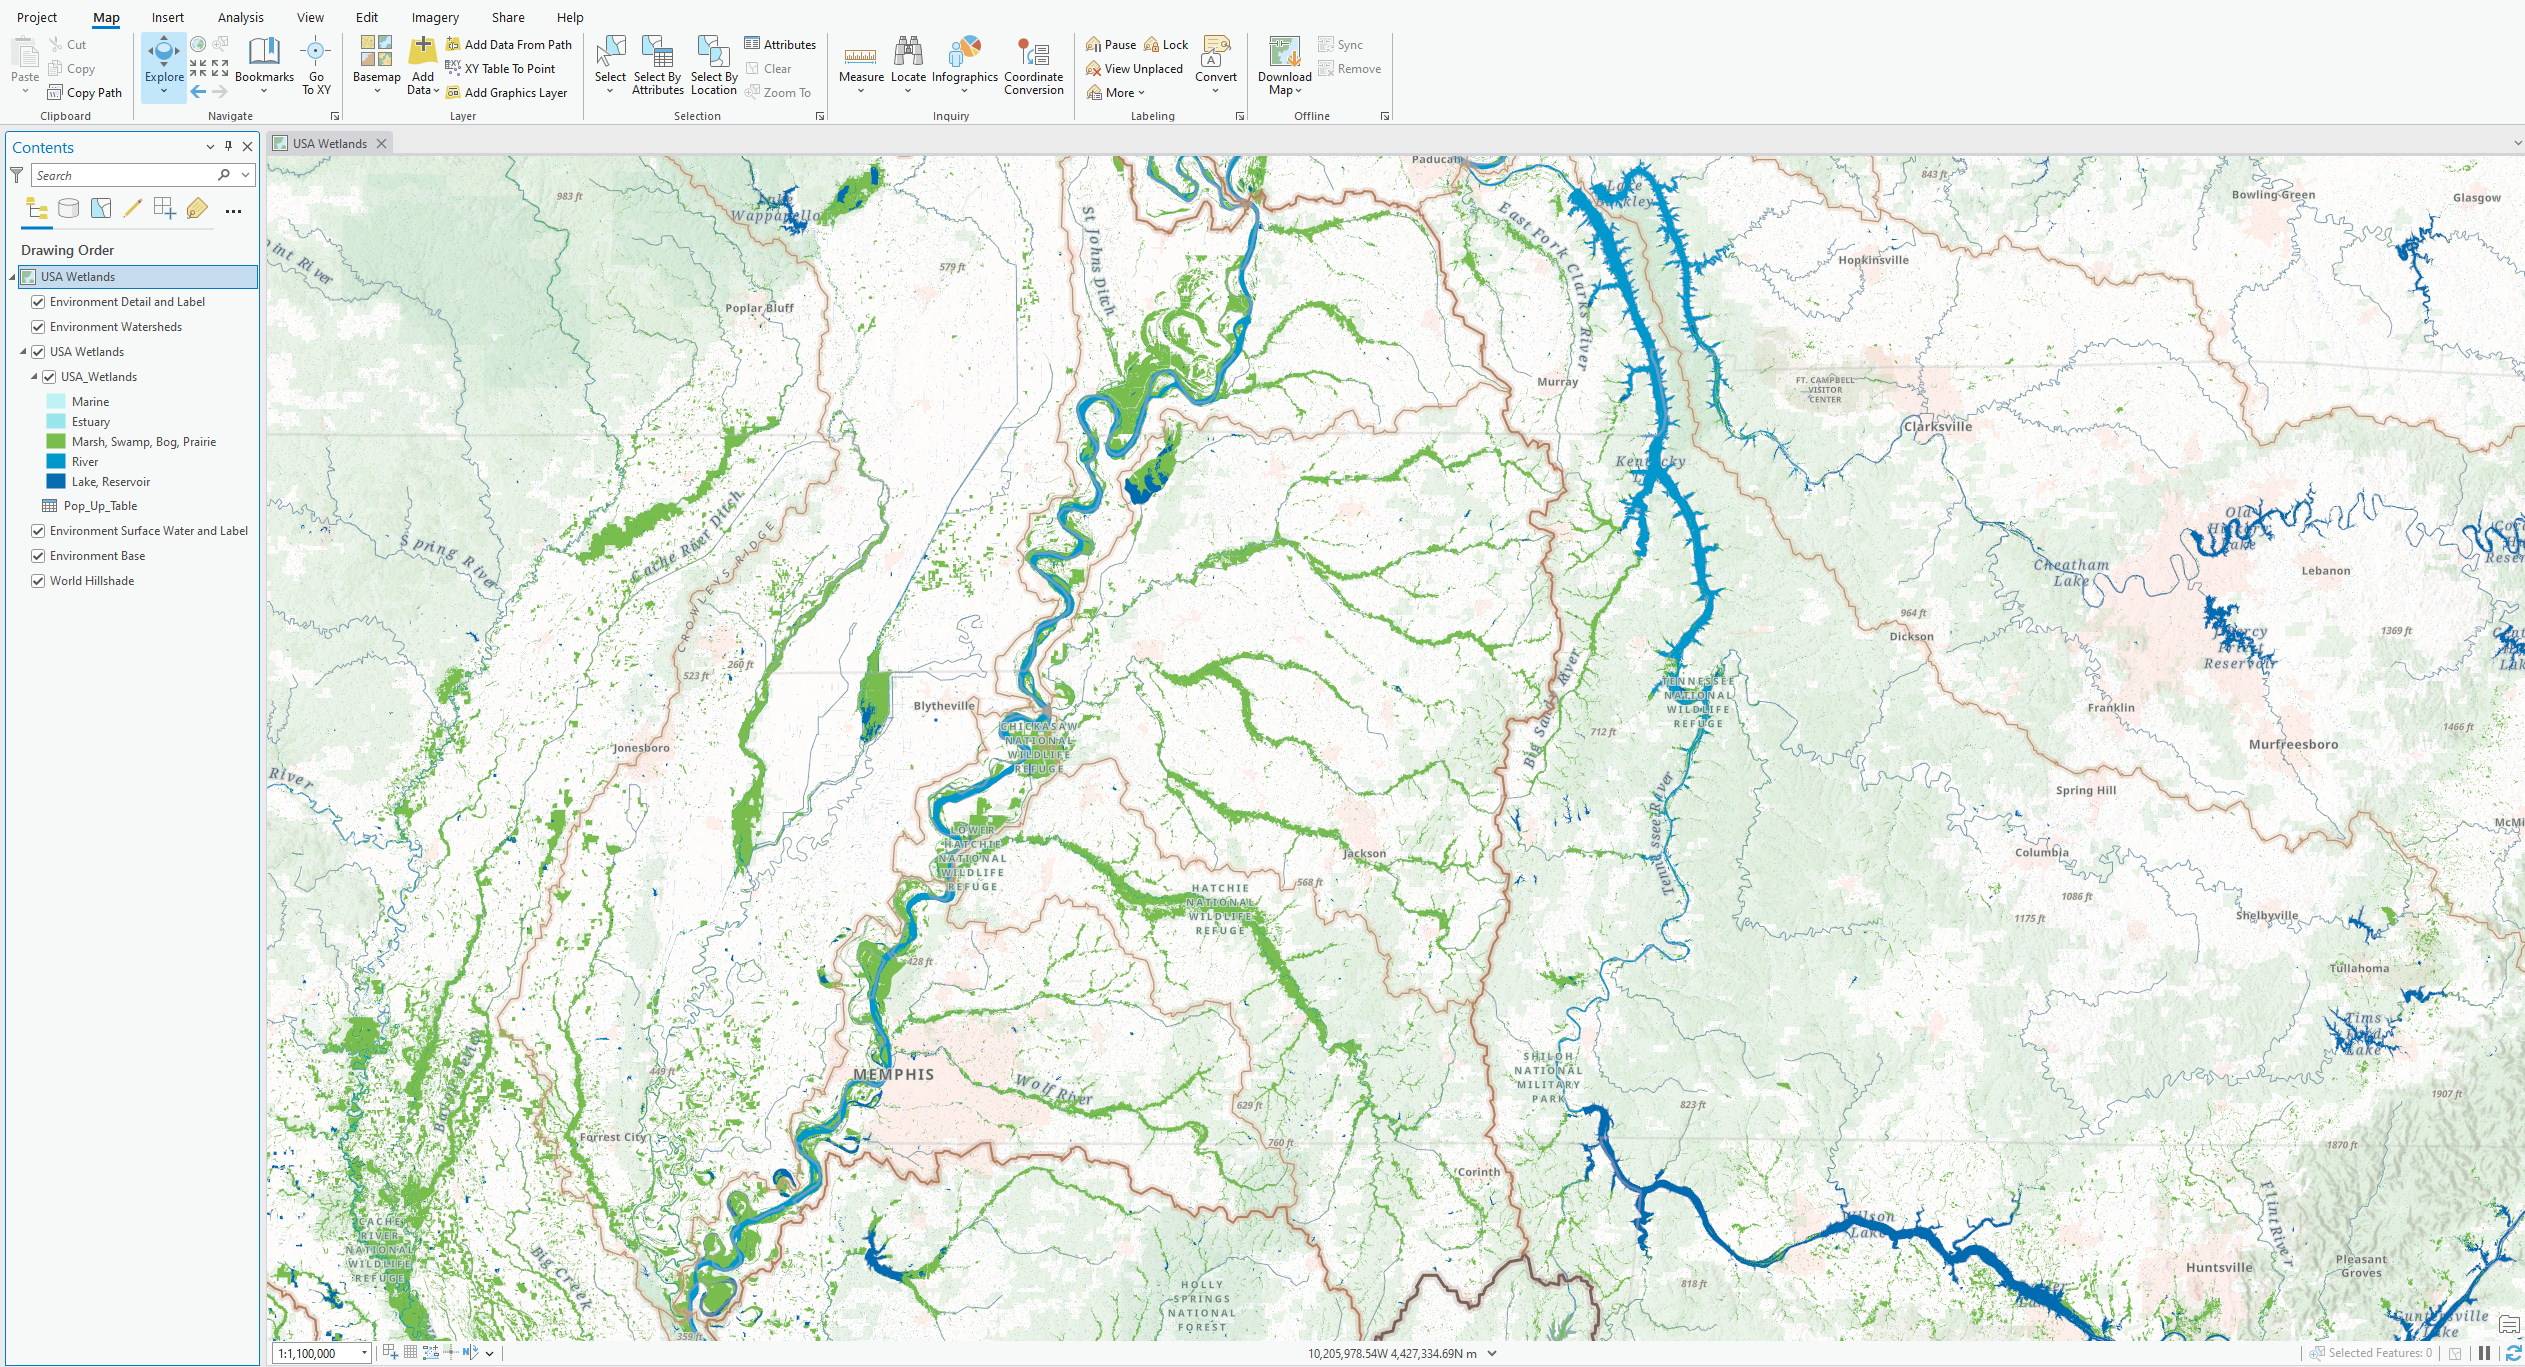
For example, as seen below in ArcGIS Pro, the watershed layer shows us what area on the landscape contributes to the USA Wetlands.
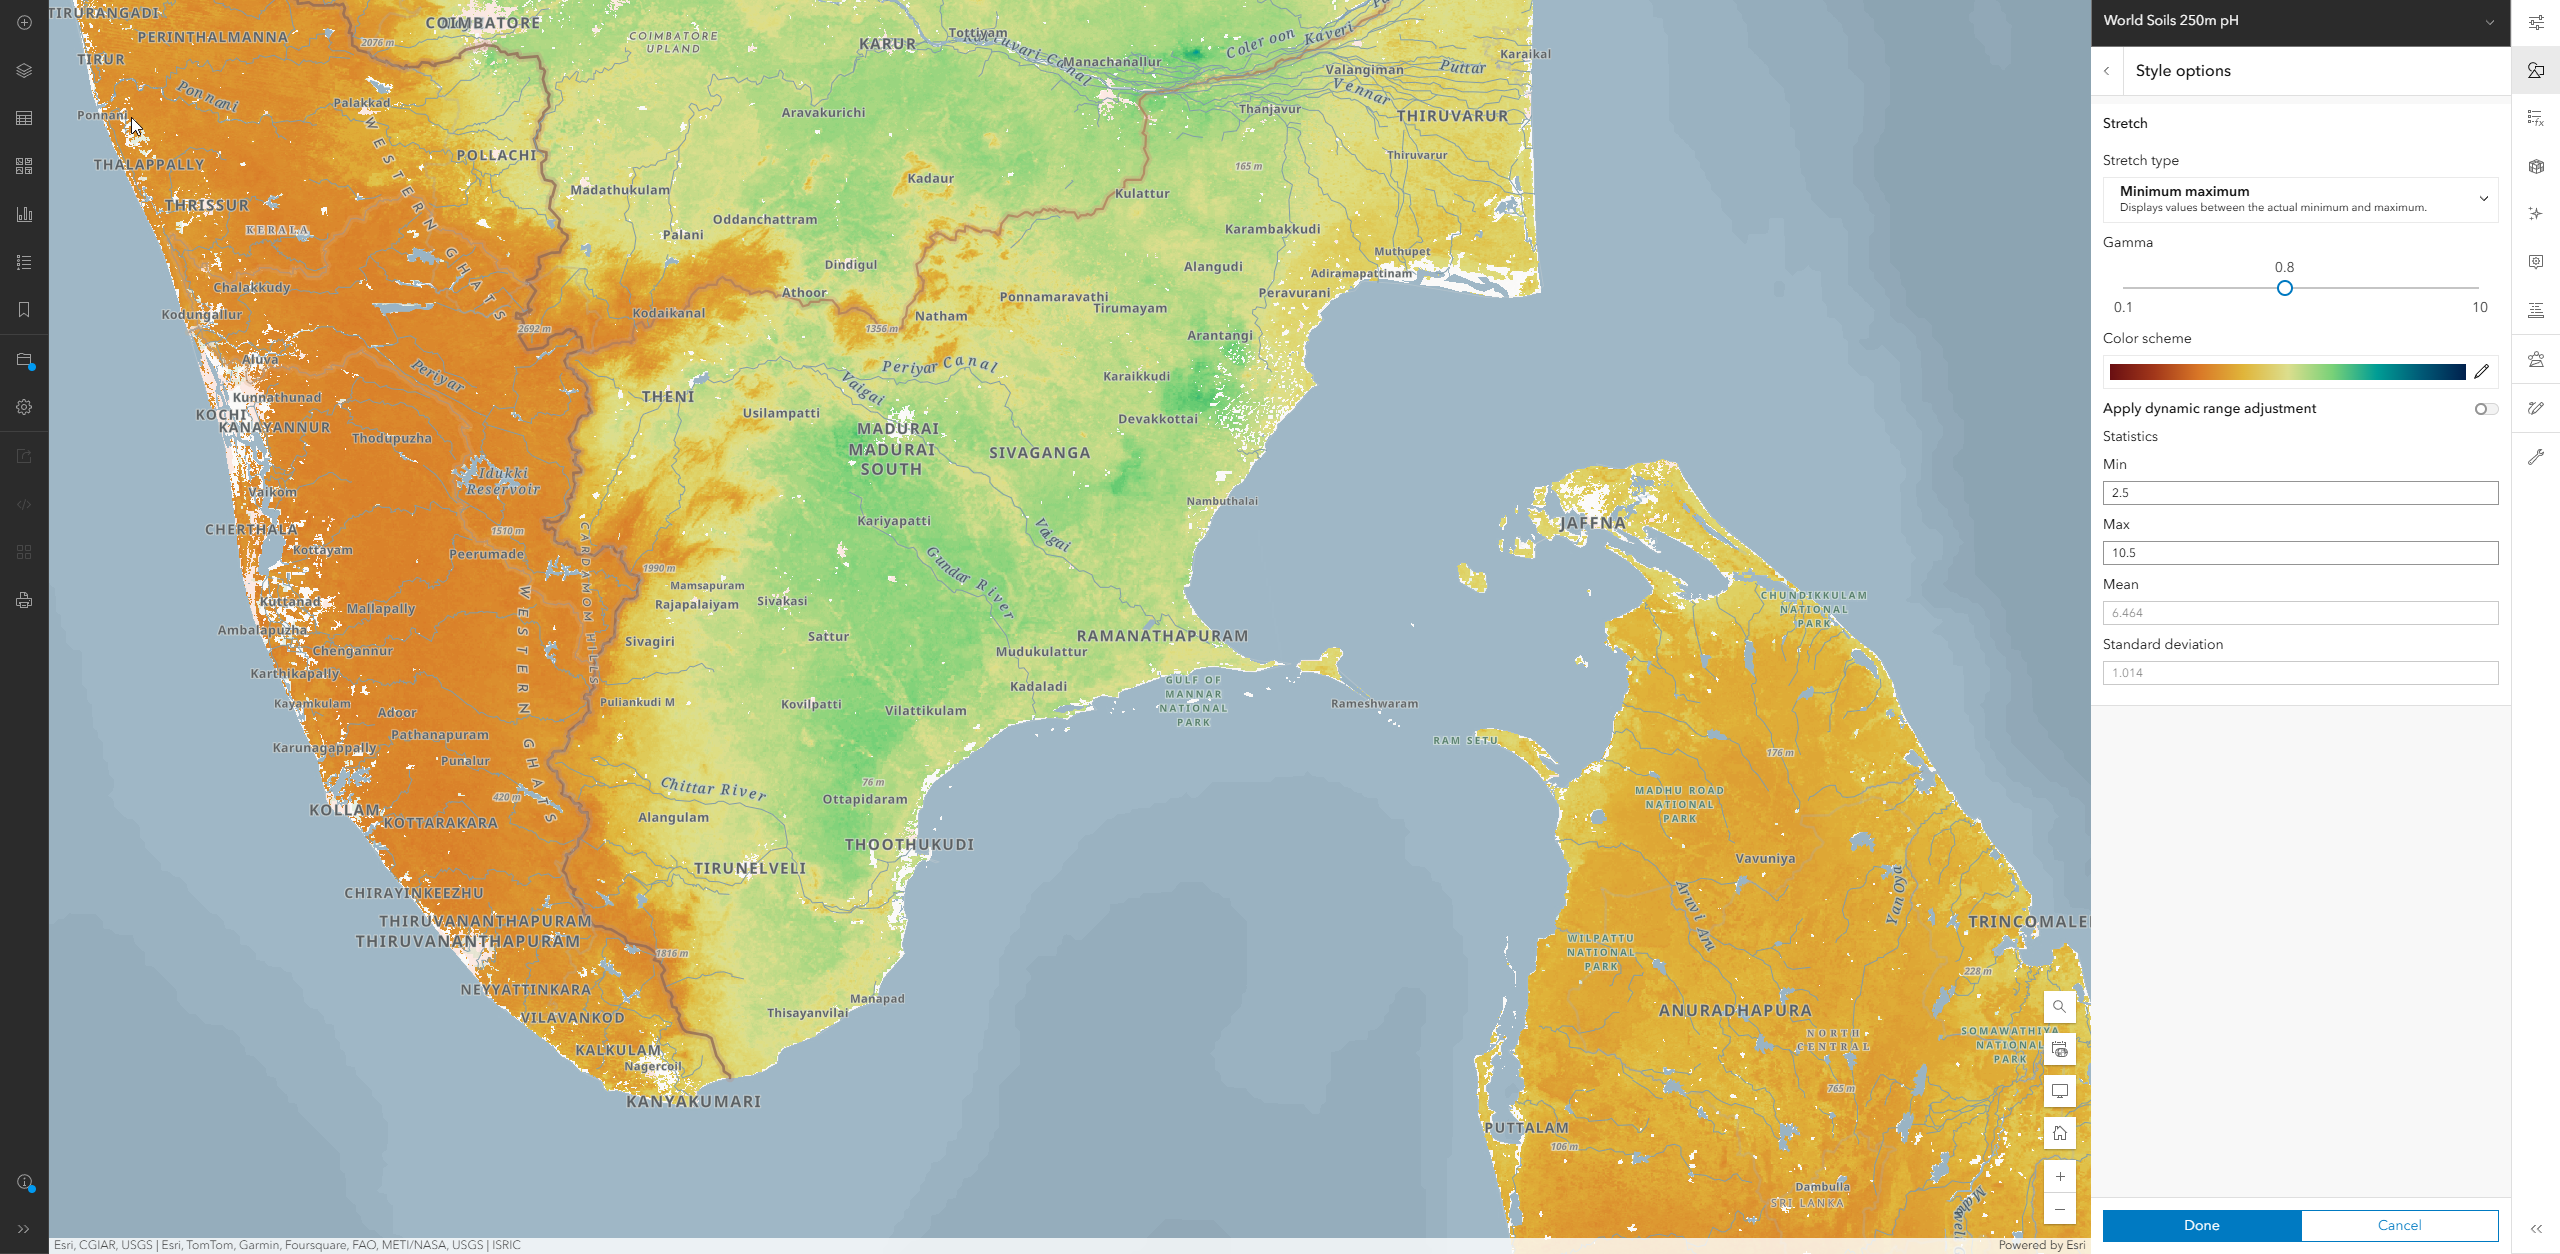
As seen in the ArcGIS Online map of World Soils pH, the watershed border coincides with a visible difference in the soil pH, whereas the lower pH (in orange) in the west roughly follows the watershed boundary line.
Read about this and other design choices in our previous blog Announcing the New Esri Environment Basemap (Beta). It is a fast read and provides a lot more information about why the Environment Map is so special.
We hope the Environment Map will serve you well as you create the important maps about our earth and natural environment.
We would love to hear any feedback you may have. Please take this very short survey to help us understand how the map is being used and how we could improve it in future releases.


Article Discussion: