
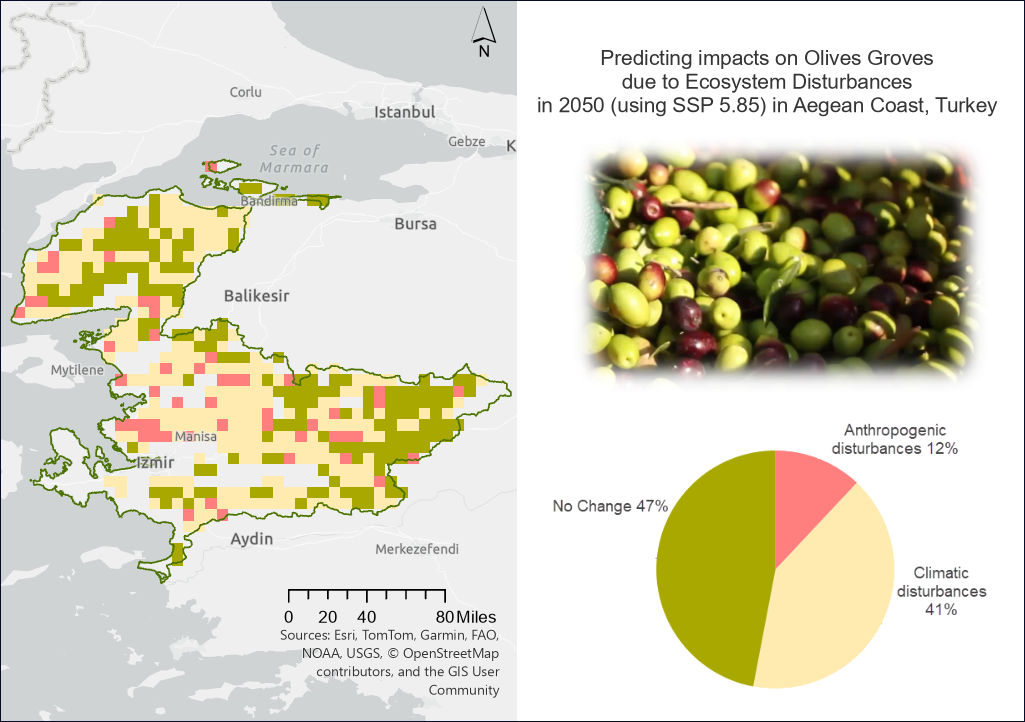
If atmospheric carbon dioxide levels are projected to nearly double by 2050, resulting in an average temperature increase of 4.4°C by the end of the 21st century, our study projected that over 53* percent (* This number is a projection based on our analysis, not a prediction) of the olive-growing regions along Türkiye’s Aegean Coast —which accounts for 80% of the country’s total olive production, might become unsuitable for cultivating olive trees by 2050, as detailed below. This is a significant concern, as Türkiye ranks among the top three countries in the world for olive and olive oil production between 2023-2024, according to the worldpopulationreview.com.
With the help of GIS technology, and the ArcGIS Living Atlas of the World layers we can pinpoint these vulnerable regions and assess the potential impacts of climate change on olive trees. GIS empowers us to take proactive measures to understand olive cultivation in those vulnerable regions and ensure the sustainability of this vital industry.
Legacy of olive trees in the world
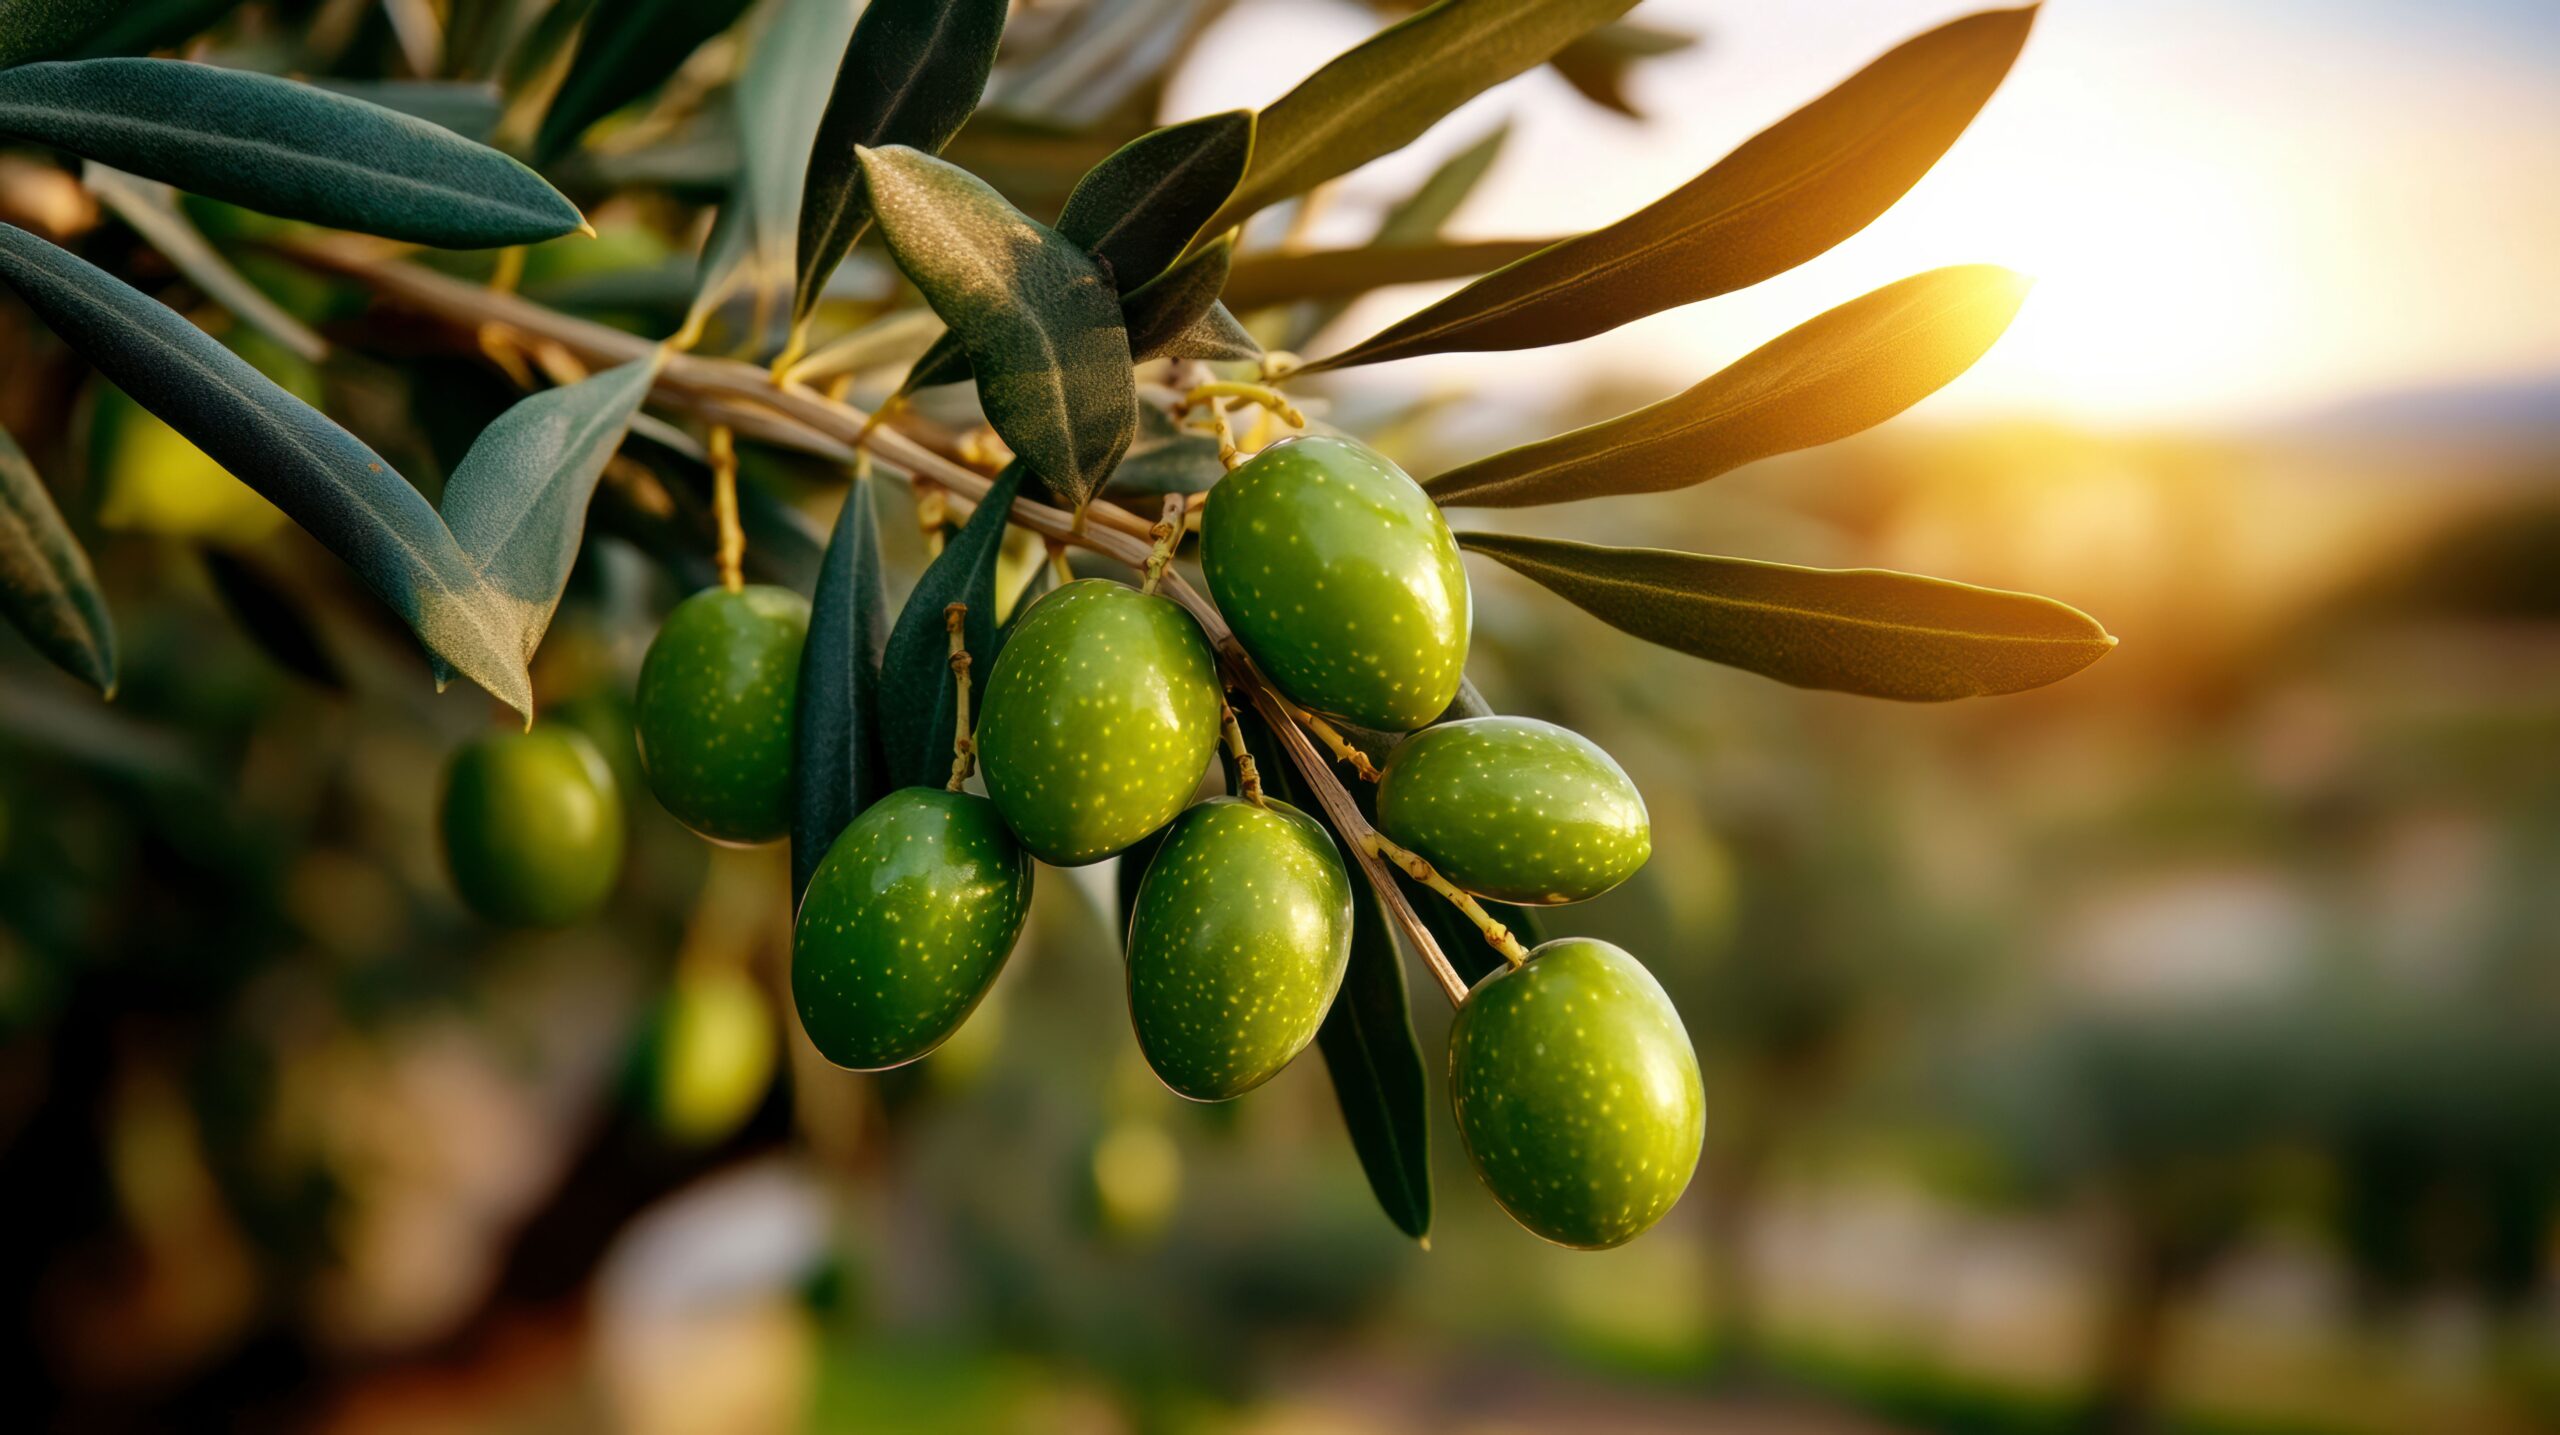
For thousands of years, olive oil production has been deeply rooted in agricultural practices, spanning diverse regions and mostly in Mediterranean climates around the world. The cultivation of olive trees and the creation of olive oil have become more than just agricultural activities; they are woven into the cultural identities and economies of the places where olives thrive. Nowhere is this more evident than in the Mediterranean, where the olive tree has stood as a symbol of peace for centuries.

Its fruit and oil are cornerstones of the Mediterranean diet, while its branches symbolize peace in Judaism, Christianity, and Islam. The olive tree has shaped both the landscape and the soul of the region.

One of the most telling examples of the olive’s cultural importance is the story of how Athena became the patron goddess of Athens, as described in the Olive Oil Times.
In ancient Greek mythology, Athena and Poseidon competed for dominance over Attica by offering gifts to humanity. Poseidon created the horse, symbolizing strength and victory in battle. Athena brought forth the first olive tree, symbolizing peace, healing, and prosperity. Zeus chose Athena’s gift, and the city was named Athens in her honor. “You gave men the olive tree, and with it you gave light, nourishment and an eternal symbol of peace,” Zeus said as he blessed the silver leaves of the olive tree.
From that time, the olive tree became a universal symbol of peace, healing, and prosperity, taking on a sacred character. This was the beginning of the olive tree’s legacy on the Aegean Coast centuries ago.
New threats to old vintages
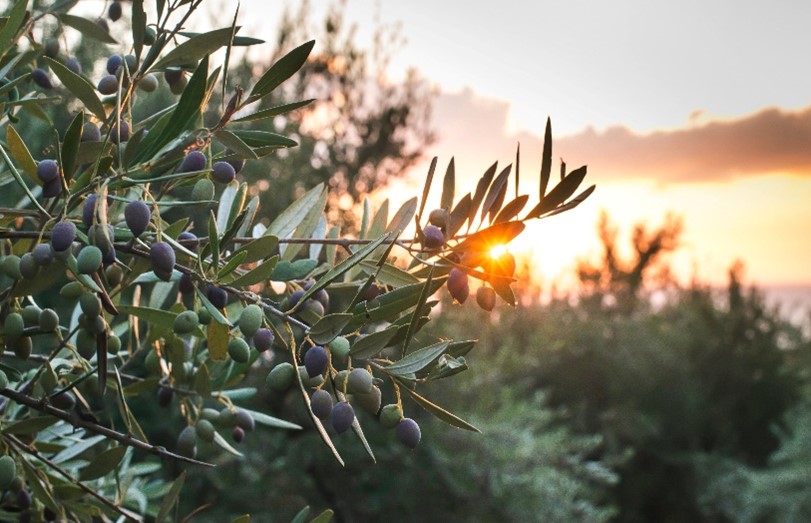
Today, scientists warn that climate change is affecting every aspect of our lives, even threatening the crops that have sustained us for centuries. I knew climate change was real, but I considered it to be an environmental problem of the future until I visited my grandparents’ olive farm in Izmir on the Aegean Coast of Turkiye this October. Climate change was no longer a distant issue.
Thousands of years after one of the first olive tree appeared on the Aegean Coast of Greece, my grandparents’ family moved from the Greek Aegean Coast to the Turkish Aegean Coast in1923 and established an olive farm in Izmir. Since then, we’ve produced our own olive oil and olives from that farm—until 2023.
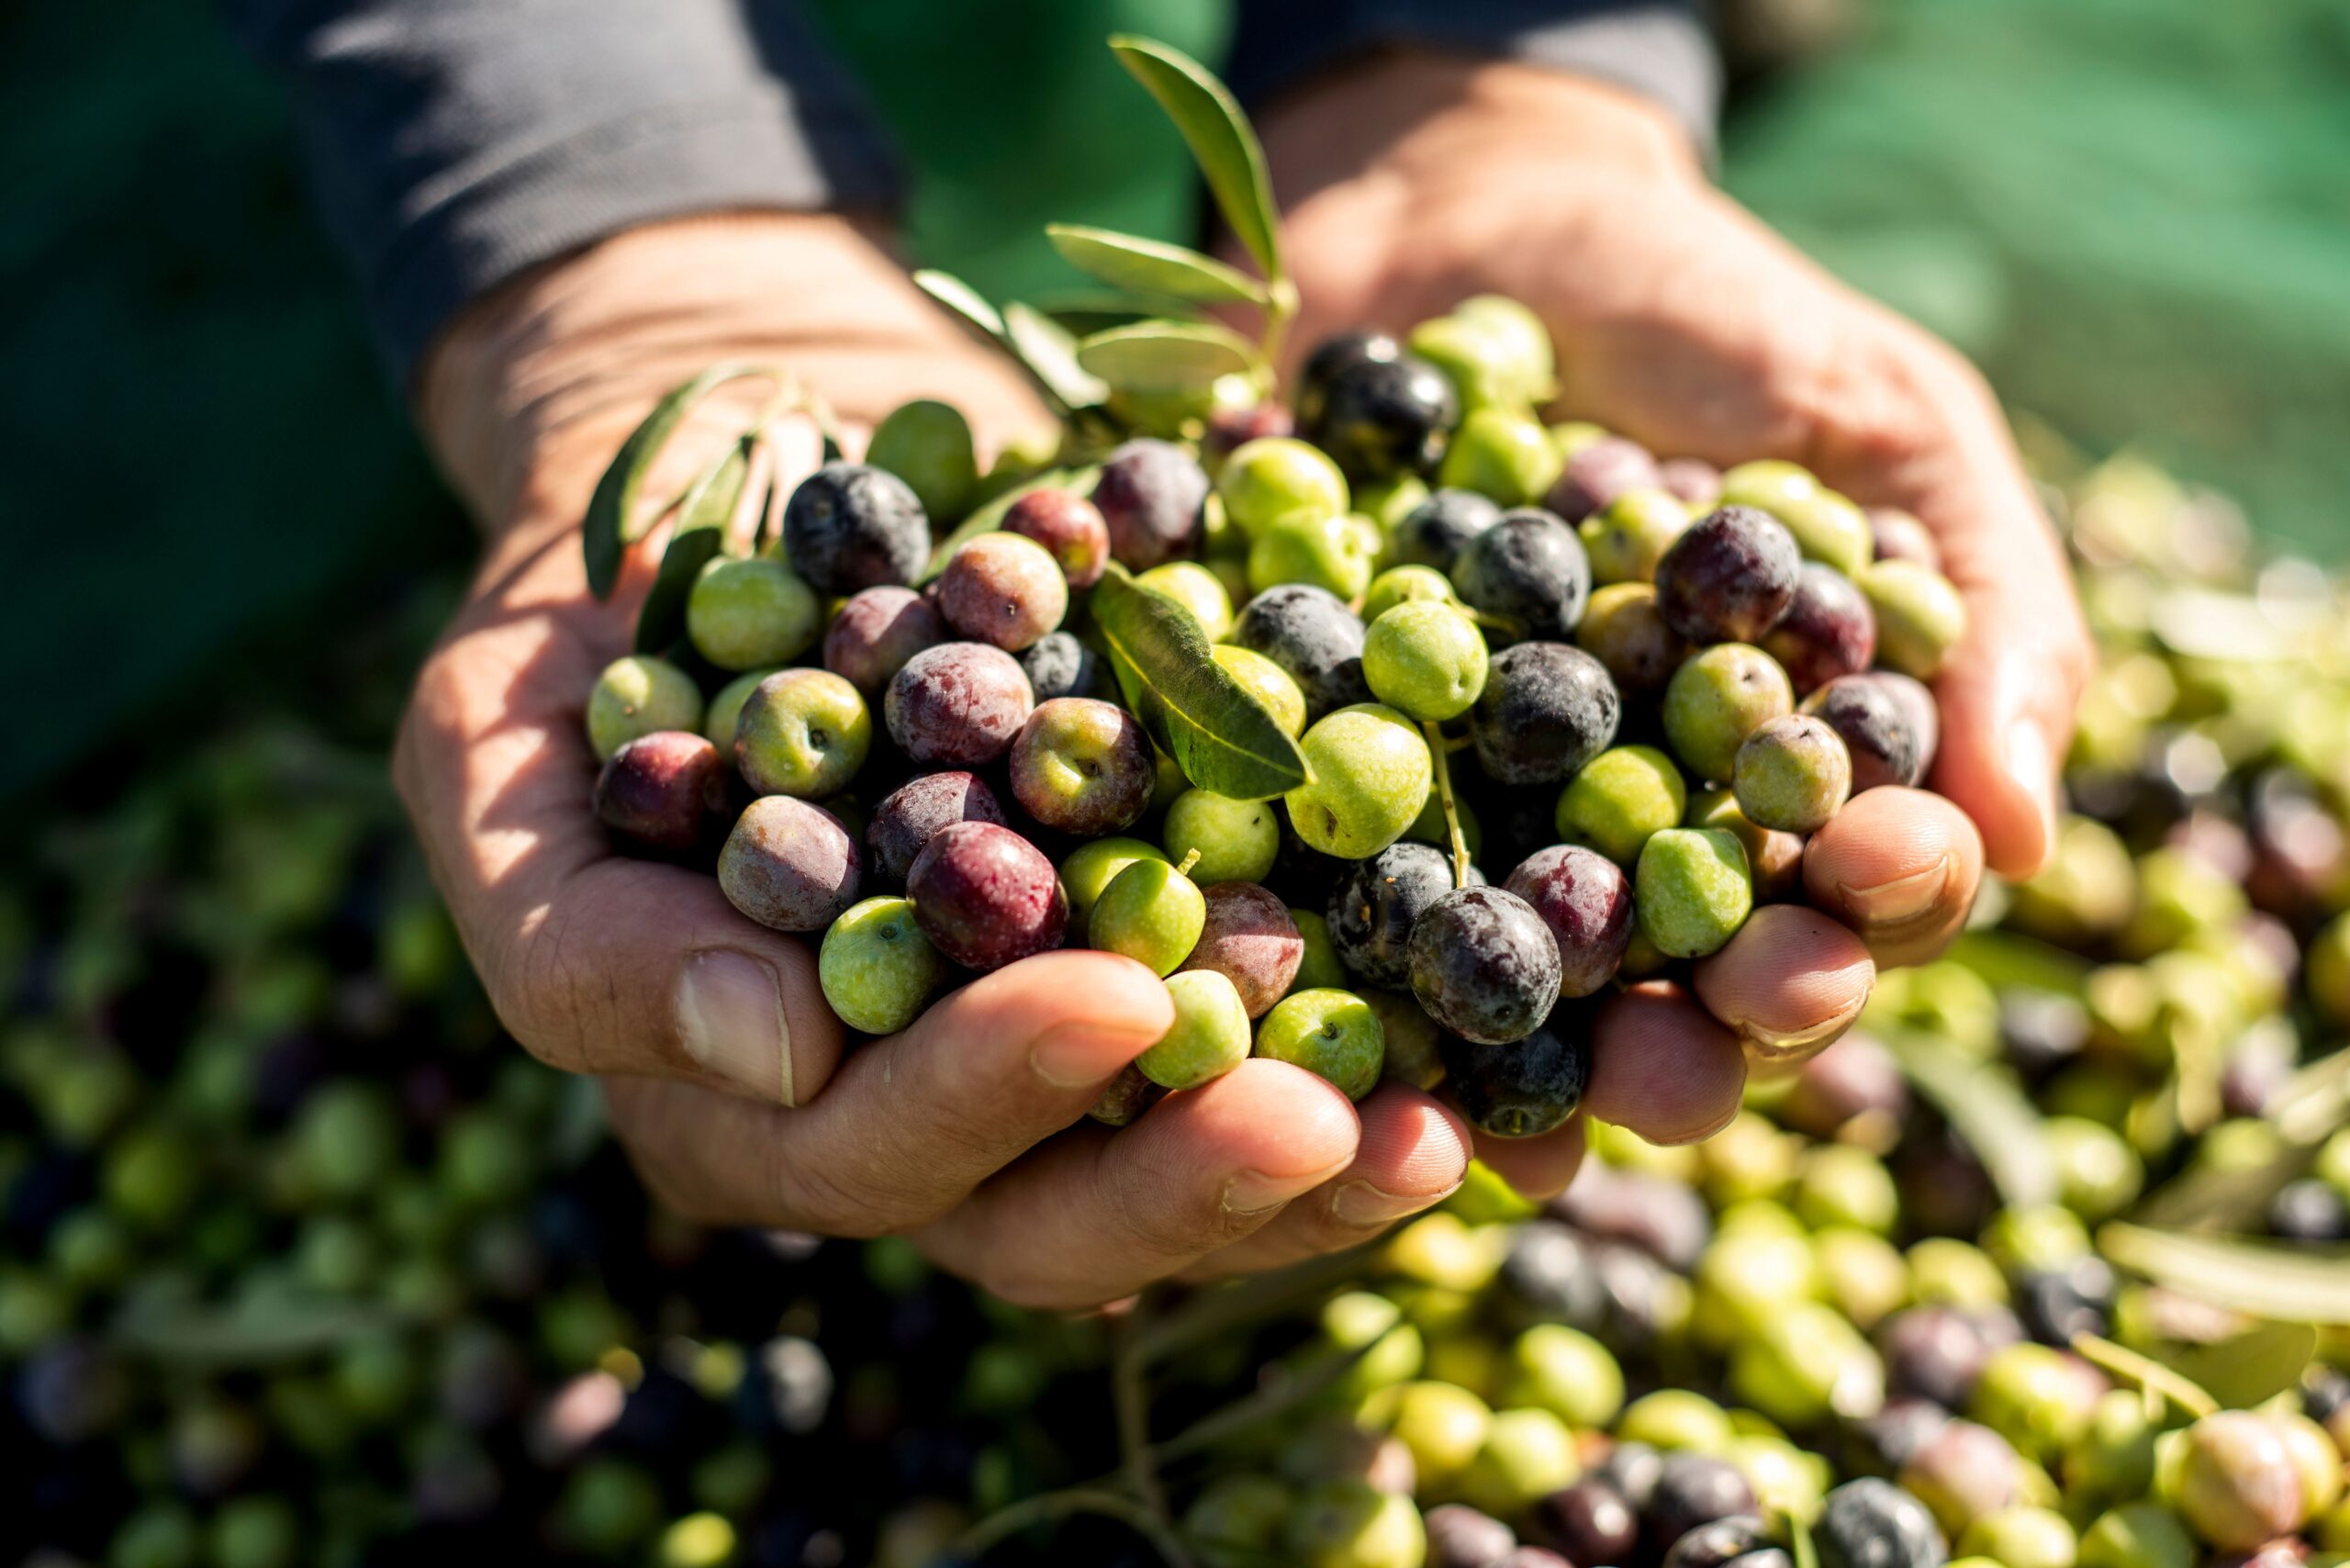
During my holiday in October, which was the harvest season, I visited my grandparents and joined them on the farm to pick olives. As we worked, I asked my grandfather how the farm was doing compared to previous years.
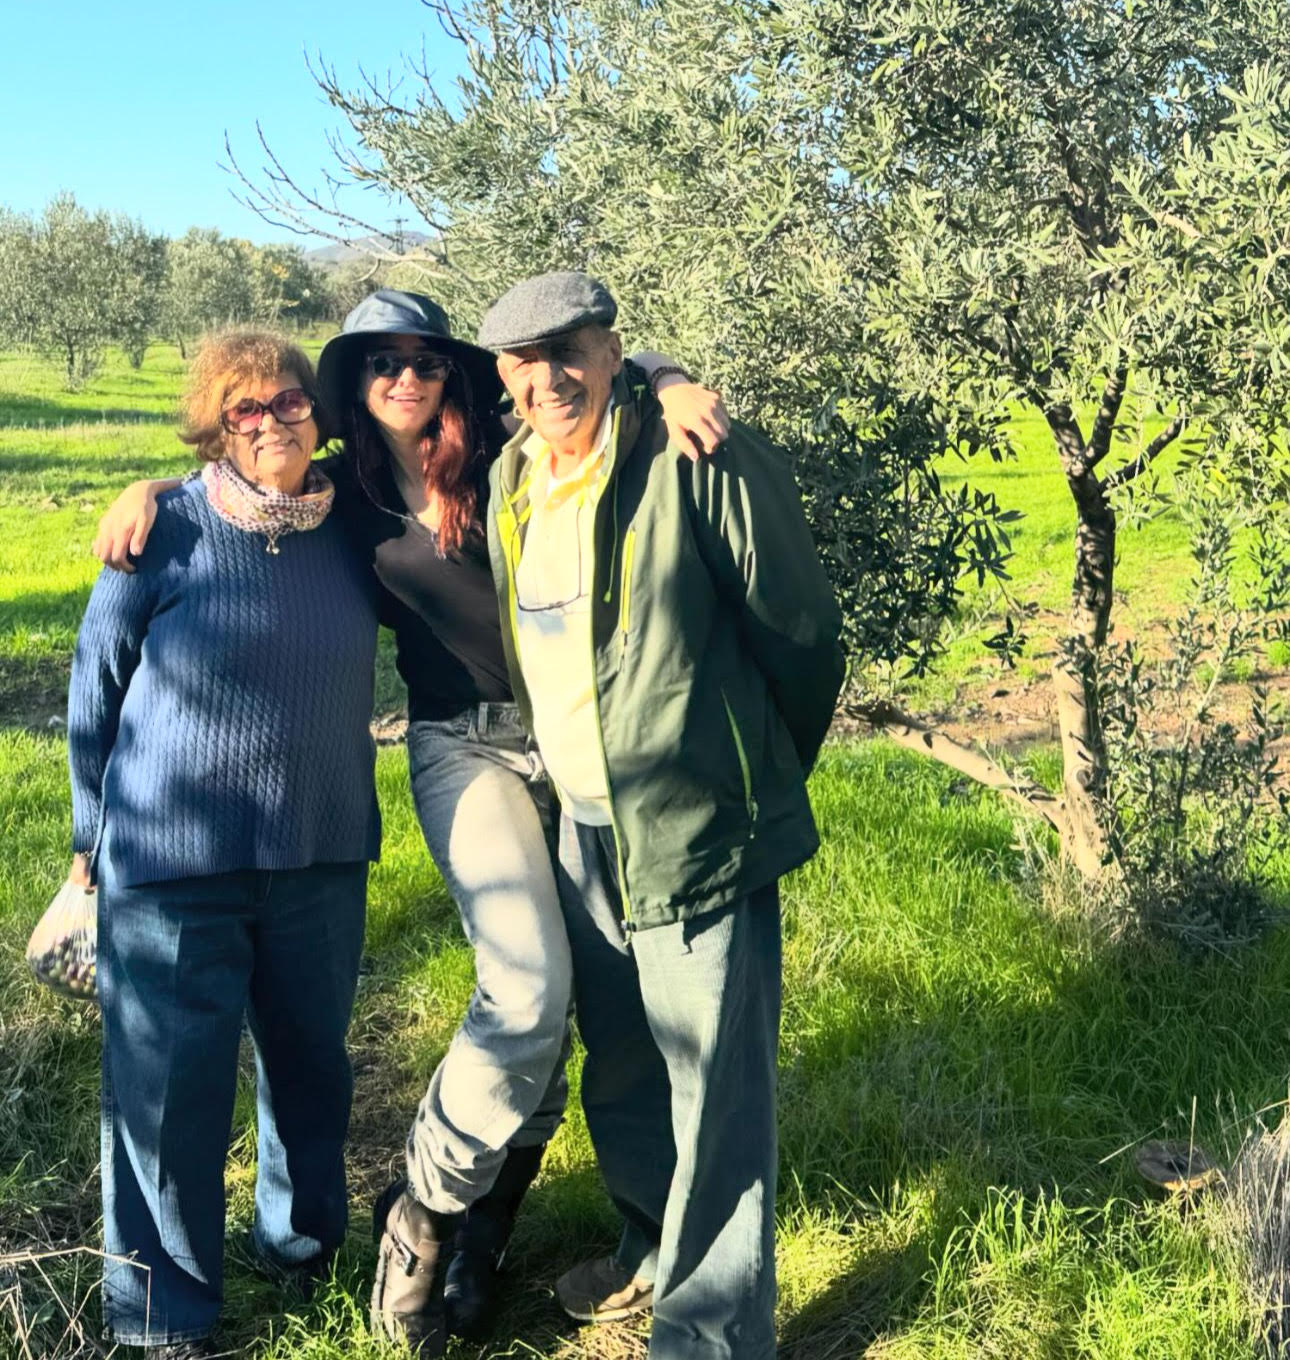
He said things aren’t going well. When I asked why, he explained that he used to extract 5 kg of olive oil from 10 kg of olives, but now he only gets 1 kg from the same amount. I asked what caused the change. He said it’s due to a lack of rain and much hotter weather compared to previous years.
According to Nicolas Netien, an environmental engineer and organic farming expert who co-founded Atsas Organics for extra virgin olive oil, “The heat isn’t an issue; the olives can withstand it. The real challenge now is the shifting patterns. Conditions are becoming increasingly unpredictable, which means we need systems that are more adaptable and resilient.” Each year, it is becoming harder to predict what will happen. Winter rains are not arriving, and spring is experiencing unexpected snowfall during the flowering period, followed by intense heat that comes a month early and lasts twice as long. All of this has placed significant stress on the olives specially this year in 2024.
According to UN-FAO, “Changes in temperature, precipitation, and extreme weather events due to climate change are already affecting crop yields and quality in many regions, threatening global food security.” Which highlights how shifts in climate variables like temperature and precipitation can significantly impact crop quality and agricultural productivity.
When climate shifts affect the surrounding ecology, it signals the need for us to adapt. Otherwise, like my grandparents, people begin to lose both the quantity and quality of their crops, and my grandparents aren’t the only ones affected. Olive farmers in Greece, Spain, Italy, California, and other areas may face similar challenges.
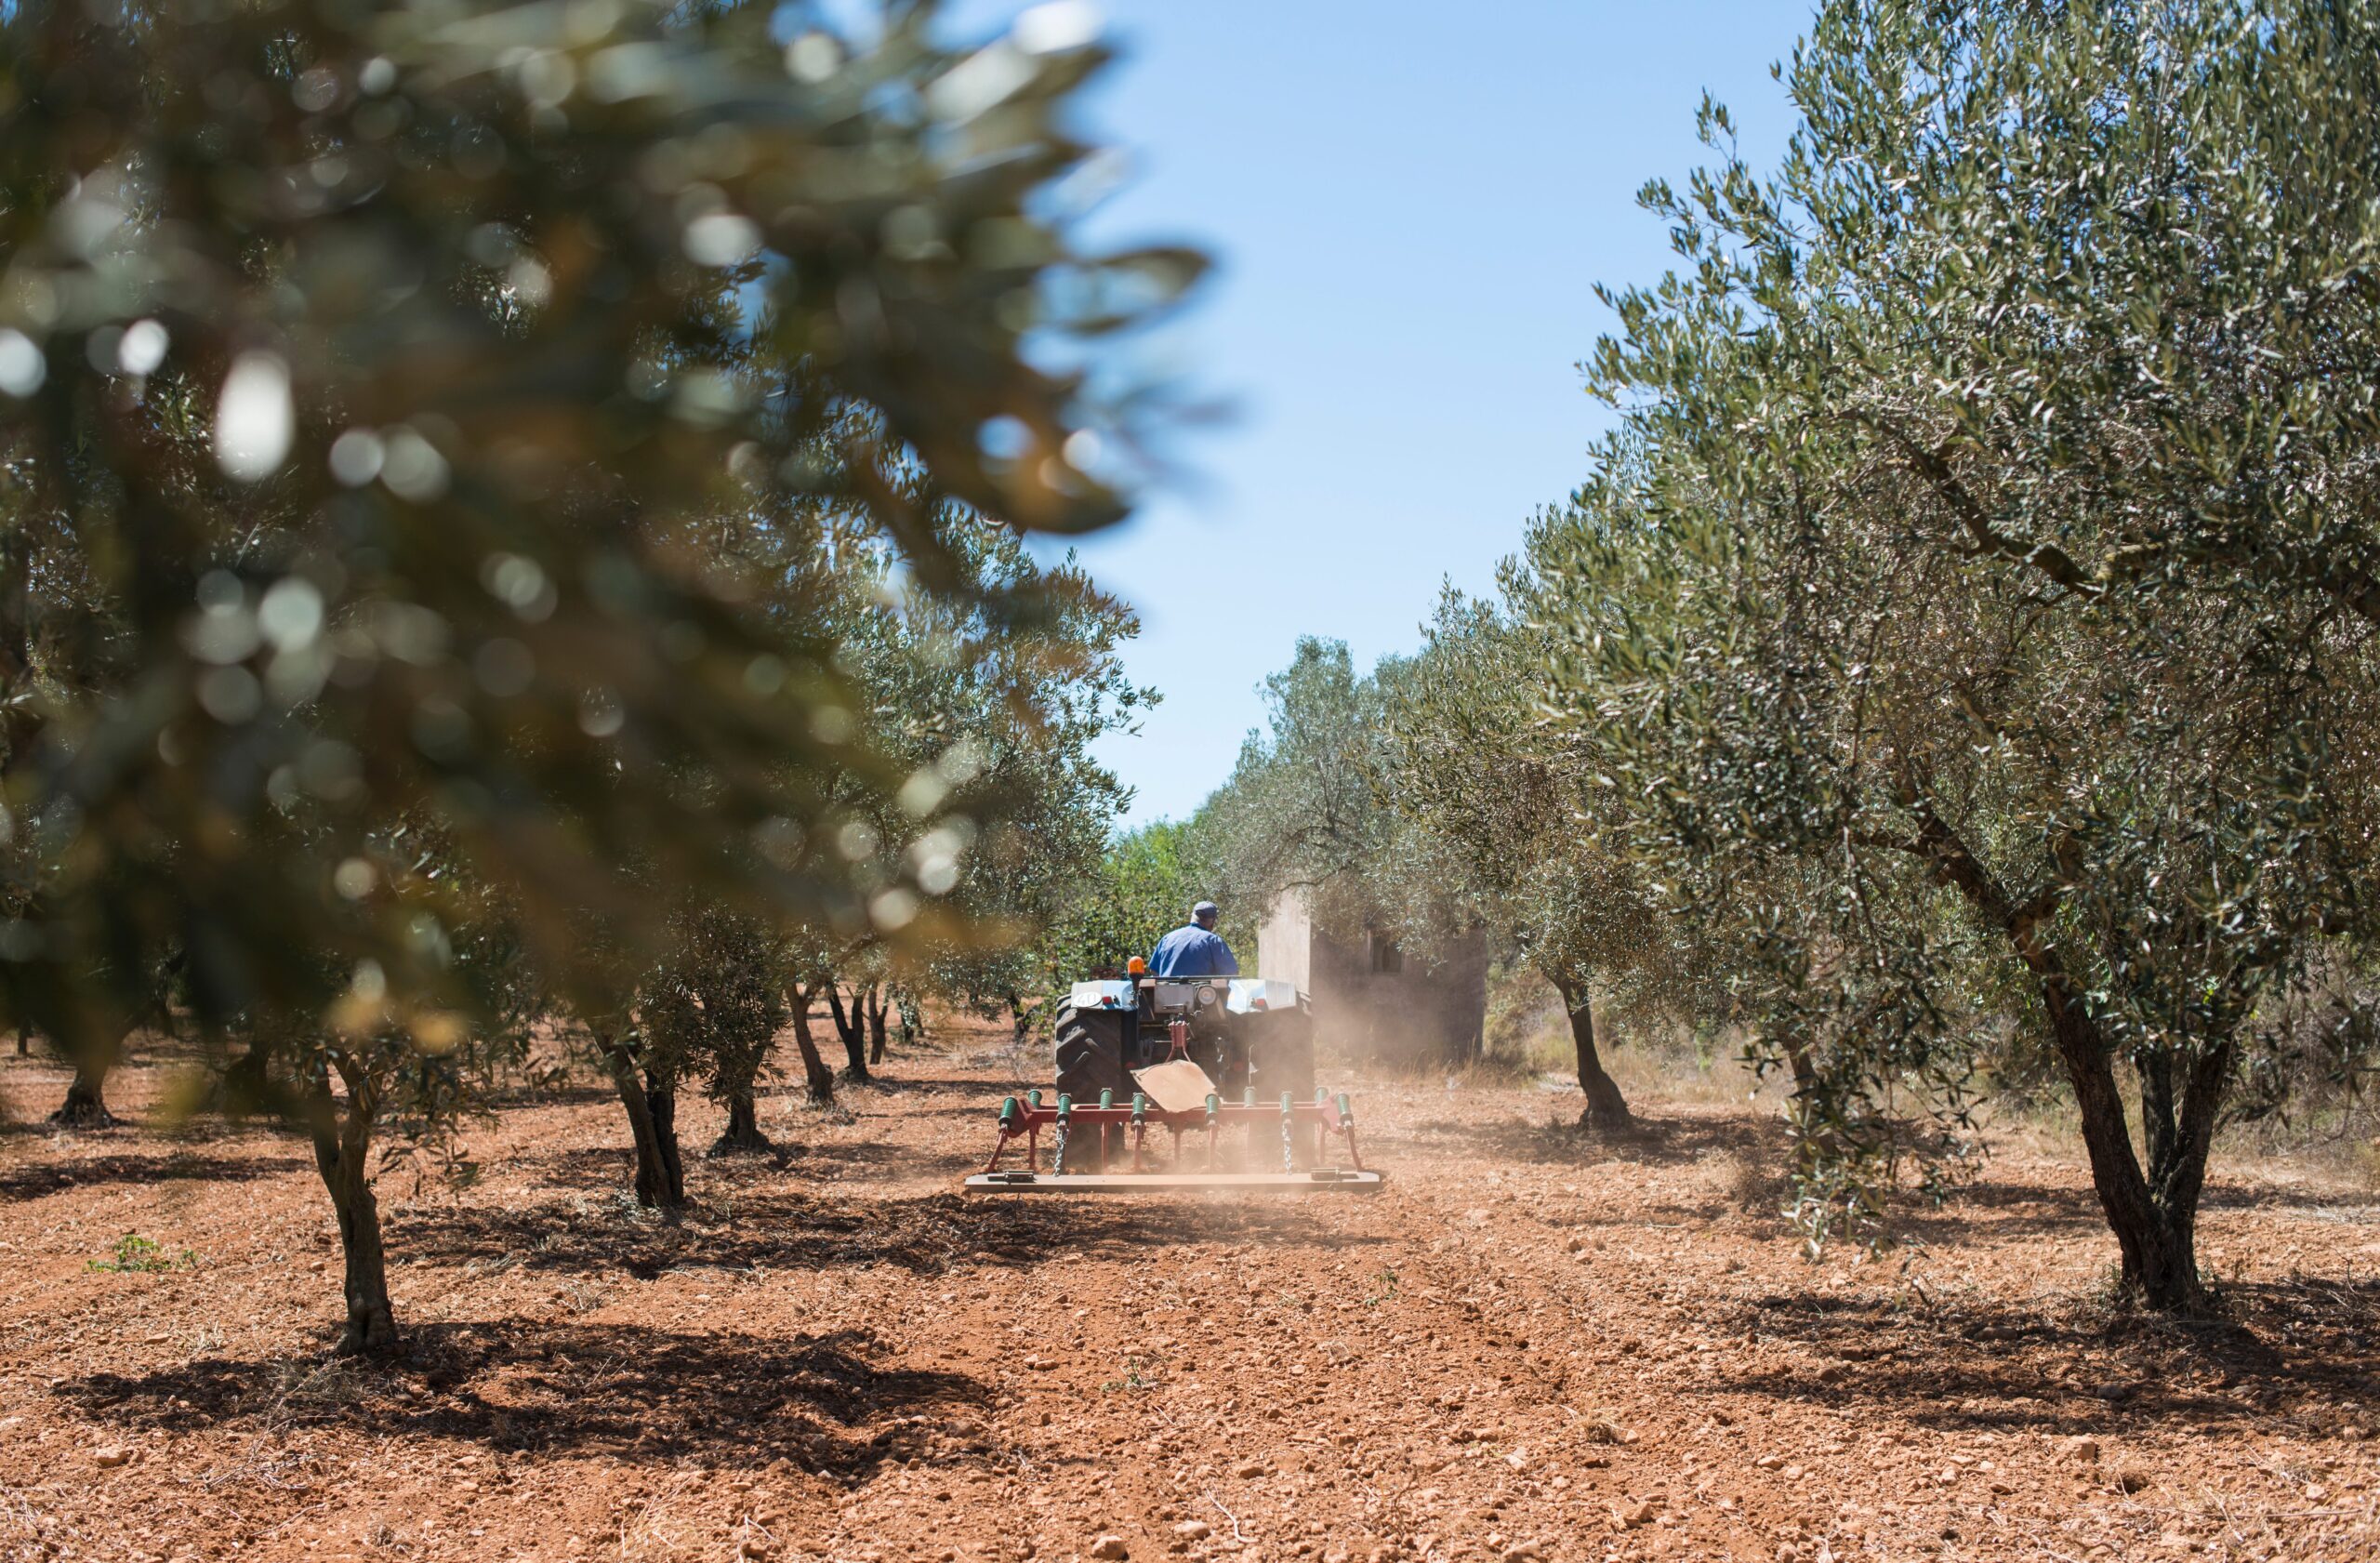
The good news is just because a region becomes less suitable for olive tree agriculture doesn’t mean it’s impossible to grow olive trees there. A loss of suitability means that more effort and resources are needed to make olive trees grow viable and productive. Adapting to climate change in olive production could involve introducing or expanding irrigation systems or terracing hillsides to optimize growing conditions in milder temperatures. Farmers might use modular shades to protect olive trees from peak UV radiation or apply treatments to ward off pests and diseases. Adjustments in orchard management could maximize water efficiency, improve soil nutrients, or utilize cover crops to enhance soil carbon retention (EOS Science News by AGU).
In response to changing climates, olive cultivation may also shift to newly suitable areas, or farmers could explore different olive varieties that are more resilient under future conditions.
But before all of that, we need to determine where to allocate resources and efforts by understanding the potential impact of climate change on terrestrial ecosystems by 2050 and how it will affect olive trees in those ecosystems. I decided to analyze the olive trees on Turkiye’s Aegean Coast to understand the potential impact of terrestrial ecosystem changes on olive groves by 2050.
What I found is that if we make the right decisions in managing the land with the future of sustainable farming, regardless of potential climate and land cover changes by 2050, we could save up to 88 percent of the olive trees on Turkiye’s Aegean Coast. However, if we don’t, we risk losing 53 percent of these trees. (This is a projection based on our model not a prediction, it describes what may happen, and that the results are subject to change) This region accounts for 80 percent of Turkiye’s olive production, and since Turkiye is one of the top three olive producers in the world, this would affect many people around the world. In addition, similar outcomes are likely in other olive growing countries.
In this blog article, we explain how we did our spatial analysis using the data from ArcGIS Living Atlas of the World to understand the percentage of olive trees that may be impacted by the climate and ecosystems change in 2050. You can implement the same method for your own region for any type of crops.
Study Area
In our analysis, we used the 1km resolution Projected Change Types for World Terrestrial Ecosystems (WTEs) in 2050 under the SSP5-8.5 scenario available in ArcGIS Living Atlas of the World, a derived layer from the Projected World Terrestrial Ecosystems 2050 (SSP5-8.5) and World Terrestrial Ecosystems 2015 datasets available in ArcGIS Living Atlas of the World, alongside a 10km resolution olive trees dataset from International Food Policy Research Institute’s Spatial Allocation Model (SPAM) Global Spatially-Disaggregated Crop Production Statistics Data for 2020 Version 1.0. Study Extent Water Sheds change area.
World Terrestrial Ecosystems (WTE)
Before you start using the Projected Change types for the WTE layer in your analysis, it is helpful to first understand the concept of World Terrestrial Ecosystems. This will give you a better grasp of what you are aiming to achieve and why.
WTE 2015
In 2020, with a collaboration of The Nature Conservancy (TNC), United States Geological Survey (USGS), and Esri, we developed 250 meter resolution World Terrestrial Ecosystems 2015 (WTE). Terrestrial ecosystems are land-based environments where plants, animals, and microorganisms interact with each other and their physical surroundings. The World Terrestrial Ecosystems (WTEs; Sayre et al., 2020) are a set of 431 ecosystems (or 1,776 ecosystems when stratified by biogeographic regions) conceptualized and mapped as distinct combinations of World Climate Region, generalized Hammond landform type, and European Space Agency (ESA) Global Land Cover for the year 2015.
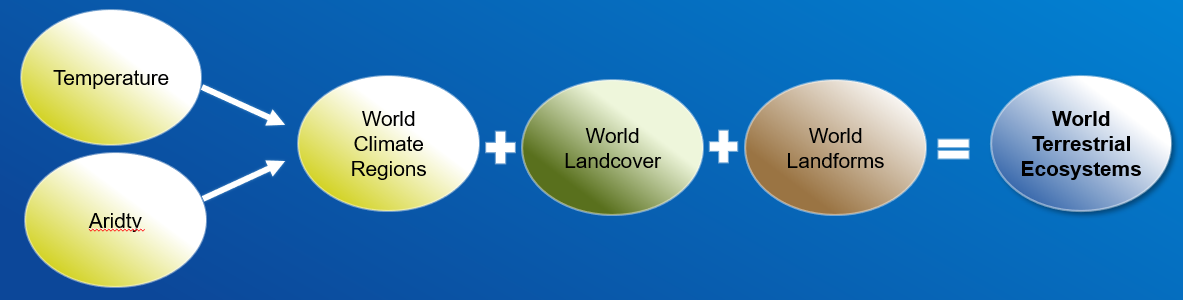
Temperature and aridity data from WorldClim version 2 were used, following IPCC guidelines, to produce 18 climate regions. Land cover was reclassified into eight classes, and landform data were derived from the 2010 DEM, reclassifying the Hammond model landforms (Karagulle et al.) into four classes.
This is the foundational layer that allows us to understand changes in terrestrial ecosystems when compared to the projected 2050 terrestrial ecosystems.
Projected WTE 2050
Last year, we collaborated with USGS, Conservation International, Wildlife Conservation Society, The Nature Conservancy, NatureServe and Clark University. Extended WTE 2015 work by projecting the distribution of WTEs by incorporating climate and shared socio-economic pathway scenarios for 2050, and identifying the types, magnitude, and locations of changes in the distributions of Earth’s terrestrial ecosystems. See the blog.
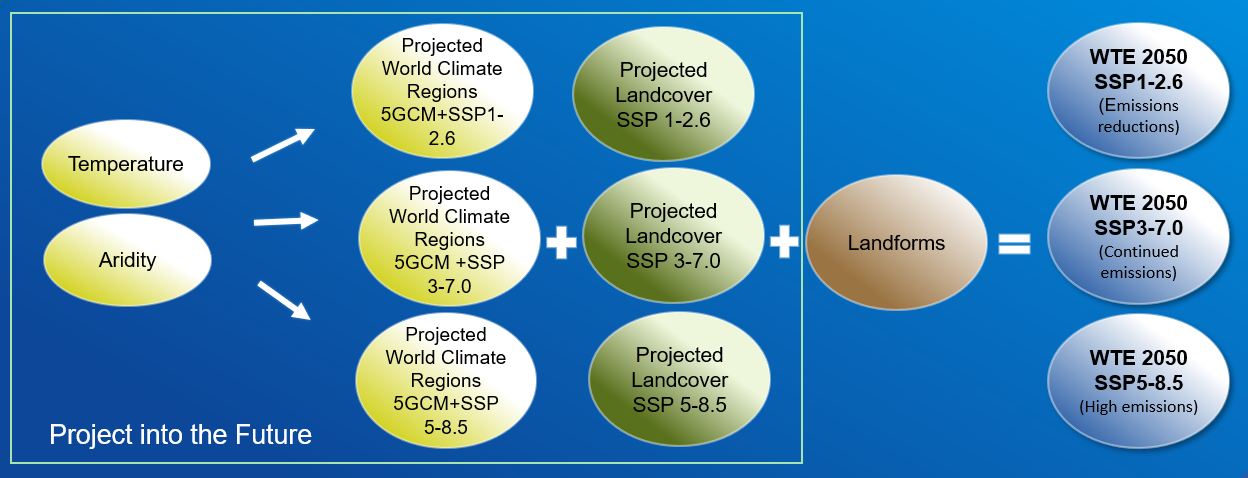
By leveraging global climate models, climate regions and landcover can be projected into the future. The latest global climate models, part of the 6th Coupled Model Intercomparison Program (CMIP6), use a range of developmental and emissions scenarios known as Shared Socioeconomic Pathways (SSPs).
We selected three CMIP6 SSPs to model three projected 2050 WTEs. SSPs represent narratives describing broad socioeconomic trends that could shape future society. The three SSPs selected for the global ecosystem modeling were the emissions reductions pathway (SSP 1-2.6, hereafter SSP126), the continued emissions pathway (SSP 3-7.0, hereafter SSP370), and high emissions pathway (SSP 5-8.5, hereafter SSP585).
We used CHELSA version 2.1 (1-km) climate models from CMIP6 instead of World Clim version 2. We followed IPCC guidelines incorporated with three SSPs described above. For each of the SSPs, we selected modeled climate data from five CHELSA-compiled CMIP6 GCMs: UKESM1-0-LL, MPI-ESM1-2-HR, MRI-ESM2-0, GFDL-ESM4, and IPSL-CM6A-LR. The combination of five GCMs and three SSPs produced 15 bioclimate combinations with 19 classes of climate regions.
For the projected landcover dataset, we used existing models from Chen et al. (2022) The Chen et al. models are 1 km spatial resolution global projections at 5-year intervals from 2015 to 2100 for eight SSPs, including the three provided with the CHELSA GCMs and described above. The Chen et al. models harmonized global land use data from the Land Use Harmonization 2 (LUH2) model (Hurtt et al., 2020) and the ESA/CCI GLC data based on reclassifying the LUH2 outputs into 17 plant functional types (PFTs) We then reclassified them in to eight classes.
We used the same Landform dataset that we used in 2015 WTE as third parameter. In the case of the 2015 WTEs, that meant combining three input layers to produce one ecosystem map. For the 2050 WTEs, however, the use of five GCMs each with three SSPs produced 15 climate region outputs, and the single model vegetation and land cover projections produced a total of three landcover outputs based on three SSPs.
The climate region, global vegetation and land cover, and landforms inputs were then combined to assign a WTE classification per SSP following the original WTE typology described in Sayre et al. (2020). The five 2050 WTEs for each SSP. To simplify outputs and derive one final, predominant WTE for each SSP, we applied a majority rule across all five 2050 WTEs per SSP to identify that which occurred most frequently. We produced three projected WTEs based on three SSPs and GCMs.
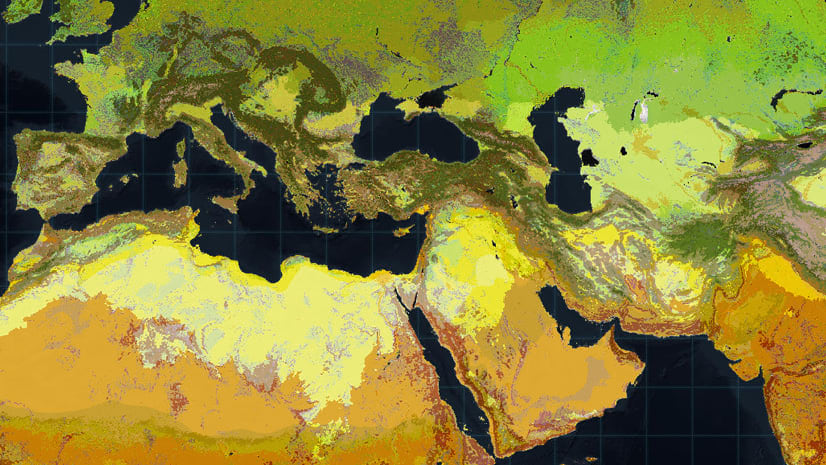
Using this data, we compared the ecosystem type of every 1 km² land pixel on Earth in 2015 to its projected type in 2050 under three scenarios, each representing varying trajectories of human behavior and climate change.
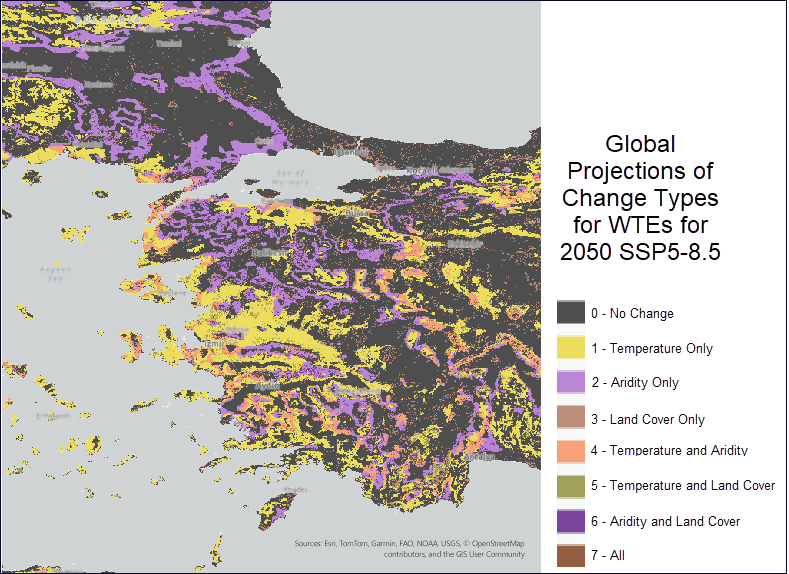
By analyzing the 2015 and projected 2050 World Terrestrial Ecosystems (WTE), we observed potential global climate changes in ecosystem types. This analysis forms the basis of our study, using the Projected Change Types for WTEs in 2050 (SSP5-8.5) layer. This layer shows the types and combinations of modeled changes to WTEs from 2015 to 2050 under the CMIP6 SSP5-8.5 emissions scenario. We used this data to identify the drivers of ecosystem change in our model and to calculate the impact on olive trees within those drivers.
What is driving the ecosystem changes in our model?
Ecosystem changes in our model is driven by climate-related disturbances and anthropogenic, or human-caused, disturbances. Each WTE is defined as an area with a unique combination of the three inputs (climate setting, landform, and land cover). It follows that if any of the three input variable classes change the ecosystem type itself changes.
To develop solutions for sustainable olive production and improve land management planning, it’s essential to first identify where these changes are occurring.
We created a set of change layers that indicate whether a change occurs and, if so, what type of change occurs. We used these layers to determine the percentage of olive trees located within different types of ecosystem disturbance areas in 2050.
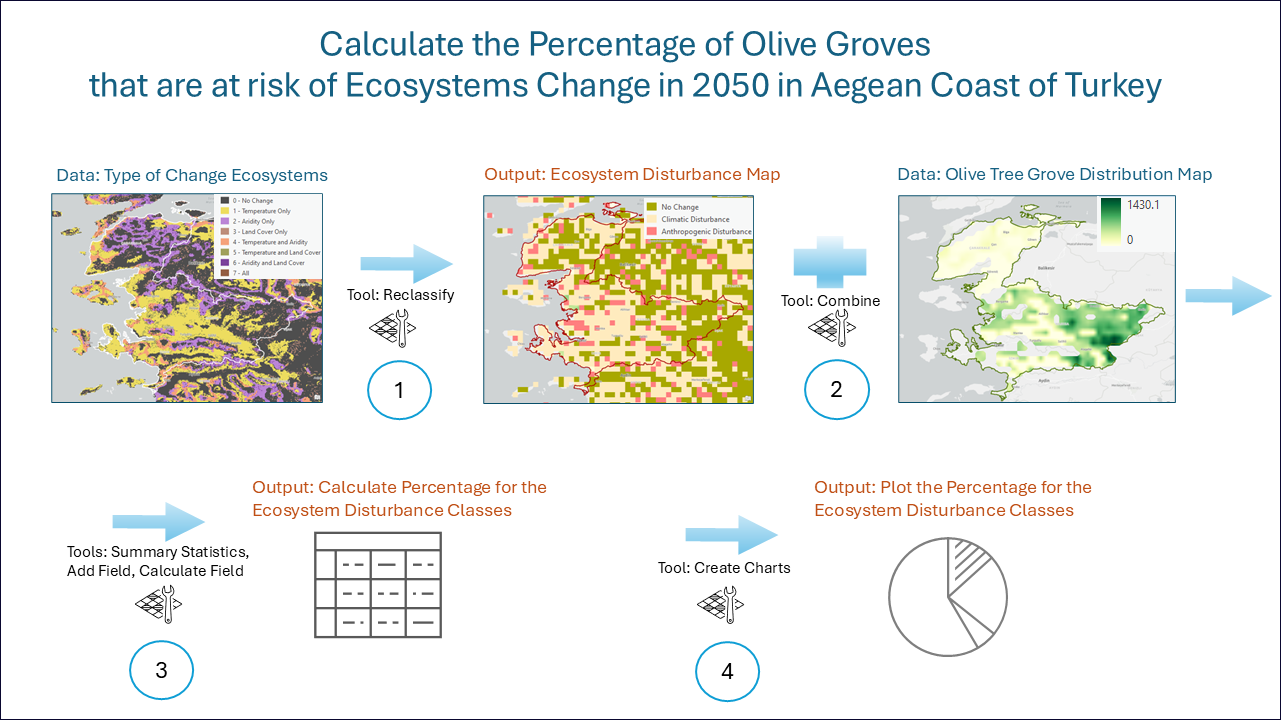
Workflow
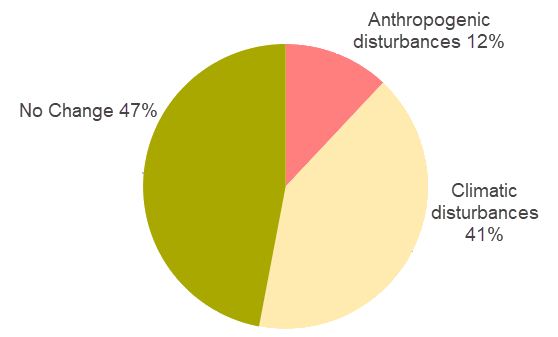
The analysis workflow involves reclassifying the change layers to identify areas of no change, change by anthropogenic disturbances, and change by climate disturbances. We then calculated the percentage of olive trees within these disturbance zones.
Step 0: Set up the analysis environment
Prior to doing any analysis, it is recommended that you control the analysis environment from the map environment to ensure that all the steps of the analysis are done in the same analysis environment. Since we had different data at different resolutions, extents and coordinate systems, we set the cell size and snap raster to the coarsest resolution of 10 kms, analysis extent to the Olive Tree Dataset (10 km native resolution), and output coordinate system to the Global Projections of Change Types for WTEs for 2050 SSP5-8.5 (1 km native resolution). This ensured that we processed the correct extent and did not create any data that does not exist, introducing bias in our analysis.
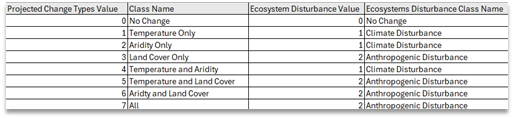
Step 1: Reclassify data
First, we reclassified the Global Projections of Change Types for WTEs for 2050 SSP5-8.5 data from seven to three classes to differentiate between anthropogenic and climate change disturbances to create the Ecosystem Disturbance raster. Here, we assumed that any temperature or aridity change is classified as climate disturbance, and any landcover change is anthropogenic disturbance. Classes that combine temperature or aridity with land cover are classified as anthropogenic, as the area has already changed and cannot be used for crop cultivation anymore. We used the Reclassify tool in the Spatial Analyst Extension in ArcGIS Pro. The table below shows the classification:
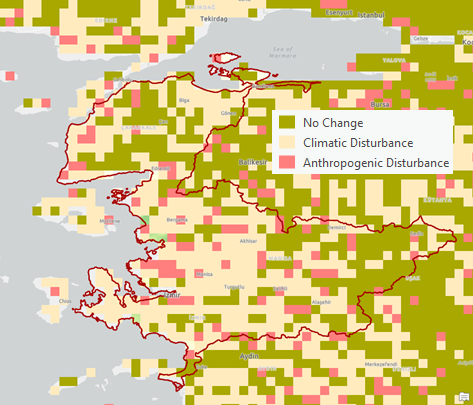
Step 2: View overlap
Next, we combined the olive trees with the ecosystems disturbance raster to see the overlap of the disturbances with the olive tree distribution. Using the Combine tool, we assigned a unique combination to each overlap of ecosystem disturbance to olive tree distribution. There were 327 such unique combinations.
Step 3: Calculate change
Now, using the Summary Statistics tool, we calculated the sum of the percentage of olive farms within each of these ecosystem disturbance zones or that zones that see no change over time.
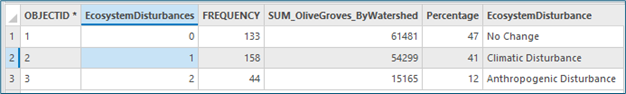
Step 4: Create a chart
To visualize our findings, we created a chart from the attribute table of the summary statistics. We clicked Create chart chose Pie chart and matched the colors of the chart with the map.
Summary
The projected terrestrial ecosystem changes are informed by models of future climate scenarios and the demands of expanding populations for settlement and agriculture. These are models, and models do not prescribe what will happen, rather what may happen. That the results are subject to change. According to our model, significant alterations to our climate that impact surrounding ecosystems underscore the necessity for adaptation.
As a result, we advocate for the integration of maps depicting potential ecosystem shifts into the planning of climate change adaptation strategies, with a focus on the needs of local populations. In this analysis, we assessed areas where existing olive trees may be affected by these ecosystem changes, based on anticipated shifts in climate and the growing land requirements for human activities.
There is an urgent need for sustainable transformations in global food systems to support farmers, especially those who lack access to advanced agricultural technologies, in preparing for and adapting to the effects of climate change. The world can no longer afford to delay these critical innovations (EOS Science News by AGU).
This is just one example of analyzing climate change’s impact on crops using ArcGIS Living Atlas of the World layers and ArcGIS Pro Spatial Analyst capabilities.
You can apply similar workflows to other crop types and regions worldwide using the 2050 Projected Terrestrial Ecosystems dataset from the ArcGIS Living Atlas of the World. This approach helps policymakers identify areas vulnerable to climate change impacts, including regions at risk. It provides crucial information to prioritize adaptation measures, allocate resources effectively, and plan land use strategically.
References:
- Chen, G., Li, X. & Liu, X. Global land projection based on plant functional types with a 1-km resolution under socio-climatic scenarios. Sci Data 9, 125 (2022). https://doi.org/10.1038/s41597-022-01208-6
- Chen, G., Li, X., & Liu, X. (2021). Future global land datasets with a 1-km resolution based on the SSP-RCP scenarios [Data set]. Zenodo. https://doi.org/10.5281/zenodo.4584775
- Karagulle, Deniz; Charlie Frye; Roger Sayre; Sean Breyer; Peter Aniello; Randy Vaughan; Dawn Wright; 2017. Modeling global hammond landform regions from 250-m elevation data. Transactions in GIS 22
- Sayre, R., 2022, World Terrestrial Ecosystems (WTE) 2020: U.S. Geological Survey data release, https://doi.org/10.5066/P9DO61LP
- https://worldpopulationreview.com/country-rankings/olive-oil-production-by-country
- https://www.oliveoiltimes.com/world/the-olive-tree-and-the-rise-of-athens/128031
- https://eos.org/articles/climate-change-threatens-70-of-winemaking-regions
- https://sustainablefoodtrust.org/news-views/what-we-can-learn-from-olives-chemistry-conflict-and-cyprus/
- https://www.esri.com/arcgis-blog/products/arcgis-living-atlas/announcements/2050-projections-of-world-terrestrial-ecosystems-are-now-available/
- All pictures are sourced from Adobe Stock and personal images


Commenting is not enabled for this article.