As much as baseball and apple pie are imbedded into American culture, so is the dislike of taxes. With all the taxes we pay—federal and state income, excise, sales, and many others—property tax is unique in our tax ecosystem. It is one of the more transparent taxes that strives to be fair, equitable, and uniform. Most property tax is a local government levy and the benefits are tangible. We enjoy what these taxes fund every day—police and fire protection, public schools, civic works such as our roads and parks, and many others. Some say that property tax pays for the things that make our lives safe and enjoyable. See Why I like Property Tax
Regardless of the things that taxes bring us, we still don’t like property taxes, but we do tolerate them for a few reasons. We understand what we get from them, and we believe we are taxed about the same as our neighbor. This transparency is key in the success of our property tax system. Some argue that the more transparent the assessment operation is, the fewer the costly tax challenges and valuation appeals there are.
But what happens when property values drop and there is inadequate property tax revenue to provide the services we enjoy? In some areas, raising taxes can be political suicide. So, what to do? A GIS (geographic information system) can help.
Declining property values—Five things to consider
When you can’t raise taxes, the first thing usually done is to be sure that all taxable property is on the tax roll. Assessors are mandated to provide a complete tax roll: an inventory and detailed information on real property and in many jurisdictions, personal property. A GIS can help with this. It can provide purpose-built tools to efficiently map parcels to ensure all taxable land parcels are in your system and to review imagery to be sure all buildings are captured and valued. Many jurisdictions connect their deed registry and permitting systems to their GIS to have a clear view of what is happening and going to happen in their jurisdiction.
The second thing is to be sure all properties are valued at the highest defendable or mandated level. Many jurisdictions have a legislated sales ratio. A sales ratio is the assessed value divided by the actual sale from a fair market value transaction. If these sales ratios are below the legislated rate or values in the assessment system are not well modeled, there is untaxed value and potential tax revenue unrealized. Maps displaying sales ratios, cost per square foot, and valuation model validation parameters help to understand the quality of assessed values, quickly identify outliers, and deliver easy-to-use infographics to better defend assessments.
Tax what is currently not taxed is the third action local governments can take. One might think all things taxable are currently being taxed, but that’s not always the case. For example, New York City is working on developing a 3D tax map so they can map air rights. Air rights are a 3D parcel—they have defined boundaries, specific rights and restrictions, and can be sold. Because they can be bought and sold, they have value. Because they have value, they can be taxed. This isn’t a fit for a lot of smaller jurisdictions, but in communities where there are valuable views, there are valuable, taxable air rights.
Proper oversight of property tax systems is a must. The local assessor works to ensure that assessed real estate values are fair, equitable, and uniform in their jurisdiction. But what about adjacent jurisdictions, and jurisdictions across the state? Maybe one jurisdiction overvalues and the neighboring jurisdiction undervalues. This is usually the job of the state department of revenue to equalize and ensure that valuations and local property tax are fair across boundaries, as well as ensure that state dispersed funds are equitably distributed.
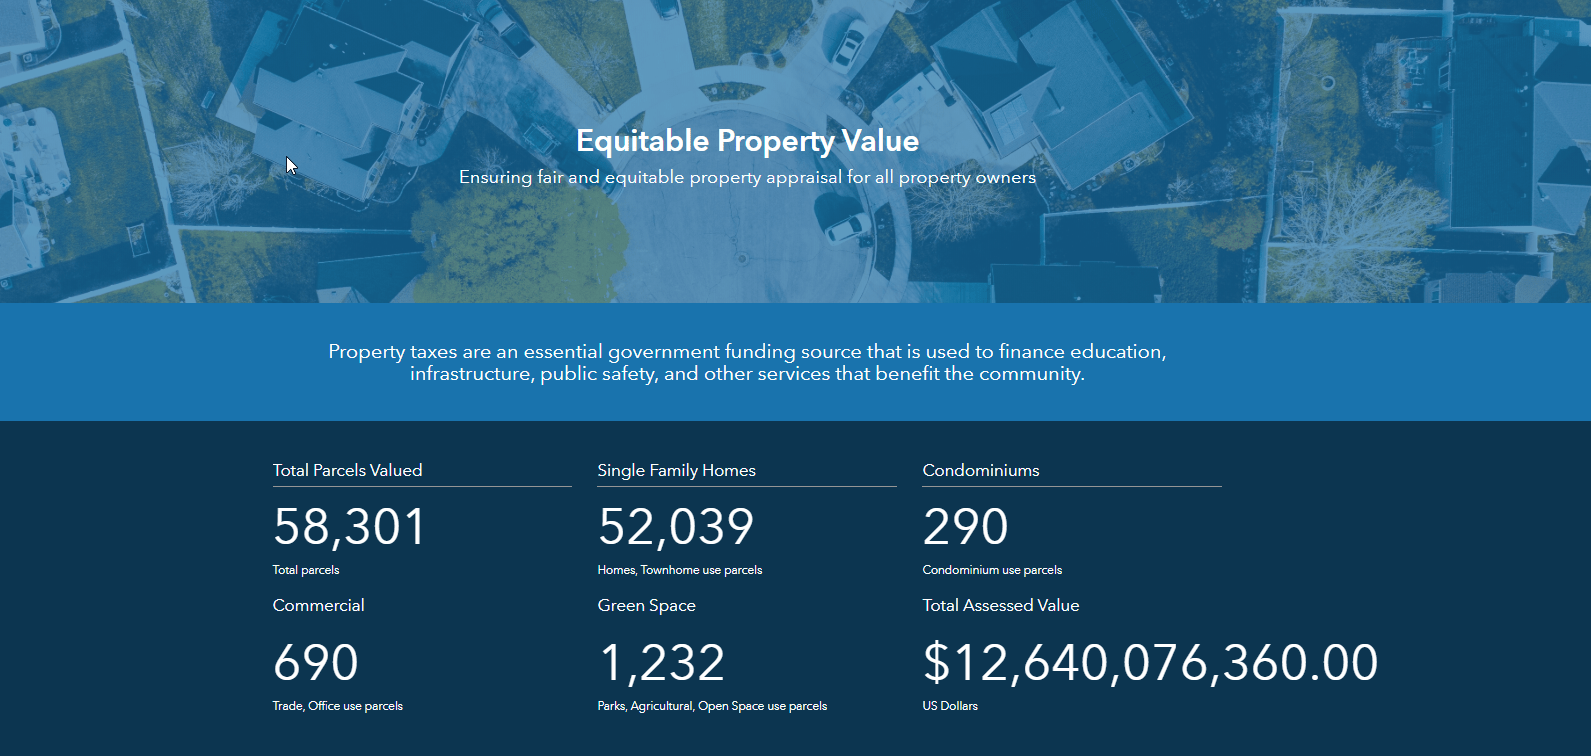
Lastly, but perhaps the most important, is to communicate with taxpayers and the public. Posting the tax roll and values once per year may be the legal requirement in many jurisdictions, but that’s not the public expectation. The public expects information to be current, easy to find, and easy to use. Open data portals have gone a long way to deliver information to the public, but they are still more likely to deliver data than information. Hubs, such as the ArcGIS Hub initiative Equitable Property Value, are one-stop-shop self-service points of information—they deliver a combination of data and information in the form of apps and maps. Hubs are the location for what you want to communicate to the public: tax and property information, maps, assessment calendars of activities, appeals information, explanations of how property is assessed, and more.

Property values will be impacted by the novel coronavirus (COVID-19). No one knows how much and for how long. But we do know that revenues for many industries will be heavily impacted—restaurants, hotels, and vacation destinations, just to name a few—and the incomes from the properties they occupy, reducing their property tax income.
Nobody likes property tax, but everybody likes the services it provides. We may be entering a dynamic real estate value market and it will be difficult to keep up with everything that needs to be done. We can’t change the market, but we can provide current, accurate, and complete data for fair, equitable, and uniform assessments. We will need to modernize our communication with the public with contemporary systems to reduce inquiries and appeals. We need to better use our GIS.

Commenting is not enabled for this article.