Engagement Matters – Part 2
This article is the second part of a four part series on collaboration and engagement.
Part 1A Hub for
|
Part 2Empowering
|
Part 3Sustaining
|
Part 4Building
|
Click on any of the articles above to jump forward or backward
A common misconception is that it’s really hard to empower stakeholders or a community because it involves too many people and takes too much valuable time away from doing “actual work.” In reality, empowering a community, and making the time to do it, is a critical component of your organization’s success. Empowerment starts with trust. Stakeholders will only engage with you if they trust you and a community will only feel empowered if you build that trust over time with open data.
Sharing open data with your community helps build trust in two ways. First, it demonstrates that your organization is willing to be transparent and accountable.
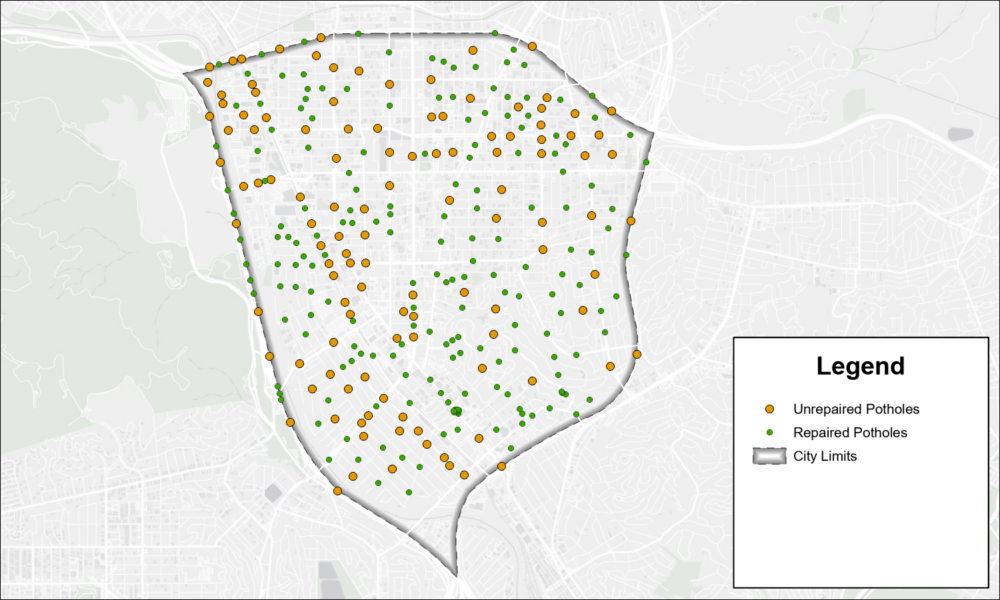
An open dataset of potholes used in an interactive map can communicate where potholes are on your roads and the extent of the challenge across the city, but only if you know how to use it. It’s tempting to think that by simply sharing a single dataset that we’re being as transparent as possible, but there’s an opportunity to create more value for your stakeholders which empowers them to understand and engage with you.
The second way to build trust with your community is by showing data in context. Your stakeholders have limited time, short attention spans, and little or no background knowledge about the issue you’re trying to communicate. Empowering your community starts with making information relevant, relatable, and actionable. In addition to sharing a current potholes dataset, we can create a map that provides other datasets and context.
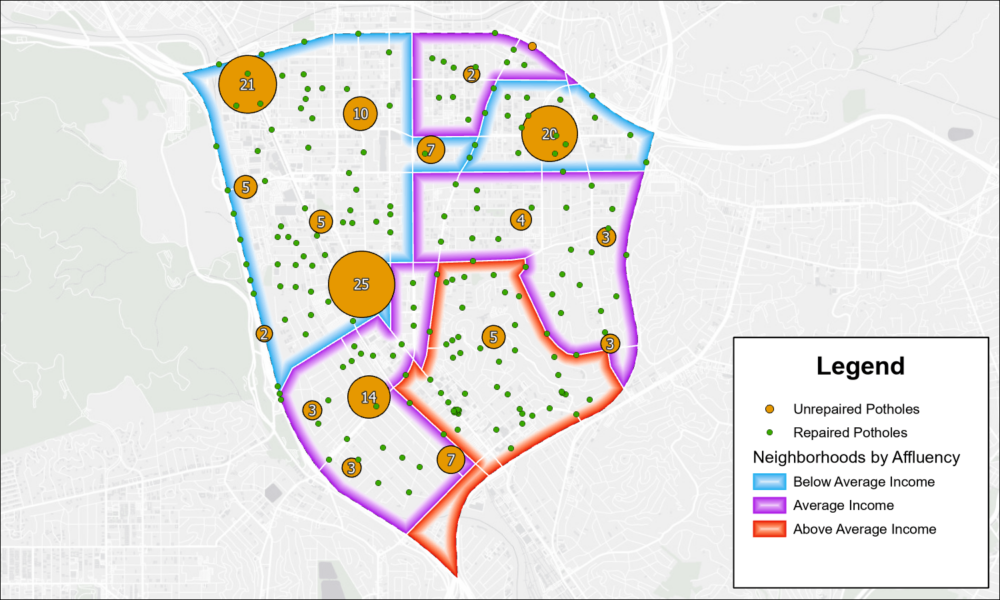
Clustering the pothole points communicates where the trouble spots across the city are located. Adding neighborhood boundaries that are symbolized by average income provides more context and helps show how resources are allocated equitably across the city. Sometimes it’s easy for a stakeholder to look at just a map and see the pattern you need them to see. The challenge is that sometimes these patterns aren’t easy to see, and without more context, a single map can communicate the opposite of what we intend. In fact, if you look only at the map above it seems to highlight that there are much higher concentrations of unrepaired potholes in lower income neighborhoods than in higher income neighborhoods. If we look only at the raw pothole data, this is true, but it isn’t the full picture and certainly doesn’t help everyone in our community feel empowered. The actual story that our pothole data alone can’t tell is this: Potholes are one critical component of a much larger road safety and improvement program that the city has undertaken. An independent assessment of the roads in this city found that the roads located in the poorer neighborhoods are much older than the ones in the affluent neighborhoods and, as a result, have a higher rate of potholes. These older roads have been targeted for a multi-year repaving plan that will repair existing minor potholes and prevent new ones from happening. By delaying repairs on minor potholes on these roads and only focusing on major pothole repair the city is able to divert resources to the repaving project to get that work done faster. In this scenario, our open data is helping to tell this story. We just need to learn how to speak the language of trust.
Just like regular language uses words to form sentences which convey thoughts, open data’s true strength is in storytelling. Simply posting datasets to an open data portal is a good start but it doesn’t convey meaning to most people. It certainly doesn’t empower the majority of stakeholders to understand an issue and engage with you, and act. To truly empower a community with open data, we need to organize these open datasets into visualizations and those visualizations into a cohesive story that is easy to understand.
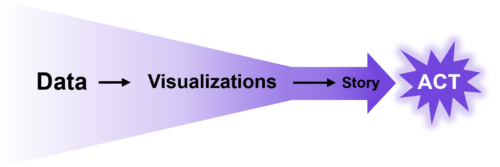
The map is a good start but it’s only one piece of our larger story. Ideally, we’d include that map in the bigger discussion of the city’s goal to improve traffic flow and safety.
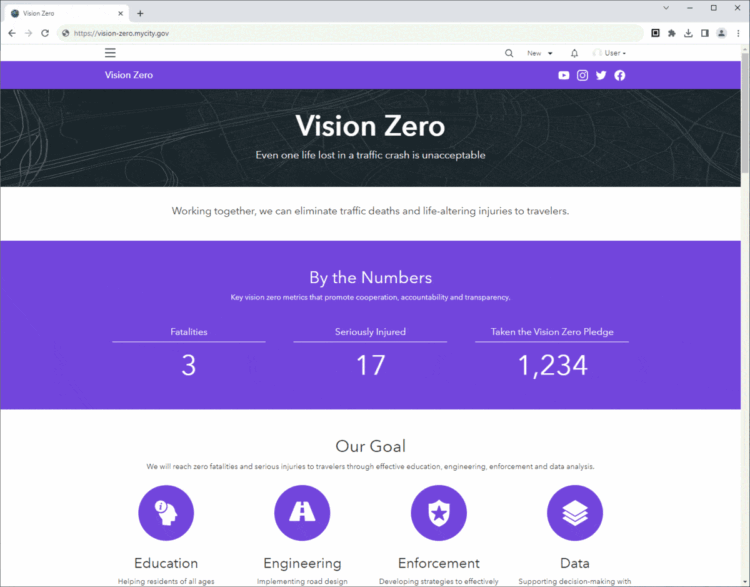
We’d explain the “Vision Zero” initiative and how it encompasses different road-related projects including pothole repairs and road repaving. Each of the datasets or projects involved in the initiative could use a variety of maps, charts, dashboards, indicators, images, video, and text that all work together to tell this story to our stakeholders in a way that’s easy to understand. Empowering stakeholders by translating open data into a cohesive story using visualizations and data builds trust over time. Ultimately, empowering a community with open data can result in the community empowering the organization as well. Engaged stakeholders bring unique perspectives to challenges that communities face. They can also help collect and contribute new data to make a challenge better understood. A dataset of the potholes reported by residents on-demand will present a vastly different (and arguably more complete) picture of real-world conditions than a dataset that relies only on bi-annual surveys done by city crews.
This two-way engagement leverages the trust that is developed between the city and the communities it serves.
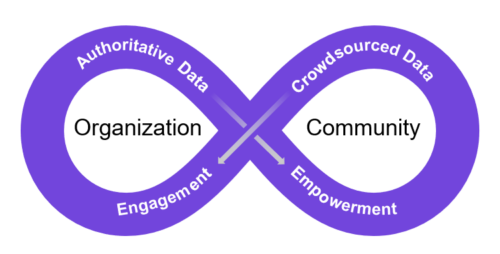
Stakeholders will be more likely to contribute to the discussion of safer roads if they feel that their voices are heard and issues are being remedied. This communication helps create a continual loop of positive feedback that is critical to empowering the community to become an active participant in solutions to big challenges. Over time, as more of this communication between organization and stakeholders happens, trust is reinforced, and the community is empowered.


Article Discussion: