If you missed our announcement of our new Civic Analytics with Hub community from last week, I invite you to check it out and join our community.
Welcome to Week 2 of ArcGIS Hub’s Civic Analytics notebook series. Last week we kicked off our Civic Analytics notebook series with two introductory notebook analyses that shows how Open Data released by your local government can be accessed and quickly understood using simple scripts in Python. In those notebooks we saw how civic data can be summarized and visualized using the spatial and temporal information from these datasets.
Accessibility analysis
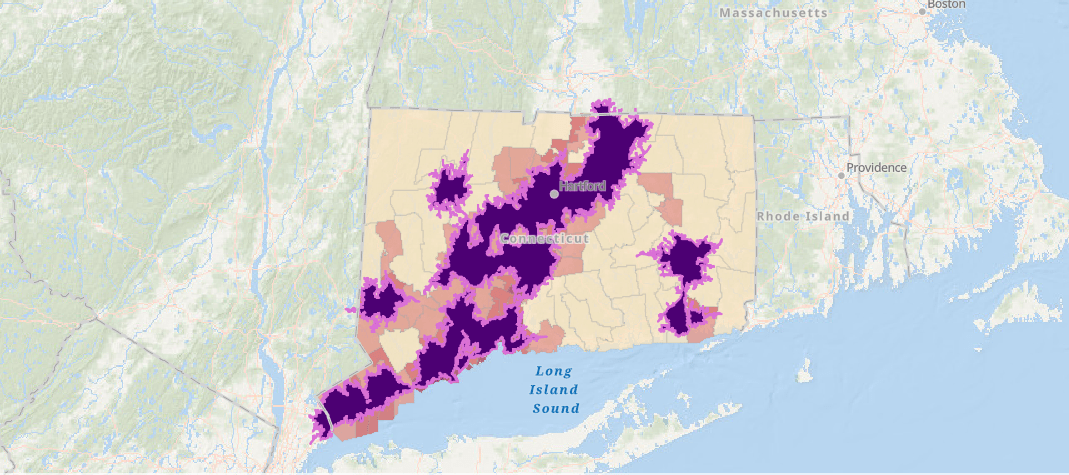
This week we look at two spatial analysis techniques in ArcGIS. We use data from Connecticut to investigate Which housing districts need more Covid-19 testing sites?. In this analysis, we fetch housing districts of the state and add variables that provide us with total population and population density (as of 2019) for each housing district. Next, we pull in data for the existing Covid 19 testing site locations across the state and compute areas that are drivable within 15 minutes to these clinics. This helps us identify housing districts that are under-served by quick access to testing locations relative to their population.

This analysis could be used to answer several other questions, for instance-
- ‘Are certain school districts under-served by quick access to public libraries?’
- ‘Which neighborhoods need more parks relative to the number of children in the neighborhood?’
Outlier analysis
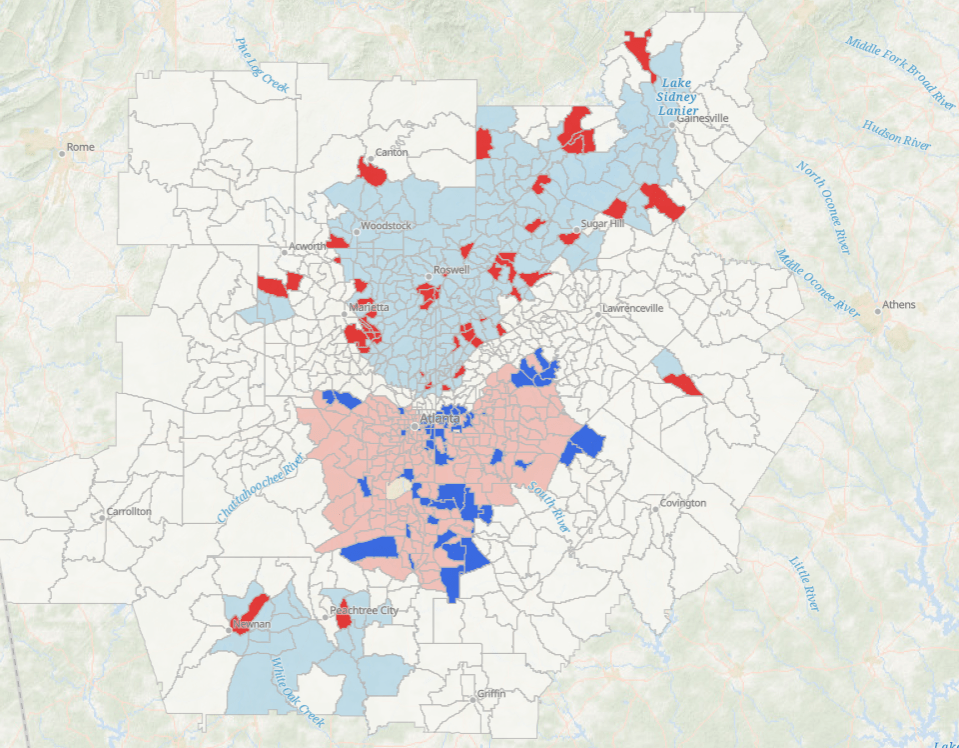
In the second notebook, we work with census tracts of Atlanta to answer the question Which are the census tracts with unusually high unemployment rates?. For the population age 16+, we use the percentage of unemployed people in each census tract to detect statistically significant outliers. This helps us identify census tracts with unusually high unemployment rates compared to the neighboring tracts.

This technique can help address questions such as
- ‘Do we observe areas of unexpectedly low mortality rate or unexpected disease outbreak?’
- ‘Where can we notice distinct difference in high or low crime zones relative to the neighboring areas?’
Try it for yourself!
I encourage you to download these notebooks and use them to find data-driven answers to your questions about your region. Feel free to comment below, or participate in conversations on our Geonet community for Civic Analytics with Hub where we will also add information about our new notebook offerings for the week. Do let us know if you have questions, or analyses with civic data that you would like for us to explore and demonstrate. I can’t wait to connect with you on your findings or questions.
Links to this week’s notebooks:
- Which housing districts need more Covid-19 testing sites?
- Which are the census tracts with unusually high unemployment rates?
Click here to learn more about Week 3 of Civic Analytics with Hub.

Article Discussion: