With all the discussions about the dangers and ethics around emerging artificial intelligence technologies, we sometimes forget all the good that AI is doing in the world. For this article, I’ll outline some of the work we are doing at Esri using AI for improving disaster response.
We will ultimately be training and utilizing 3 separate deep learning models, using parallel processing to do inference against a huge set of aerial imagery, applying some advanced routing algorithms through the ArcGIS ecosystem, and finally utilizing web apps to share and keep track of response progress. This will result in a system that can consume post-disaster aerial imagery, detect damaged structures, detect obstructed roads, and construct a response route in a timely manner. We will be able to not only generate the needed intelligence for a quick and accurate response, but also deliver it directly to the individuals who need it the most: first responders.
Strap in, this is cutting edge tech coming together to save real lives.
Table of Contents
-
-
- Hurricane Michael
- The Challenges of Coordinating a Response
- The Fuss About Aerial Imagery
- How to Teach an AI: Spotting Houses
- How to Teach an AI: Judging Damage
- How to Teach an AI: Judging Road Damage
- Crowd-sourcing AI
- Optimizing Routing
- Where the Rubber Meets the Road
-
Hurricane Michael
Hurricane Michael was one of the most devastating hurricanes in recent memory. On the afternoon of Wednesday October 10, 2018, Hurricane Michael made landfall near Tyndall Air Force Base in Mexico Beach, Florida.
With maximum sustained winds of 155 mph (250 km/h), the category 4 storm nearly leveled the entire base in minutes.
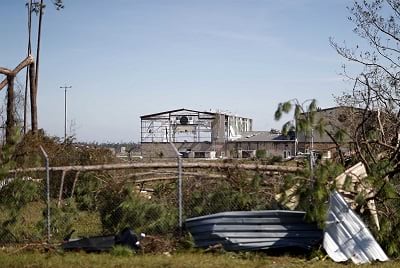
The storm continued on, causing major damage all over Mexico Beach. With a storm surge of 14 ft, dozens of homes were completely washed away along with large sections of U.S Route 98. Many structures were reduced to bare foundation slabs. Trees were mostly snapped and flattened with the few remaining ones having their bark completely stripped from the heavy winds. The path of carnage extended all the way inland to Jackson County, Marianna — where storefronts in downtown were completely torn off the foundation and 3 people were killed

The eye of the hurricane rapidly moved towards Panama City, where massive structural damage was reported including an entire freight train being derailed and multiple television and radio stations being knocked out. When the storm finally left Florida, over $5 billion in property damage was left behind, and 47 people were killed.
When the storm moved into Georgia, it caused massive damage to farms and agricultural land, amounting to over $2 billion in agricultural loss. Many farms were completely washed away at a time when farmers were still trying to recover from the damage caused by Hurricane Irma. An 11-year-old girl was killed when a tree fell on her home.
The storm continued its rampage through North Carolina, Virginia, and Maryland. Hundreds of roads were either washed away or heavily blocked by debris causing dozens of fatalities from road accidents. 4 people (including a firefighter) were washed away in floodwaters in Virginia.
After the storm finally dissipated on October 16th, 2018 (9 days after forming), there was a total of over $25 billion USD in damages and 72 total fatalities (57 in the United States and 15 in Central America).
The Challenges of Coordinating a Response
Responding to a major disaster such as hurricane Michael involves multiple state and federal agencies, multiple first responder and emergency departments, and even commercial entities such as utility companies that must be organized into a cohesive unit in an extremely time-sensitive environment. This is obviously no joke, and a task that is made much harder with the unique challenges of each disaster (fire, earthquake, hurricane, floods etc.) and the time consuming task of extracting and organizing priorities.
The first part of integrating AI into such a complex and sensitive workflow was to identify areas where repetitive human judgments were being made (preferably at scale). This is a good proxy for identifying where AI might be useful in general: find where either intuition is being applied at scale or where there is a need for new insights/discoveries from data. We found this quickly among the hugely important task of analysis of post-disaster aerial imagery.
This was a natural use case not only because of the ubiquitous use of aerial imagery post-disaster, but also because of how well the Esri ecosystem is set up to do the sometimes arduous task of pre-processing, viewing, and preparing imagery data.
The Fuss About Aerial Imagery
Good aerial imagery is a beautiful thing. From high resolution, multi-band, hyperspectral — aerial imagery can capture everything from changes in land cover to the changes in the polar ice caps. Unfortunately, good aerial imagery can be expensive, hard to come by publicly, and hard to work with without the proper tools. The ArcGIS Pro software provided by Esri allows us to seamlessly ingest, label, and prepare our imagery data for eventual training of complex AI models. We can even use the related ecosystem to publish our results in a way that first responders can immediately access to help organize a response (many of these organizations already have Esri software set up as well).
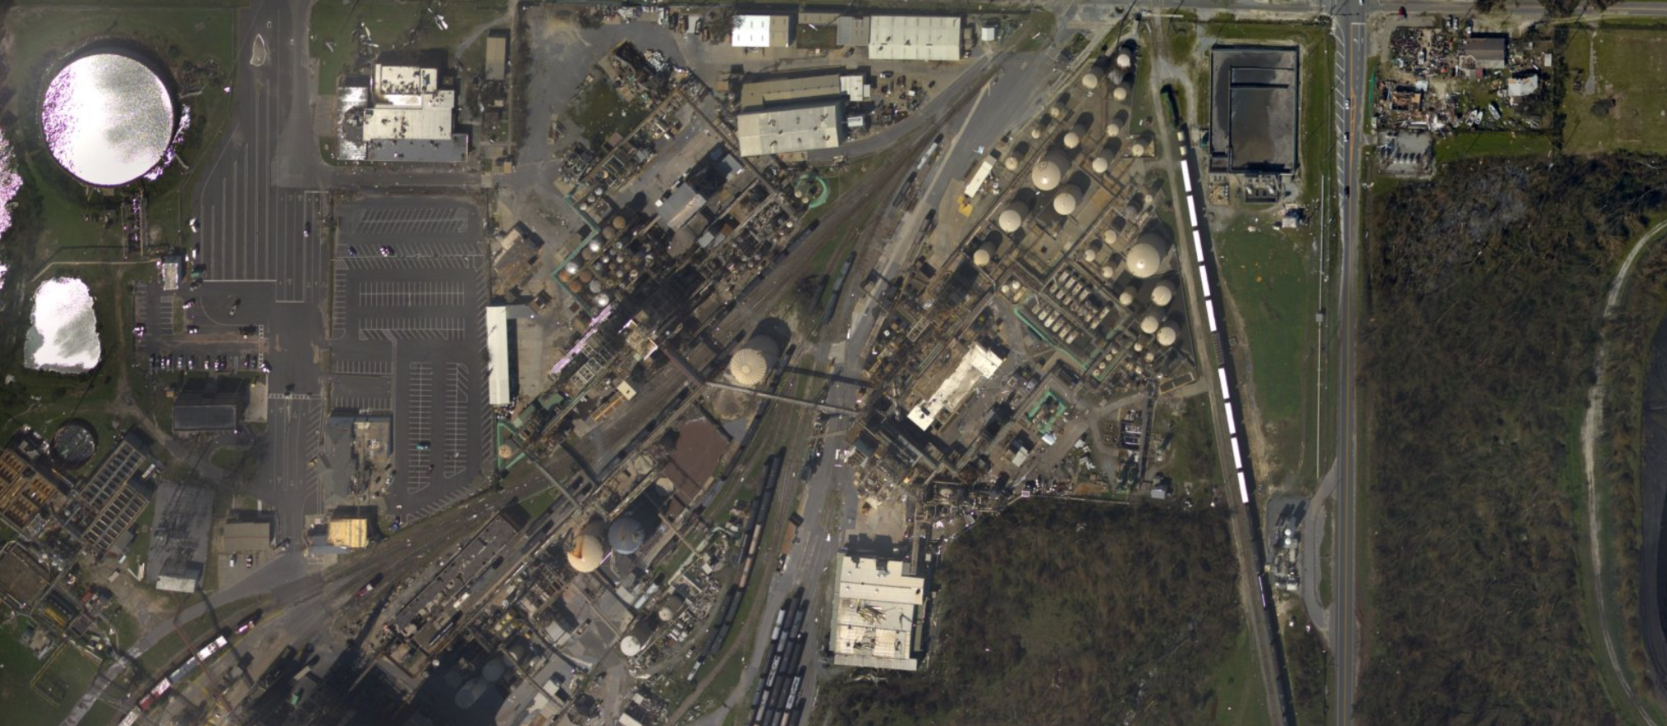
For this project, we utilized imagery captured by NOAA following Hurricane Michael.
The first two AI models we will go over perform the most important and time-sensitive tasks that imagery analysts engage in post-disaster: identifying damaged structures where people may be trapped.
How to Teach an AI: Spotting Houses
The very basic idea of how deep learning models for computer vision work is pretty simple. Consider the problem of finding a white square on a black background. While this is (hopefully) a tremendously easy task for humans, teaching this to a computer might not be immediately obvious. The key idea is to convert the image into a matrix of pixel values, and feeding this into a computer (along with labels for the object of interest), so the computer can learn how groups of pixel values indicate the presence of a certain object.
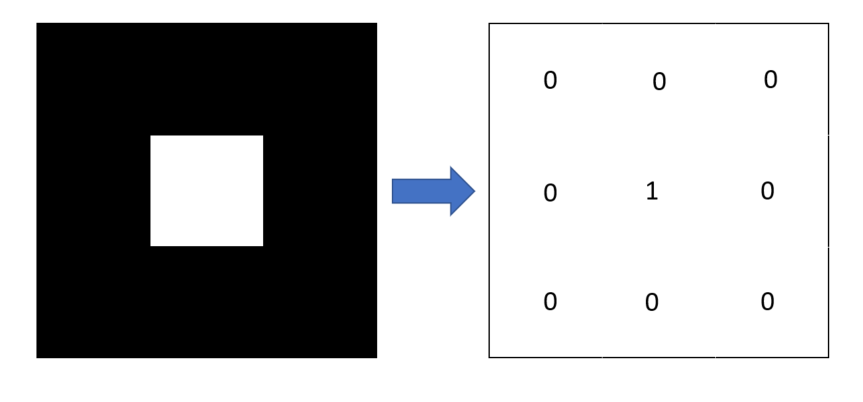
Once the computer has recognized how a cluster of pixel values (a single 1 in the above example) indicates an object, it can generalize this information to new images by converting them to the same kind of pixel value array and looking for similar clusters of pixel values.
The first actual AI model in our pipeline is trained to look for buildings, and so it takes in an input image and returns the boundaries of a polygon that encircles the building footprint (for each building in the image). This model was trained on over 90,000 building footprints and the proprietary Esri world imagery dataset. Architecturally, the model is a Mask RCNN (the traditional object detection RCNN model with additional layers to convert the bounding box to a segmentation mask). The layer structure is pictured below:
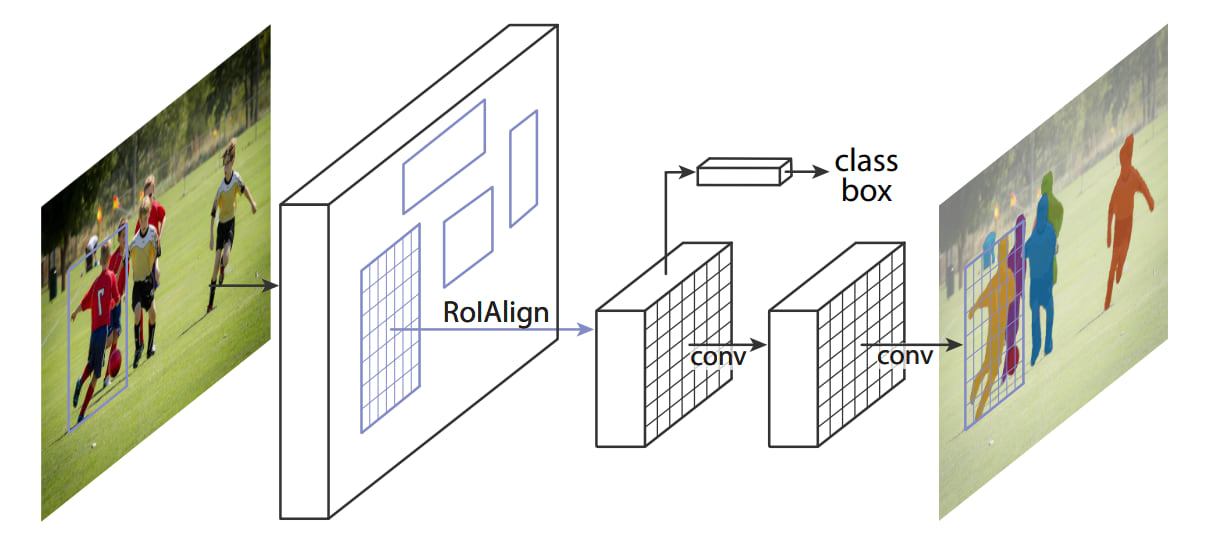
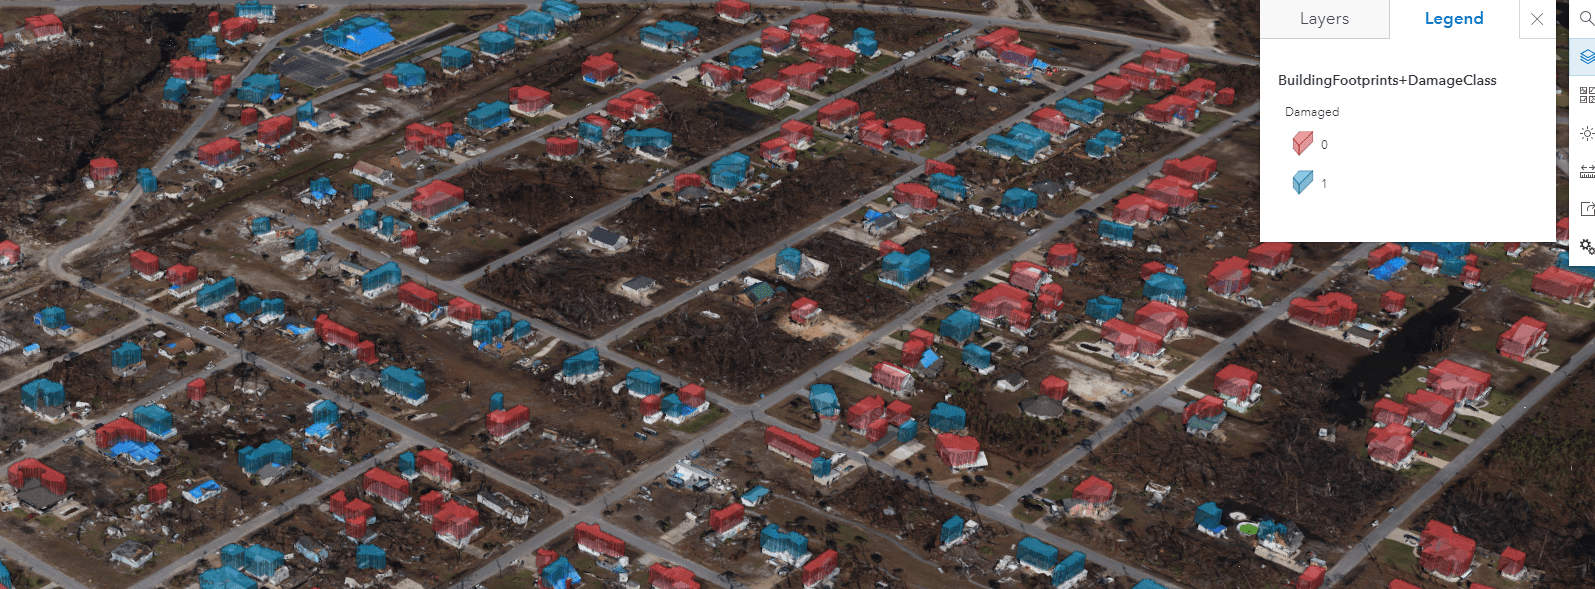
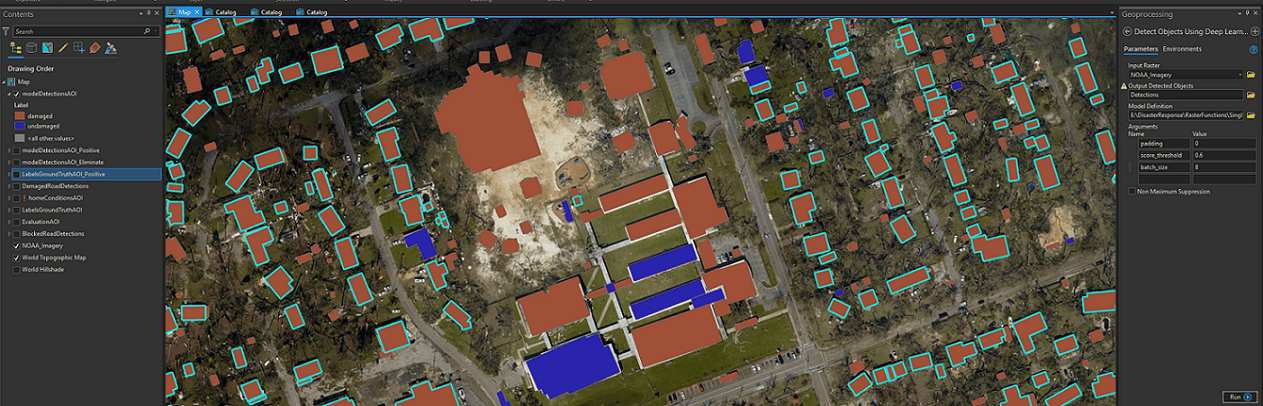
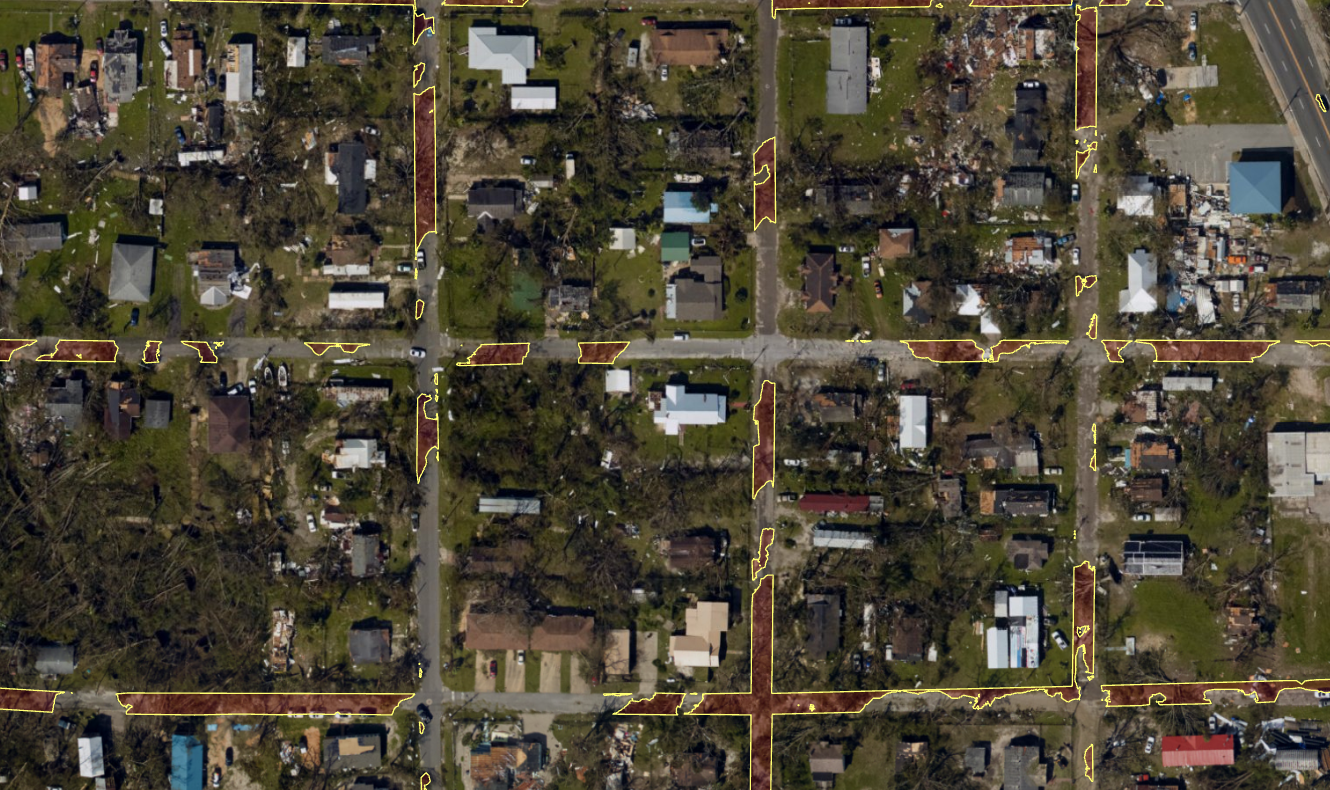
Here’s a screenshot of the first AI model detecting some structures after being run on post Hurricane Michael imagery (note it has never seen this imagery before):
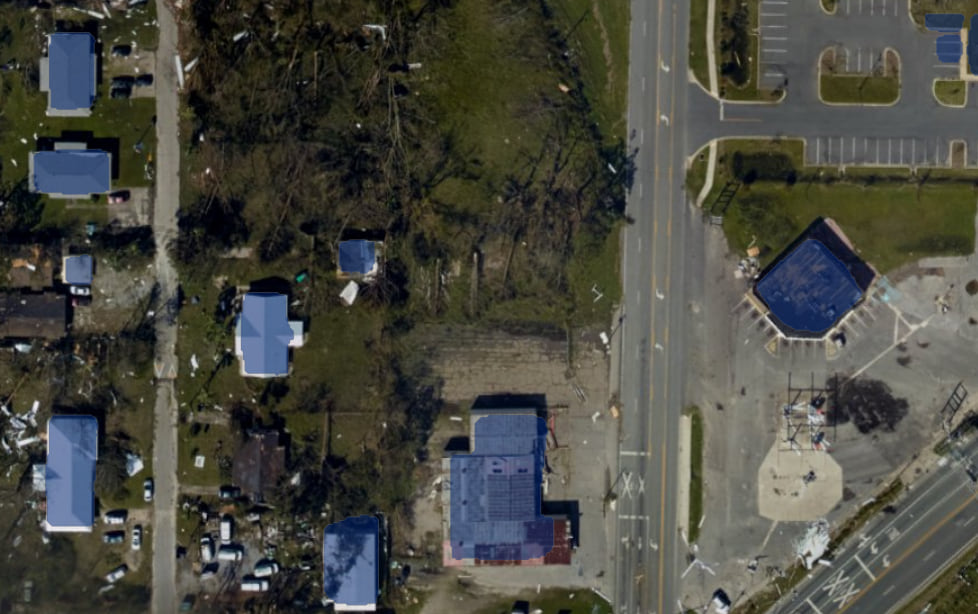
The content of each of the purple footprints will be fed into a secondary AI model, that we will teach to look for damage.
How to Teach an AI: Judging Damage
Now that we have an A.I to identify buildings present in an image, the second task is judging whether or not a building is damaged. Since the first AI model is trained to detect buildings footprints, we unfortunately cannot reuse it easily for this task. We must train a second model to serve as a judge for the buildings extracted by the first. The additional benefit afforded by this modification is the whole system is modular, and the second model can easily be re-trained to judge other attributes about a building (such as age, architectural style, roof type, and anything else visible in an aerial image).
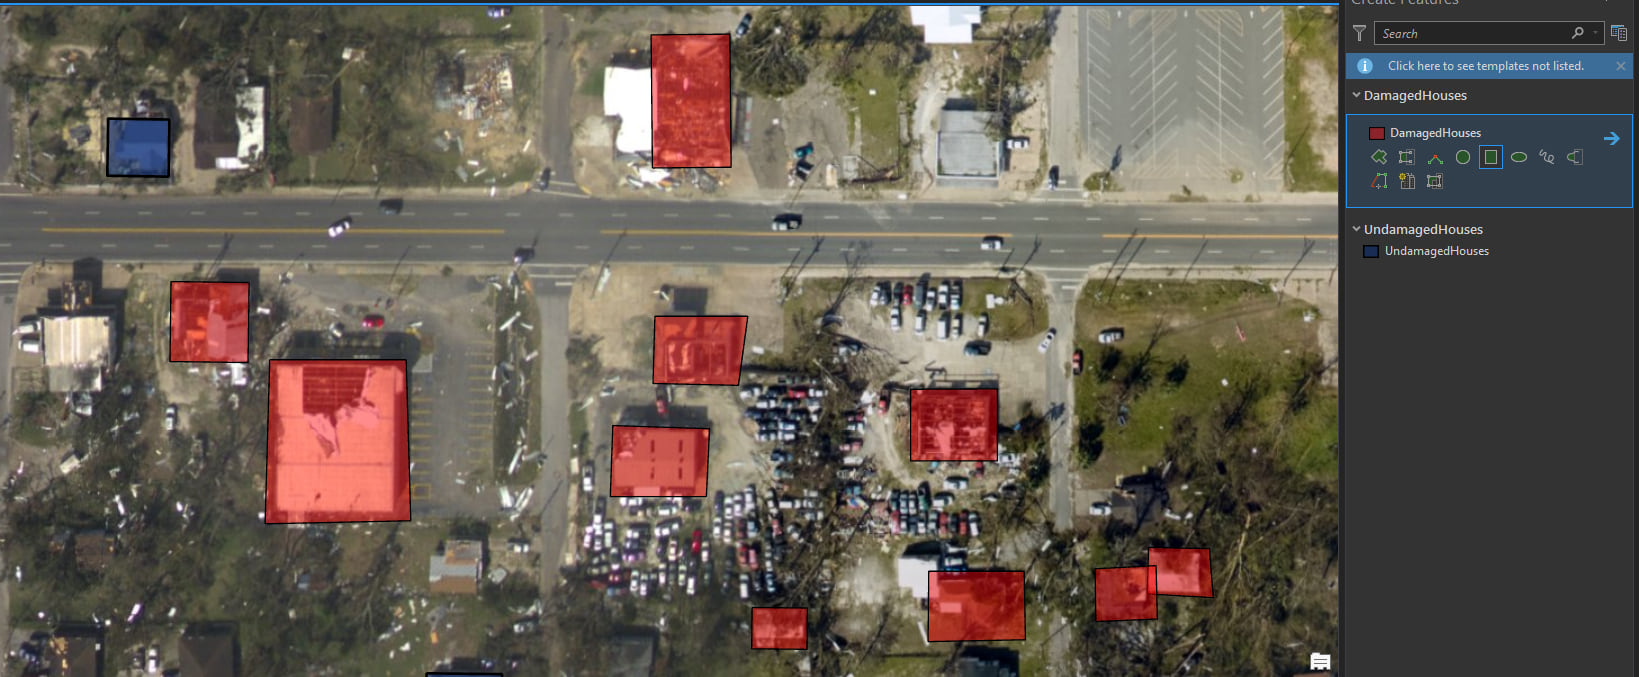
Data on damaged structures is not as readily available or easy to acquire as the building footprints. We get around this problem by creating our own dataset, labeling damaged structures by hand. So, on a particularly slow weekend afternoon, we load the imagery into ArcGIS Pro and start drawing some labels.
Fortunately, creating a set of labeled examples for imagery using Pro is super simple. We can add a Feature Class to our map, then use the Edit tab to literally draw polygons directly onto the image (if we have a ground truth footprints layer, we can also simply add an attribute for damaged). For this project, we opt to create two separate feature classes, one for damaged structures and one for undamaged structures.
When we are done drawing polygons, we can use the Export Training Data for Deep Learning tool to export image chips corresponding to our labeled Feature Class. After the tool finishes, we end up with a folder full of image chips (and associated geo-reference information).
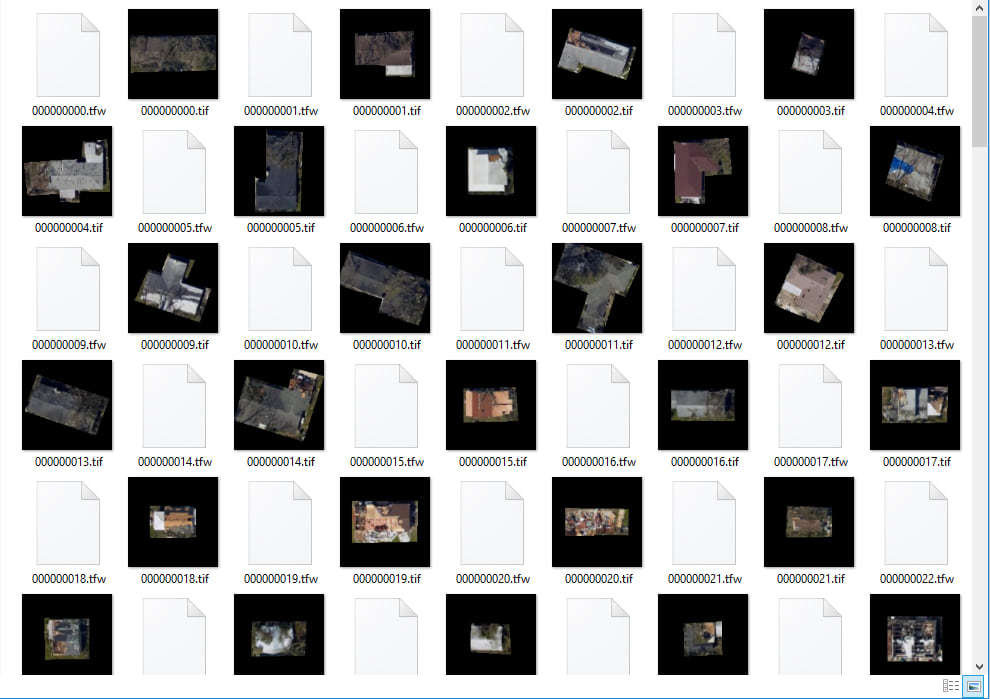
In total, we labeled over a 800 structures (about half damaged and half undamaged) and applied some image augmentation techniques (such as rotations, reflections, blurs) to increase our training dataset by several thousand.
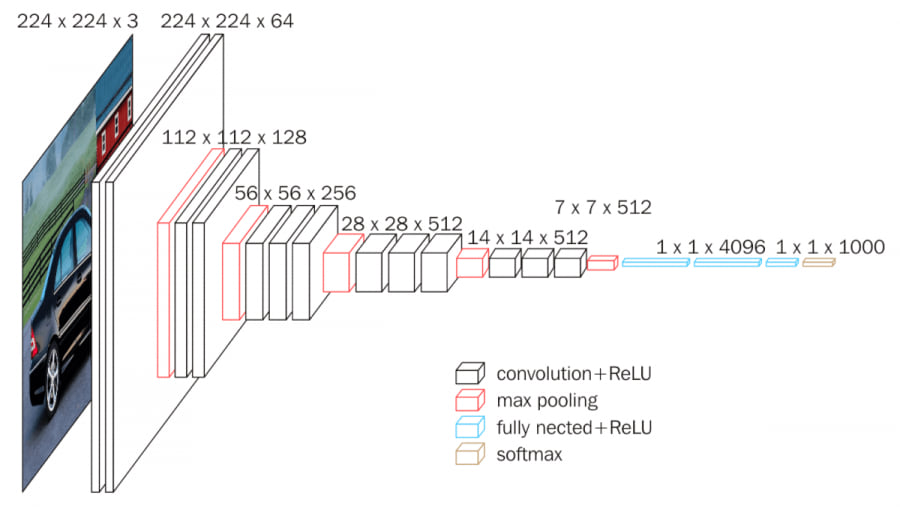
Once we’ve gathered training data for the classification model, we utilize transfer learning to take a VGG-16 model (architecture pictured below) that was trained on the large ImageNet data set and retrain the last few layers to perform classification of structures.
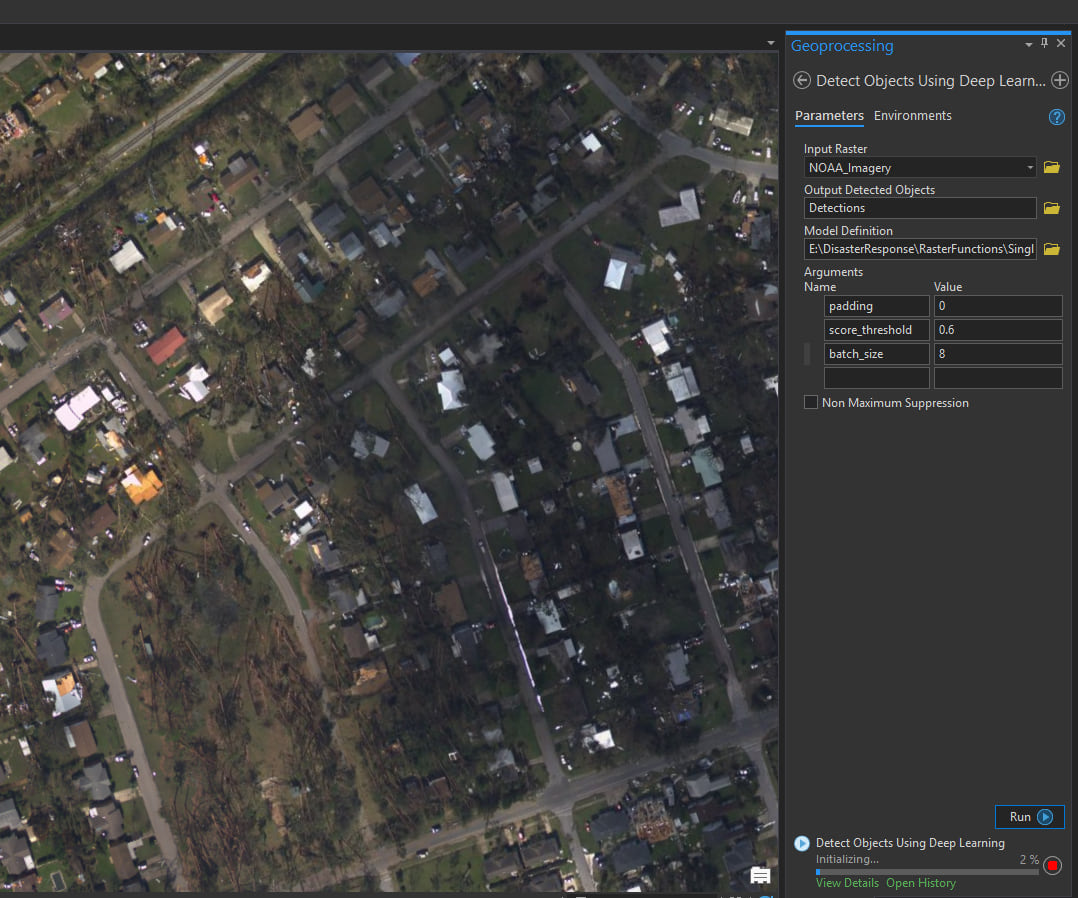
Once this model is trained, we can combine it with the footprint detection model into a single inference function and associated model description file — this allows us to run the entire damaged structure detection workflow via the “Detect Objects Using Deep Learning” tool in ArcGIS Pro. This tool will take in the imagery and model description file and produce a feature layer of detected structures with associated labels.
How to Teach an AI: Judging Road Damage
Roads are the second part of the disaster response picture. While having an idea of scale and location of damaged structures is important, its value is diminished without an idea of how transportation to and from those areas would be achieved. Obviously this is important not only for first responders, but also for the areas’s residents and even utility and insurance companies after initial search and rescue operations have finished.
The difficult portion of this is figuring out the proper way to even feed this information into a deep learning model to train with. Do we label debris and teach a model to detect it? Do we create image chips of road and teach a model to classify each chip as blocked/unblocked? Do we feed the entire road network into a model and train it to label each pixel of road as debris/clear?
In the end, we opted for the third approach. Such a task (of classifying each pixel of an image into a class) is called semantic segmentation. From the finished model, we expect to get an output raster of roadways that are colored based on whether or not a road is blocked because of debris/damage.
At this point we had the road layer itself, the underlying imagery, and a plan for what kind of model for road damage we were going to build. But something was still missing, and after a few coffees we realized we didn’t have any corresponding labels for the roads.
We could do the same thing we did for the structures and manually label them (sigh). But we decided to utilize some of the great shareable apps available within the Esri ecosystem and our vast network of colleagues who had explicitly or inadvertently volunteered to help out us out with projects instead!
Crowd-sourcing AI
One of the hardest parts of AI is getting a hold of good, labeled data. This still involves large amounts of manual and repetitive human labor, the kind that would drive a single person insane. We can utilize the power of crowdsourcing to obtain labels for our data in a quick and efficient way by dividing up the task of labeling among a large group of individuals via an easy to use web labeling app.

We set up the above web app in only a few hours using the web app builder that allows users to simply click one of the roads and label it as “passable”, “impassable due to damage”, or “impassable due to debris”. This web app can be accessed directly via a URL so it was easy to share among everyone who wanted to help.
We even added a “scoreboard” to encourage some healthy competition!
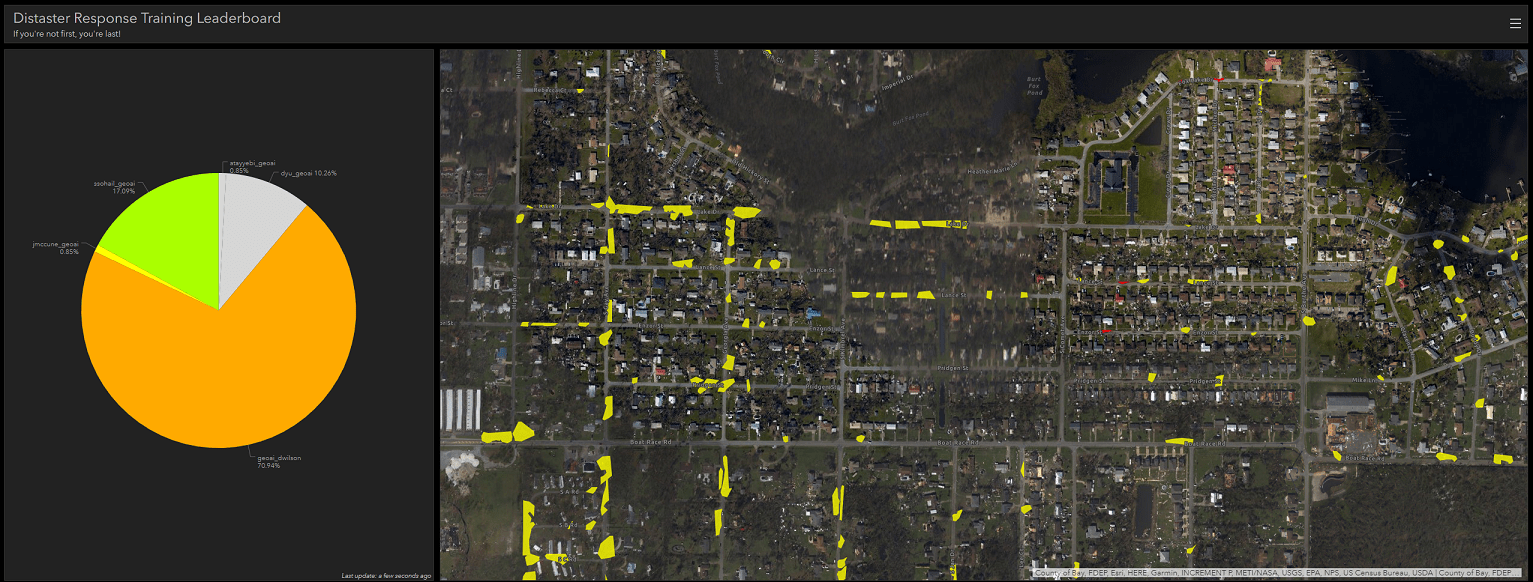
We ended up labeling over 1,000 areas of debris in just a single day (with me being responsible for less then 20%)!
We can now easily pull this labeled data back into ArcGIS Pro as a feature class and use the Export Training Data for Deep Learning tool again to acquire image chips labeled at a pixel level to train our semantic segmentation deep learning model. For the model itself we utilize the U-Net architecture. Here’s a comparison of some of the model’s outputs for an area unseen during training (outlined polygons indicate detected debris):
Optimizing Routing
Now that we have the locations of the damaged structures and blocked roads, we are faced with the task of turning this into actionable intelligence. This is an often overlooked part of building A.I models — usability in the field. The natural next step in disaster relief after having the locations of damaged structures and blocked roads is actually having responders deployed to each of the structures and reporting back what they find. The critical part of this is being able to build an optimal route, the quickest way to reach every structure while avoiding roads that are impassable. Mathematically, this problem can be represented by a weighted graph — where the edge weights represent the distances from one point to another. We also need a start node, where the deployed responders will start and end their route.
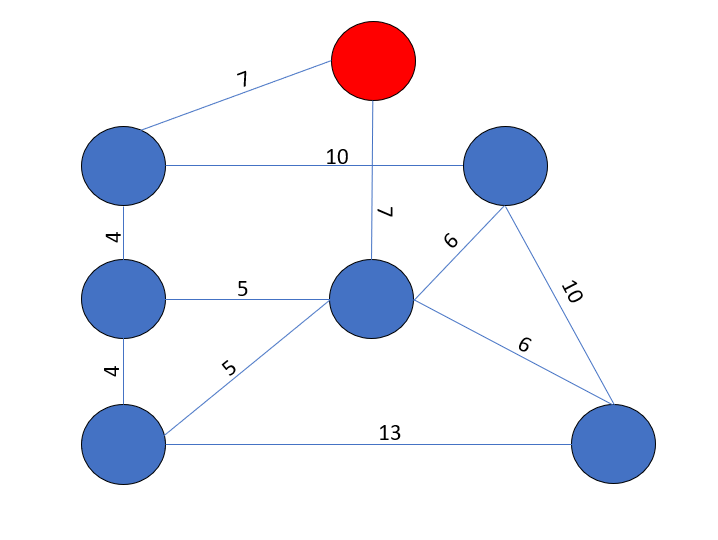
You can try and find the shortest route from and back to the red node in the above example and quickly realize that this can be quite a difficult problem. In fact, the problem is NP-hard, and given a particular route there is no quick check to know if it is indeed the shortest route or not.
Luckily for us, the frequency with which this problem is encountered in the real world has led to a number of very effective and practical algorithms for finding good routes. In fact, the network analyst extension in ArcGIS contains methods for solving this exact problem, honed through many decades of development and research (you can read about it here). This works well for us because we can simply modify our predictions a bit to generate feature layers in ArcGIS Pro, from where we can directly apply the extension to find optimal routes.
Where the Rubber Meets the Road
At this point we have the post disaster imagery, an underlying feature layer representing damaged structures (output from the first+second model), a feature layer representing blocked/damaged/passable roads (output from the third model), and a tool to build an optimal route to damaged structures from a designated start point and taking into account damaged roads. We can pull all this information into ArcGIS Pro and utilize a combination of ArcGIS Online and web apps to help disseminate this information quickly.
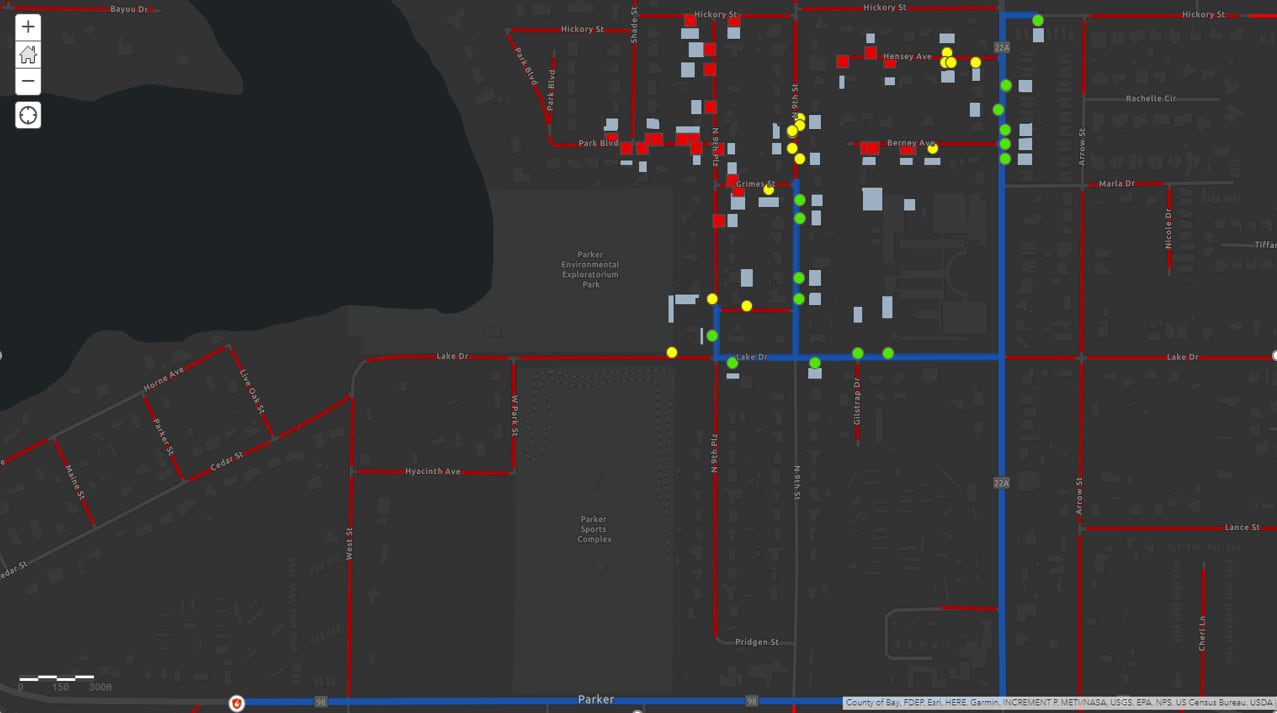
First, we build a live operations dashboard showing the current count of blocked roads and damaged roads for an area. This dashboard also shows the damaged structures that need to be addressed (as red polygons).

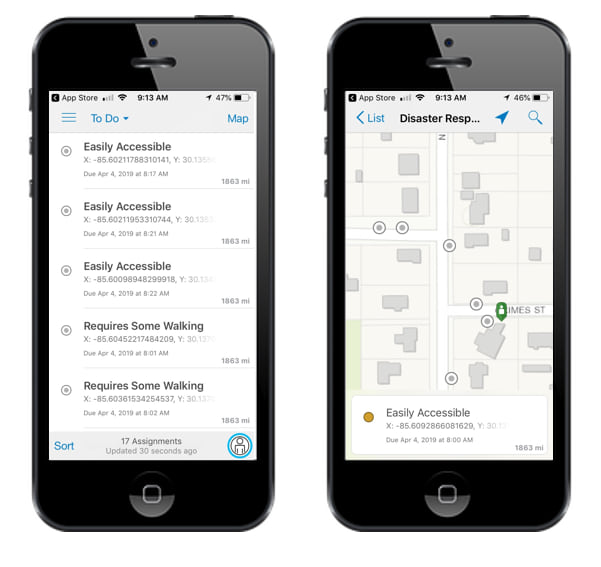
Secondly, we build integration into ArcGIS Workforce, so that first responders or workers can receive personalized routes and make updates to recovery status directly from their phones (this will automatically update the central dashboard showing the currently addressed structures and remaining ones). You can even see a single worker utilizing workforce in the dashboard above as a green person icon, currently addressing the structure near the center of the map.
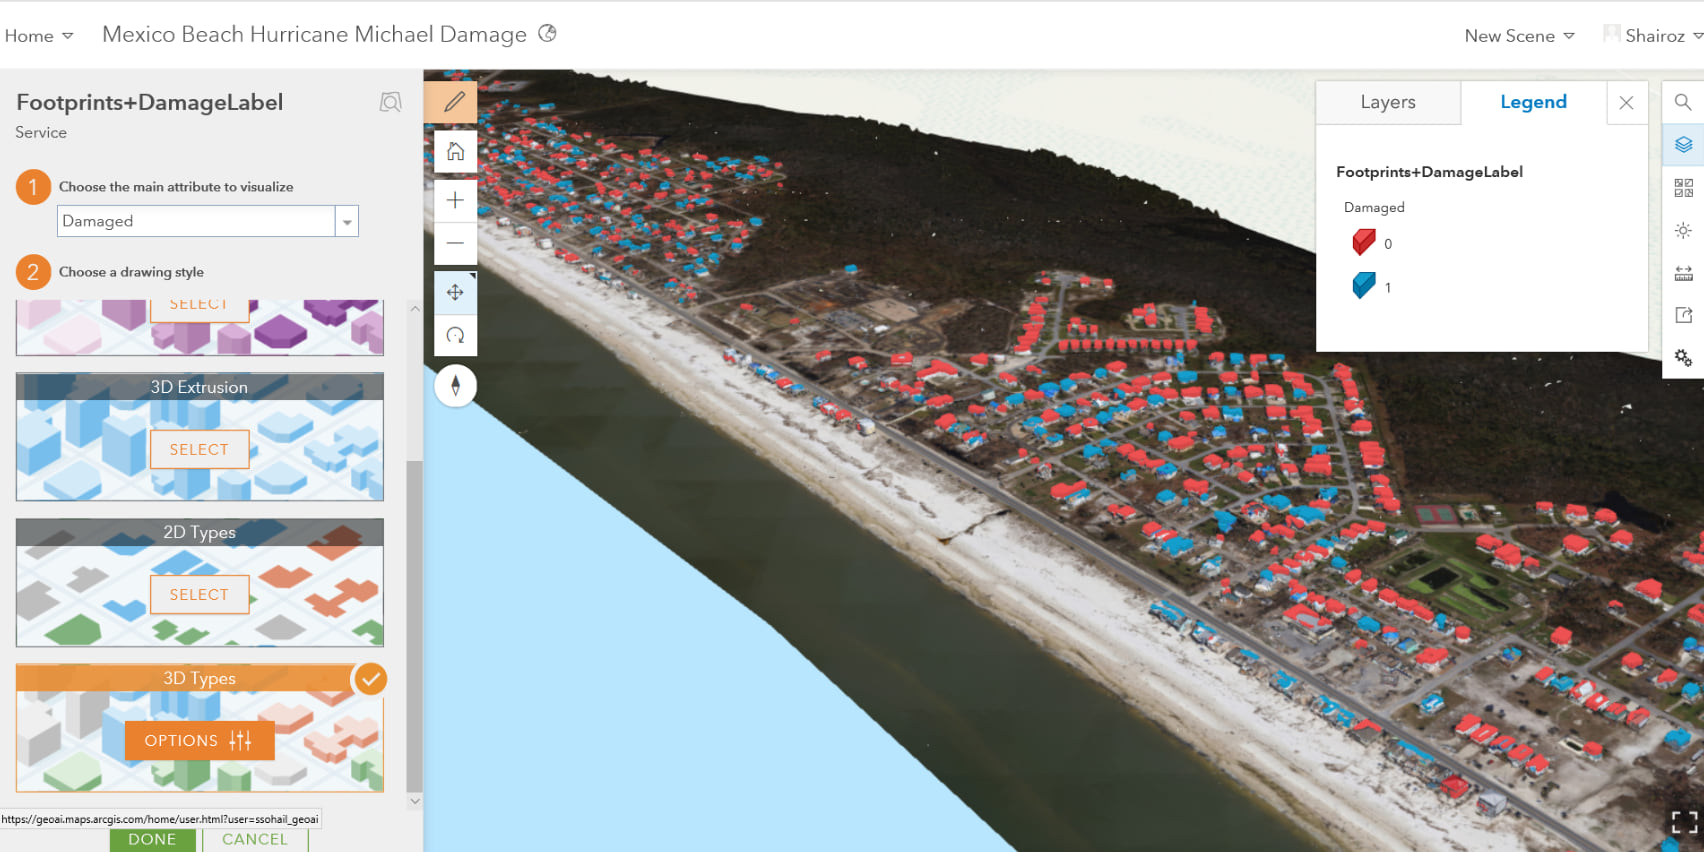
Integrating 3D Scenes
There’s nothing quite like a full browsable 3D scene for operational awareness. While from the work we’ve developed so far we understand where damage is located (and this is enough to deploy first responders efficiently in most cases), we’d like to also understand what type of structures are damaged so we can better equip our first responders. This can really only be done with a full reconstruction of the area – normally a very time and labor intensive procedure.
Luckily, Esri’s Drone2Map provides amazing capabilities to build 3D reconstructions from collections of aerial imagery. These 3D reconstructions are fully integrated into the Esri platform via scene layers, allowing us to pull in our AI model outputs and give a truly informative view of the ground-level destruction caused by the hurricane.
Follow-up
This is a continually evolving project with our team and we are currently piloting with some large clients. If you’d like to implement this with your organization (or just get an update about the latest development efforts) feel free to email ssohail@esri.com. We are especially interested in building this capability up for additional disaster types (fires, floods, earthquakes etc.) and additional global regions.
This project and other projects from the GeoAI team (available here) aim to use the intersection of GIS and cutting-edge artificial intelligence methods to bring about positive change in the world. The Storymap for this project is available here, and the Hub page available here.
Thank you for reading!
Commenting is not enabled for this article.