Gas, water, and electric utility users will be excited to see new Utility Network functionality in ArcGIS Enterprise 11.3. These enhancements allow for viewing, understanding, and analyzing utility assets. This post includes details on the available tools and how they work on the web.
Before we do that, let’s discuss the two different ways to configure maps to work with utility networks – with Map Viewer and with ArcGIS Pro.
Configuring Utility Network Maps in Map Viewer
As a quick refresher for those not yet acquainted with utility networks on the web, this section outlines the basic steps to enable utility networks and their associated tools in the Map Viewer.
To get started, add your utility network to a map. After adding a feature service with a utility network, access the Map Properties from the left toolbar. Open the drop-down titled Utility Networks and click the plus/add button to load the utility network from the feature service into the map.
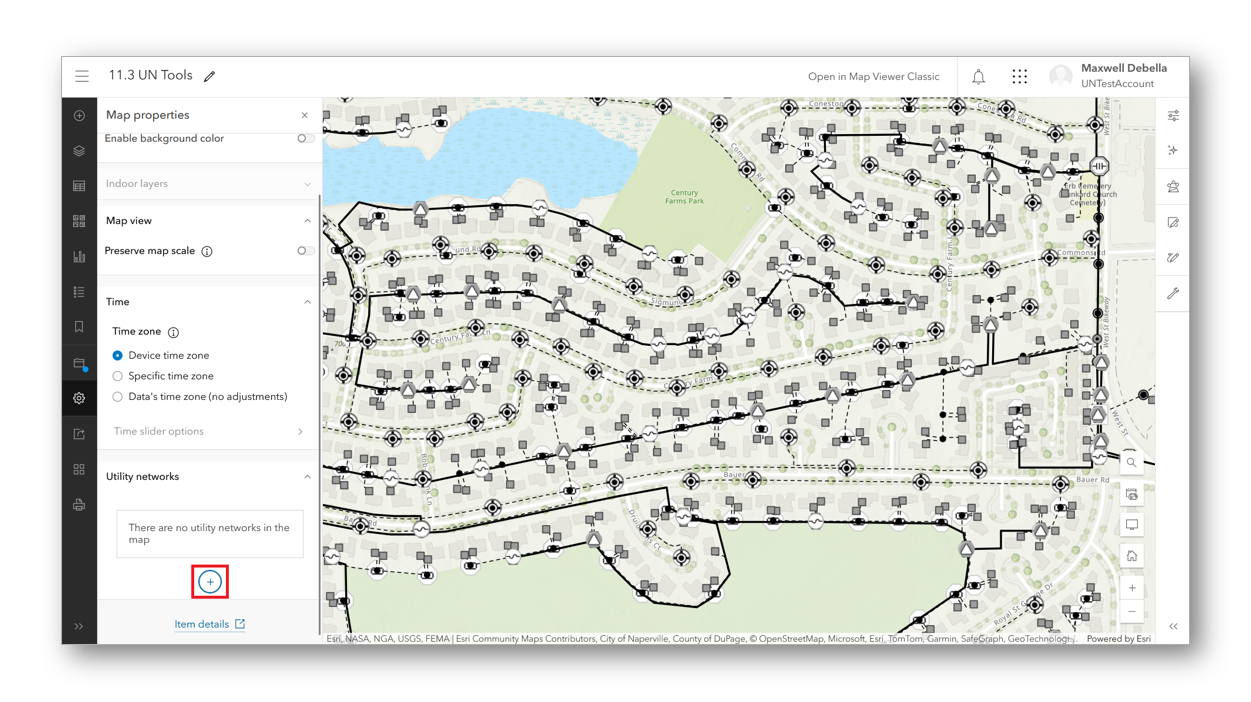
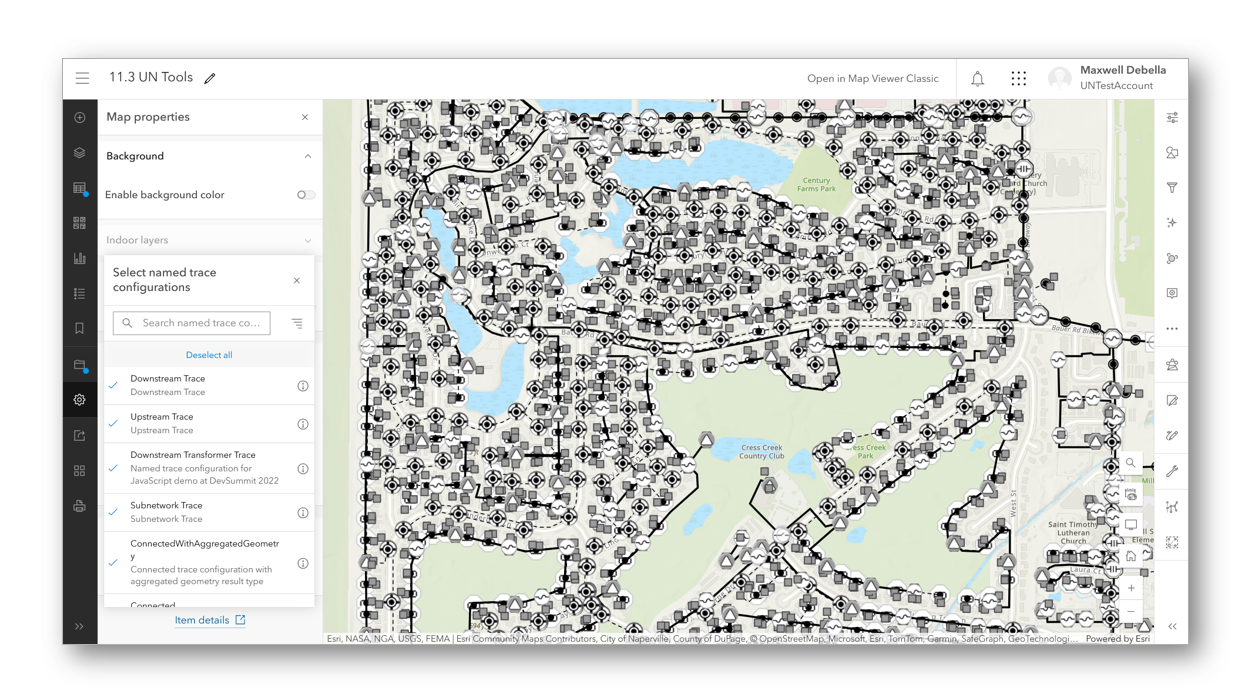
To set up a map for utility network tracing, you must first configure the traces.
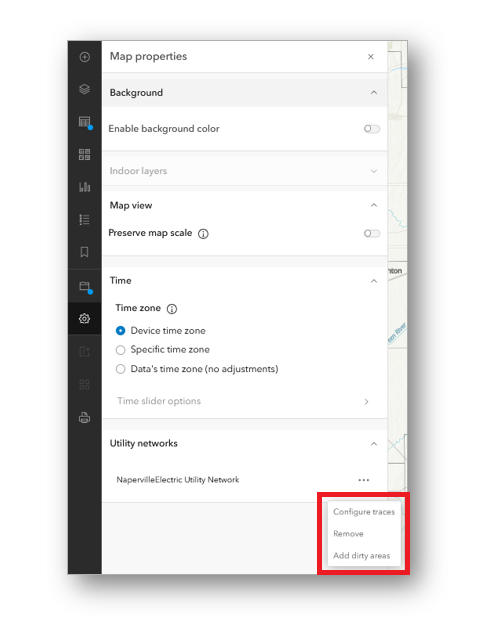
Click the three dots next to the utility network in the Map Properties pane. A drop-down will appear with options: Configure traces, Remove, and Add dirty areas. Click Configure traces from the pop-over, then select the named trace configurations to use in the Utility Network Trace tool. If you haven’t set them up already, named trace configurations are defined using geoprocessing tools in ArcGIS Pro. (Note that when adding traces in ArcGIS Pro, you do not need to republish your service or recreate your map.)
If you want to display utility network dirty areas in your map, go back and select the Add dirty areas option.
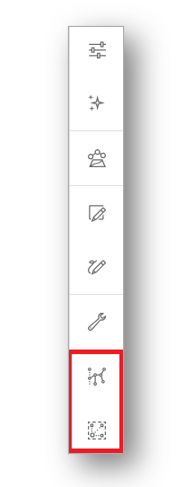
After configuring the map, you should see the two new tools on the right toolbar.
Configuring Utility Network Maps in ArcGIS Pro
Maps from ArcGIS Pro can be published to your portal as web maps. First, make sure the utility network is present in a map.
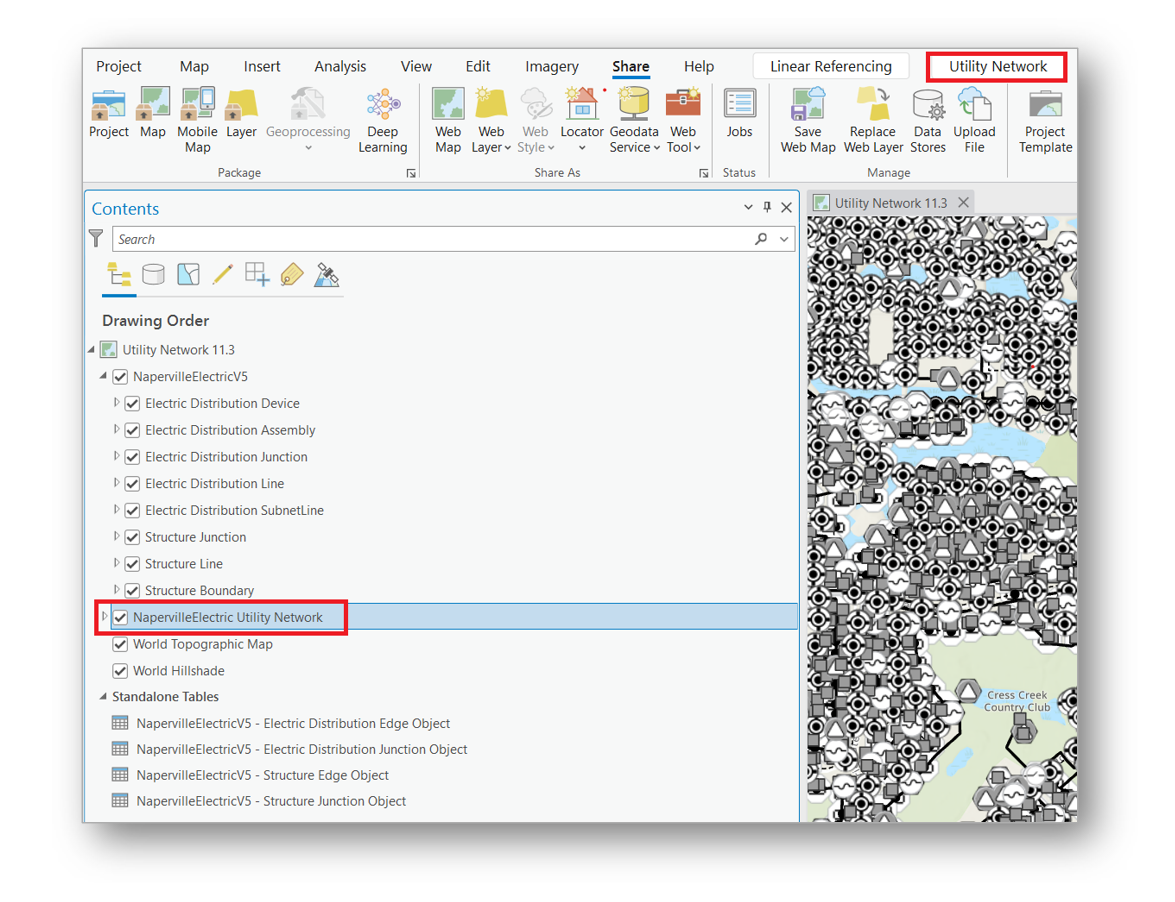
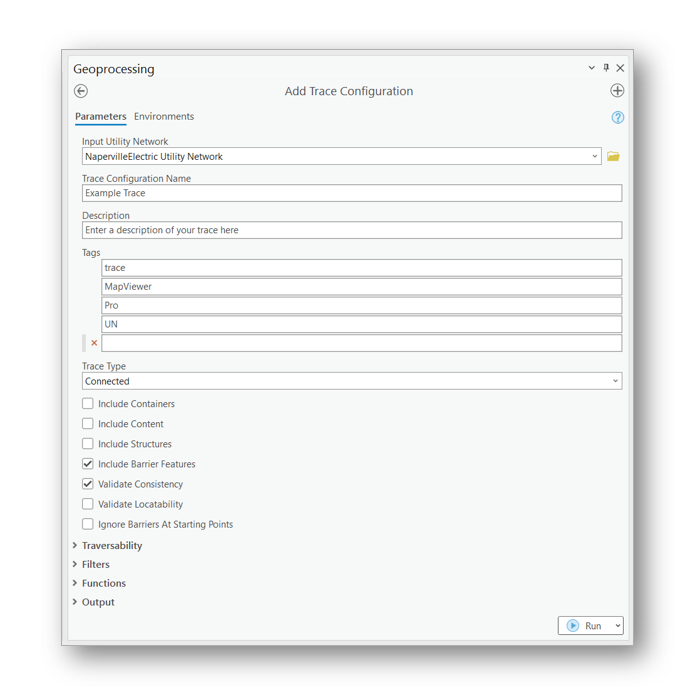
If you wish to use the map for tracing in Map Viewer, use the dialog box launcher in the Utility Network contextual tab to bring up the tracing configuration dialog. If you haven’t yet defined named trace configuration on this service, you can use a set of geoprocessing tools to do so. They will then show up in the configuration dialog. Check the ones you want to use with the map.
Finally, use the sharing tab to publish your web map to your ArcGIS Enterprise portal.

Utility Network View Associations
Associations allow for modeling connectivity, containment, and structural attachments between assets in a network. The Utility Network View Associations tool provides valuable insights into connectivity and structural attachment associations. This section will explain how to use the Utility Network View Associations tool. For more details on associations, refer to our documentation here.
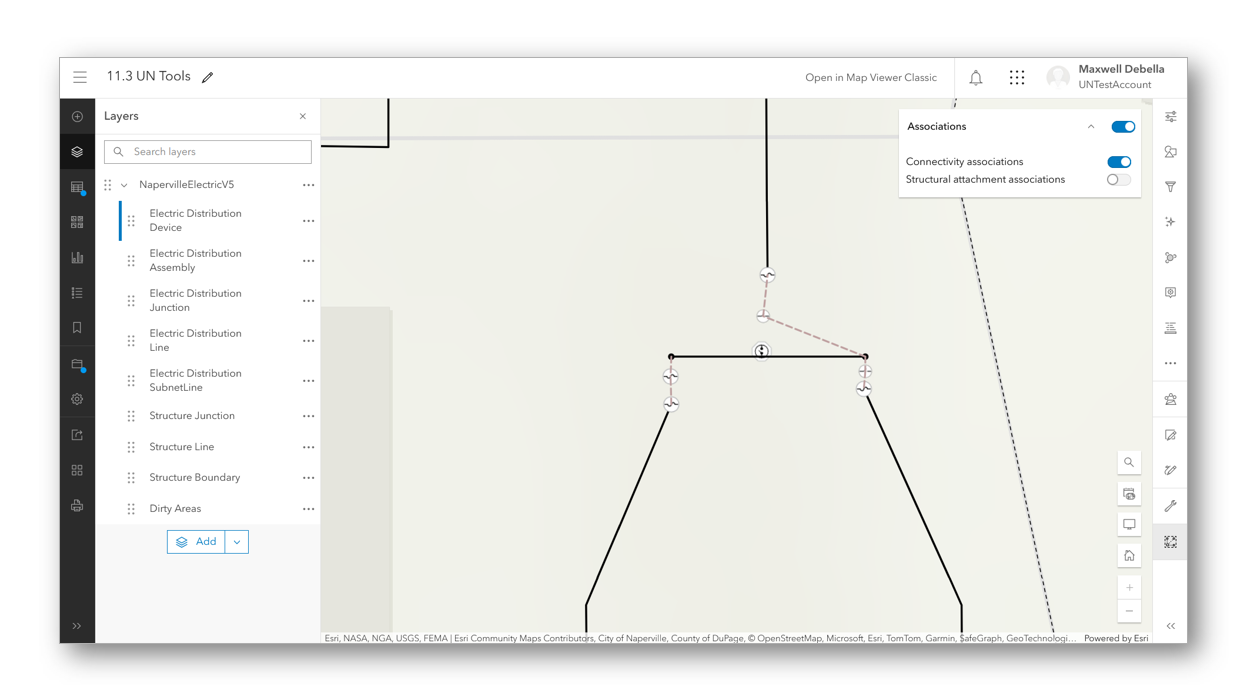
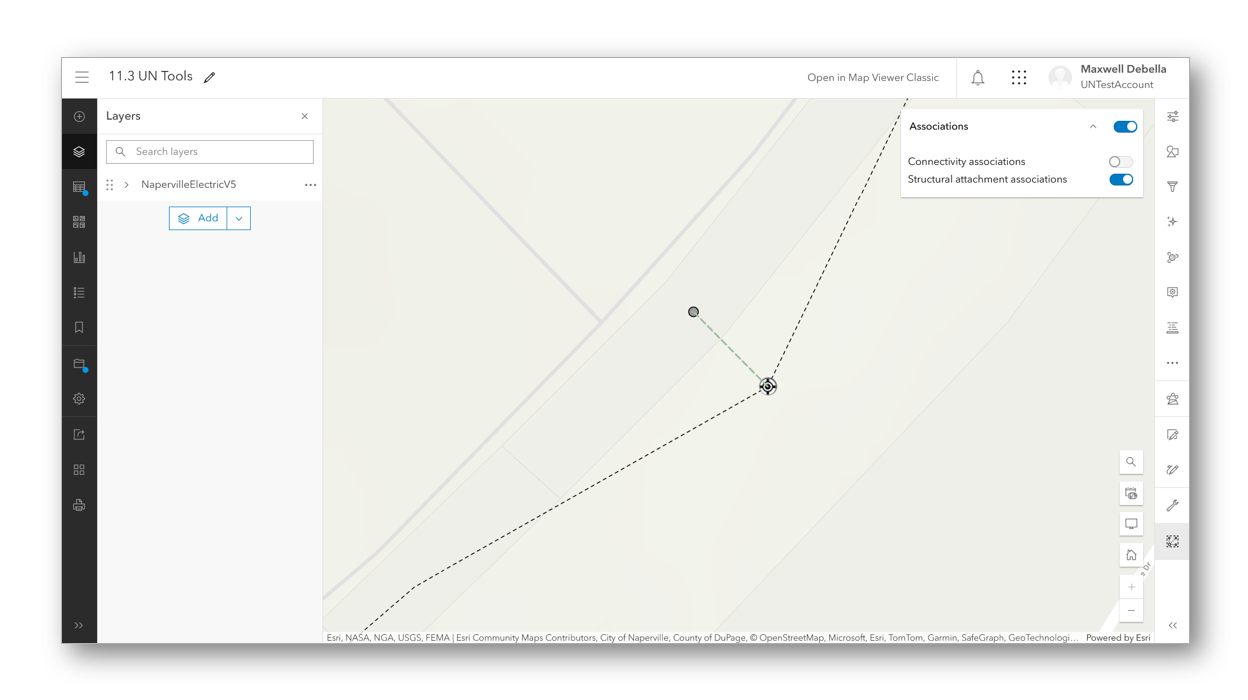
First, open the tool on the right toolbar. After opening the tool, enable viewing the associations by toggling the switch. If you zoom out too far (at a smaller scale), a warning will inform you to zoom in to see the associations. If your initial scale is appropriate, you will see both connectivity and structural attachment associations by default. Connectivity associations appear in pink, while structural associations are shown in green.
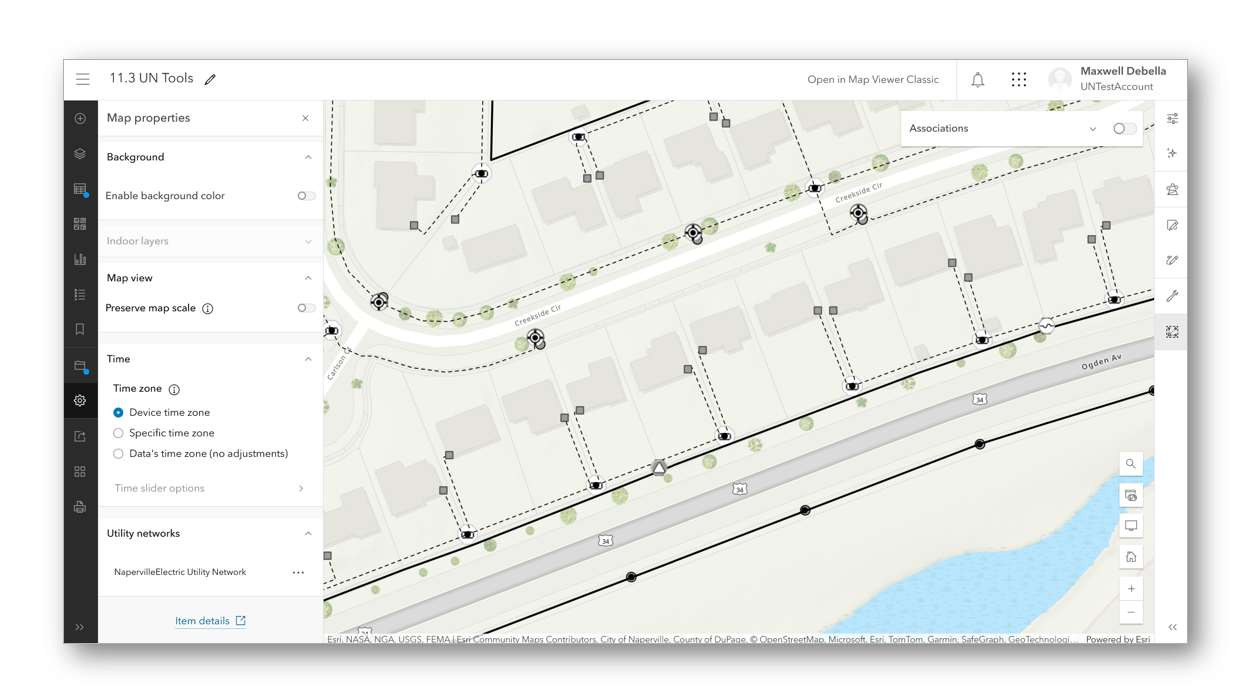
You can toggle both types of associations on and off by clicking the down arrow to the left of the toggle switch.
Connectivity Associations
Structural Attachment Associations
Keep in mind that the tool’s status does not persist after closing the interface. This includes opening any other tool on the right toolbar or saving the map. Any time you close the interface, the tool will revert to its default setting.
Utility Network Trace
Traces offer the ability to analyze and optimize how resources flow throughout a utility network. They begin at a specified starting location and gather data as they traverse the network. You can store traces in a utility network service as named trace configurations, which can further be reused throughout an organization. The Utility Network Trace tool runs a selected trace configuration on a network and returns valuable data to you via the tool’s interface.
To use the Utility Network Trace, first select the Trace configurations. Once you choose those configurations, the tool will display on the right toolbar. To start running a trace, select the tool.
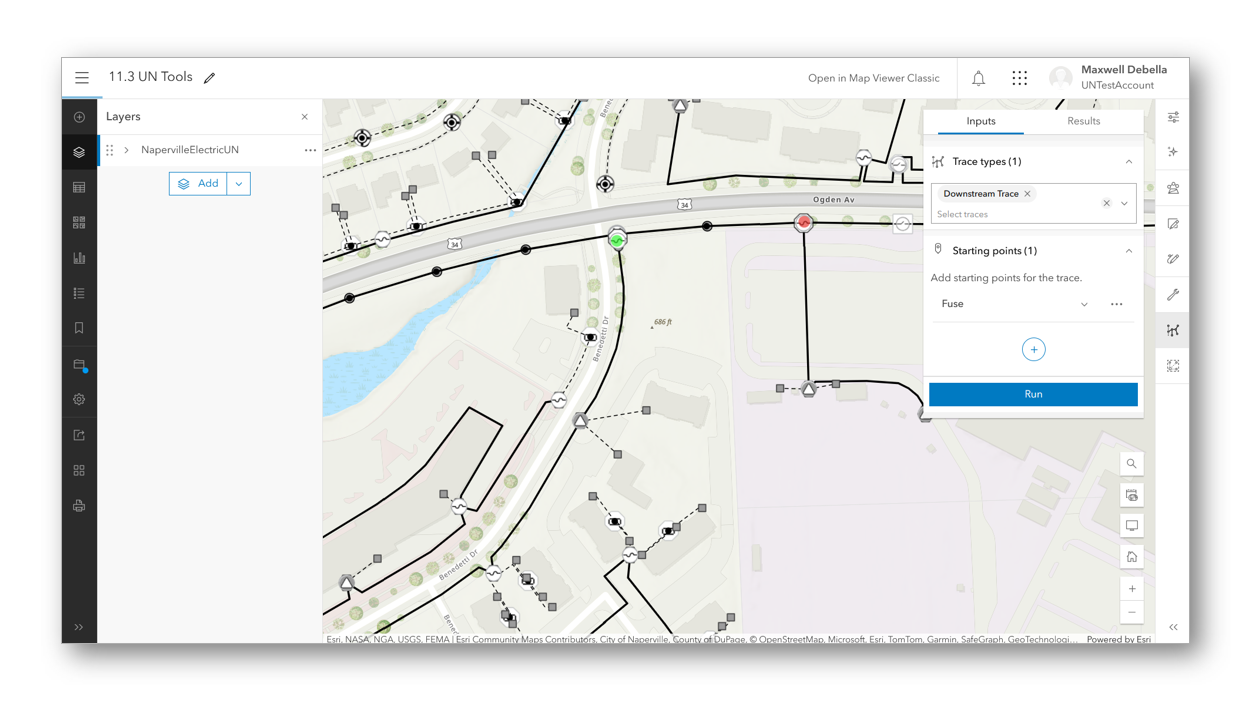
With the interface open, choose the trace you wish to run from the drop-down menu. After selecting the trace, choose your starting point, which will serve as the origin of the trace. You can select multiple starting points, but at least one is required to run a trace. You can also set barriers to create stoppage points. With the trace and a starting point set, click Run to highlight the relationships and collect data.
After running the trace, the tool will return records containing all the features captured in the trace. If the chosen trace configuration has functions authored on it, you will also access the results of those functions alongside any records. Below the data section of the trace results, you can toggle Graphics on or off. By default, the graphics color is yellow. You can clear the results or return to the trace settings to add or update your trace for another run.
This concludes this guide on using the new utility network tools in ArcGIS Enterprise 11.3. For other relevant information regarding utility networks, please see the related links list below. Stay tuned for more utility network support coming to Map Viewer!
Commenting is not enabled for this article.