As commercial imagery has become more accessible, its role in geospatial workflows has significantly expanded. ArcGIS harnesses powerful geospatial AI (GeoAI) capabilities that when combined with imagery, can transform pixels into valuable insights and unlock a new era of understanding. One common application of this is object detection, a crucial process in defense and intelligence agencies. This process is often time and resource intensive as it is typically done manually by an analyst who identifies and labels each object.
To ease this burden, we can turn to GeoAI, a concept that brings together artificial intelligence and geospatial science. Using GeoAI we can accelerate the speed at which we extract insights, develop understanding, and ultimately drive action. To test the scalability and power of the ArcGIS system, this workflow will cover how we automated the detection and classification of grounded aircraft for the entire state of California, daily.
Deep Learning Models
In addition to imagery, one of the key components to applying GeoAI is the model being used. Esri’s Living Atlas provides over 75 pretrained models for you to utilize. From building footprint extraction to land cover classification, we can pair these models with deep learning geoprocessing tools to aid in imagery exploitation. These models can also be pulled into your own ArcGIS organization in ArcGIS Online or ArcGIS Enterprise.
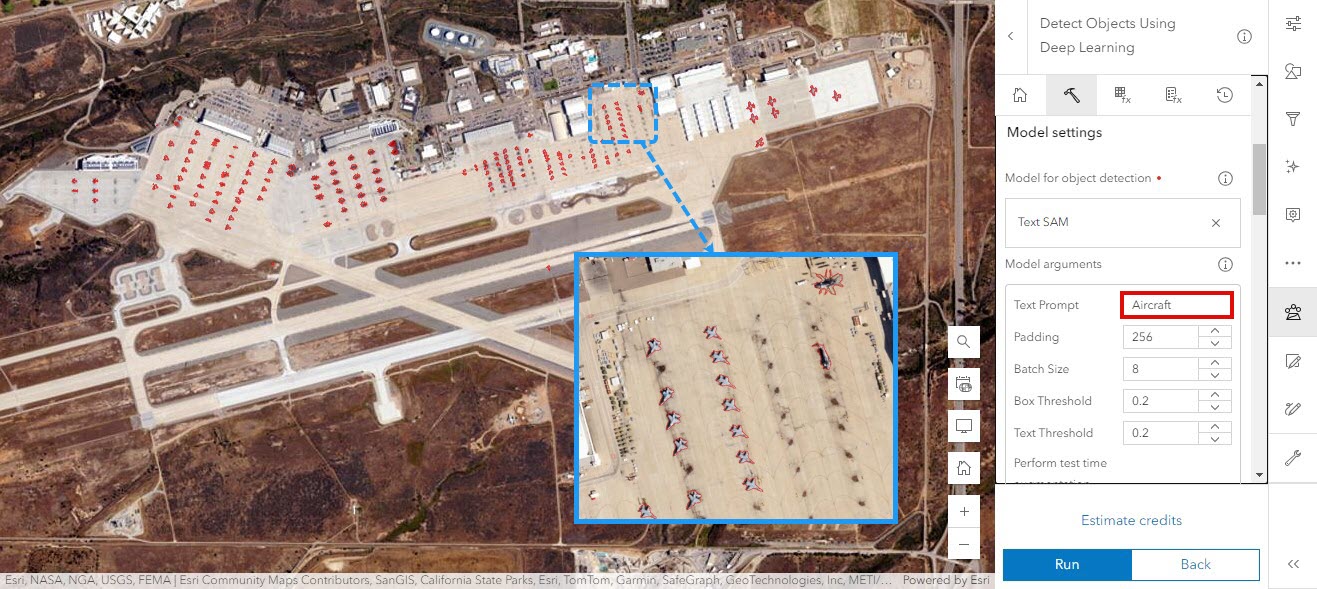
An aircraft detection model in not yet available in the Living Atlas, so we used one of Esri’s newest models, Text SAM, to meet our needs. Text SAM is an open-source vision language model created by using Grounding DINO and Meta’s Segment Anything Model (SAM). With the help of Grounding DINO, we can use natural language text prompts to extract specific objects from our imagery. When partnering this model with the Detect Objects Using Deep Learning geoprocessing tool, we can segment out specific objects and get as descriptive as typing in “red cars” or in this case “aircraft” into the text prompt parameter.
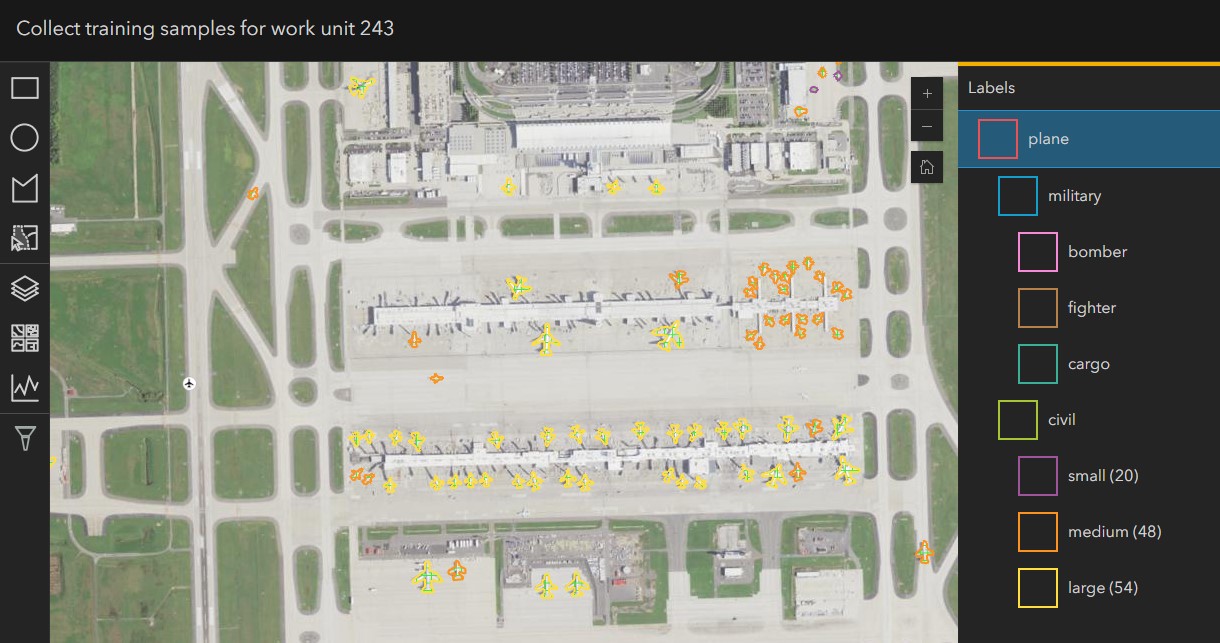
To gain deeper insight into the type of aircraft being detected, we used ArcGIS Deep Learning Studio to create a custom model that not only detects aircraft but also classifies them too. Deep Learning Studio is a web application that enables a project-based collaborative environment for users to collect training samples, train deep learning models, and run inferencing in a scalable Enterprise environment.
With this application, we can create models that will classify and detect any object we train it to recognize. In this case, we trained a model to not only detect aircraft but also categorize each one as either military or civilian, with further subcategories to refine the classification. Once we collected sufficient training data and were satisfied with our model’s performance in Deep Learning Studio, we could run inferencing each day.
Building Statistics
Creating detections is often just one part of the larger puzzle when it comes to spatial analysis. We wanted to take it a step further by gaining deeper insights into our detections, such as determining if they occurred in expected areas or identifying any increases in detections at specific locations. Since airports are the most probable sites for aircraft detections, we created geofences around each major airport in California. This enabled us to better monitor activity from day to day and investigate any detections outside any known areas. With this daily analysis, we could begin to build statistics and understand what the average count for each airport looked like.
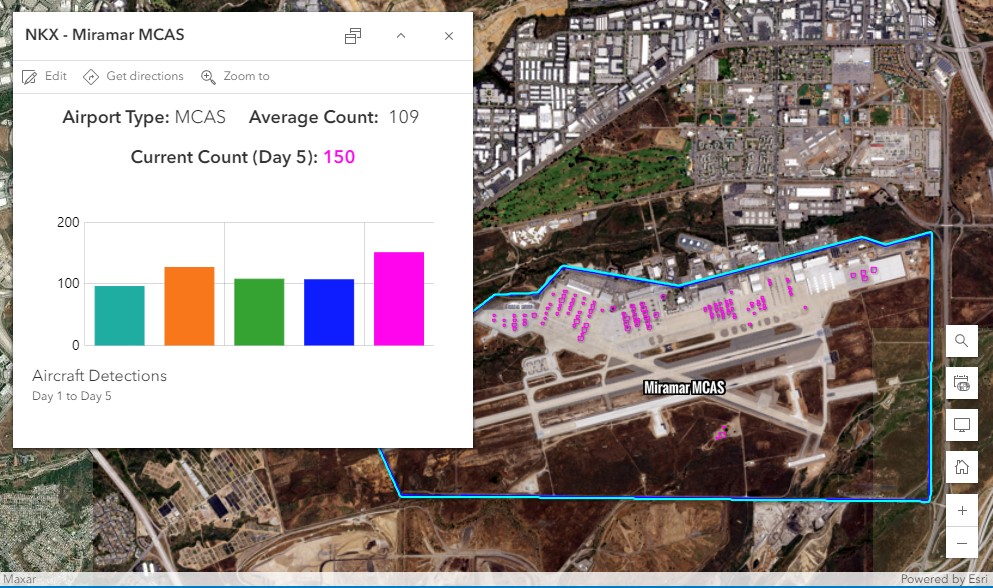
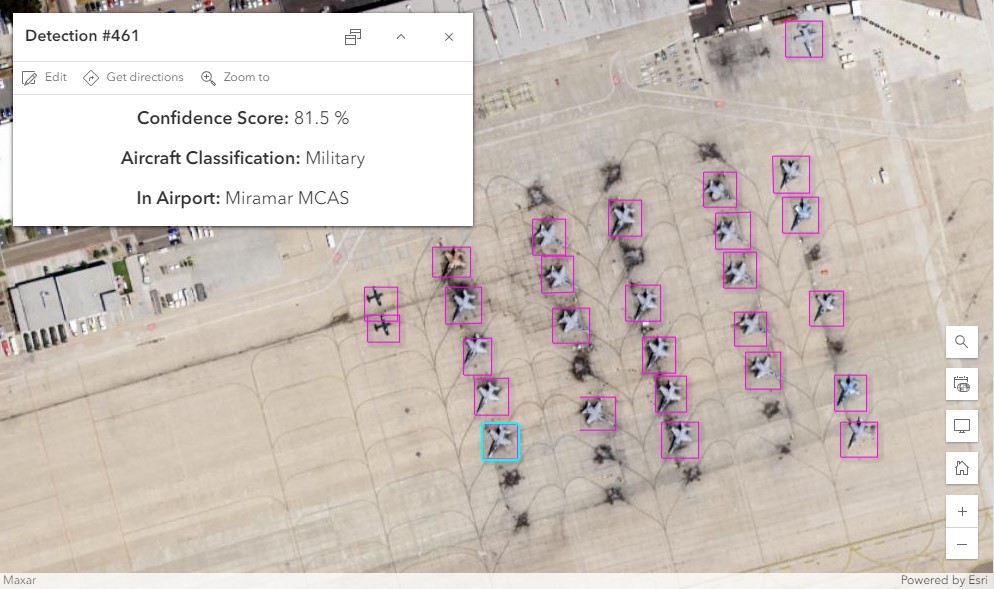
With the airport geofences created, we could also enrich each detection by adding a field to show what airport it resided in. In addition to this, the plane classification and confidence score provided by our model are recorded as attributes for each aircraft detection.
Automating our Workflow
Although we could kick off the inferencing process manually each day, we instead leveraged an ArcGIS Notebook to automate the inferencing and analysis. The notebook runs the detect objects geoprocessing tool against the imagery for that day, does any necessary spatial analytics, then updates both our airport and aircraft detection layer with supporting attributes from our analysis.
It is important to know when major changes are found from one day to the next. Because we are monitoring such a large area, we wanted to be alerted only when one of the following conditions was met:
- The number of detections at each airport were far below or above average
- The number of detections outside known areas (airports) had changed.
To accomplish this, a webhook was configured. Webhooks are user-defined HTTP callbacks that send data between applications in real-time based on specific trigger events. In our case, we set up a webhook to monitor our feature layers, with the trigger being any time the layer was updated. Once triggered, the webhook would run an ArcGIS Notebook to check for significant changes in detection counts and send an email alert if any were found.
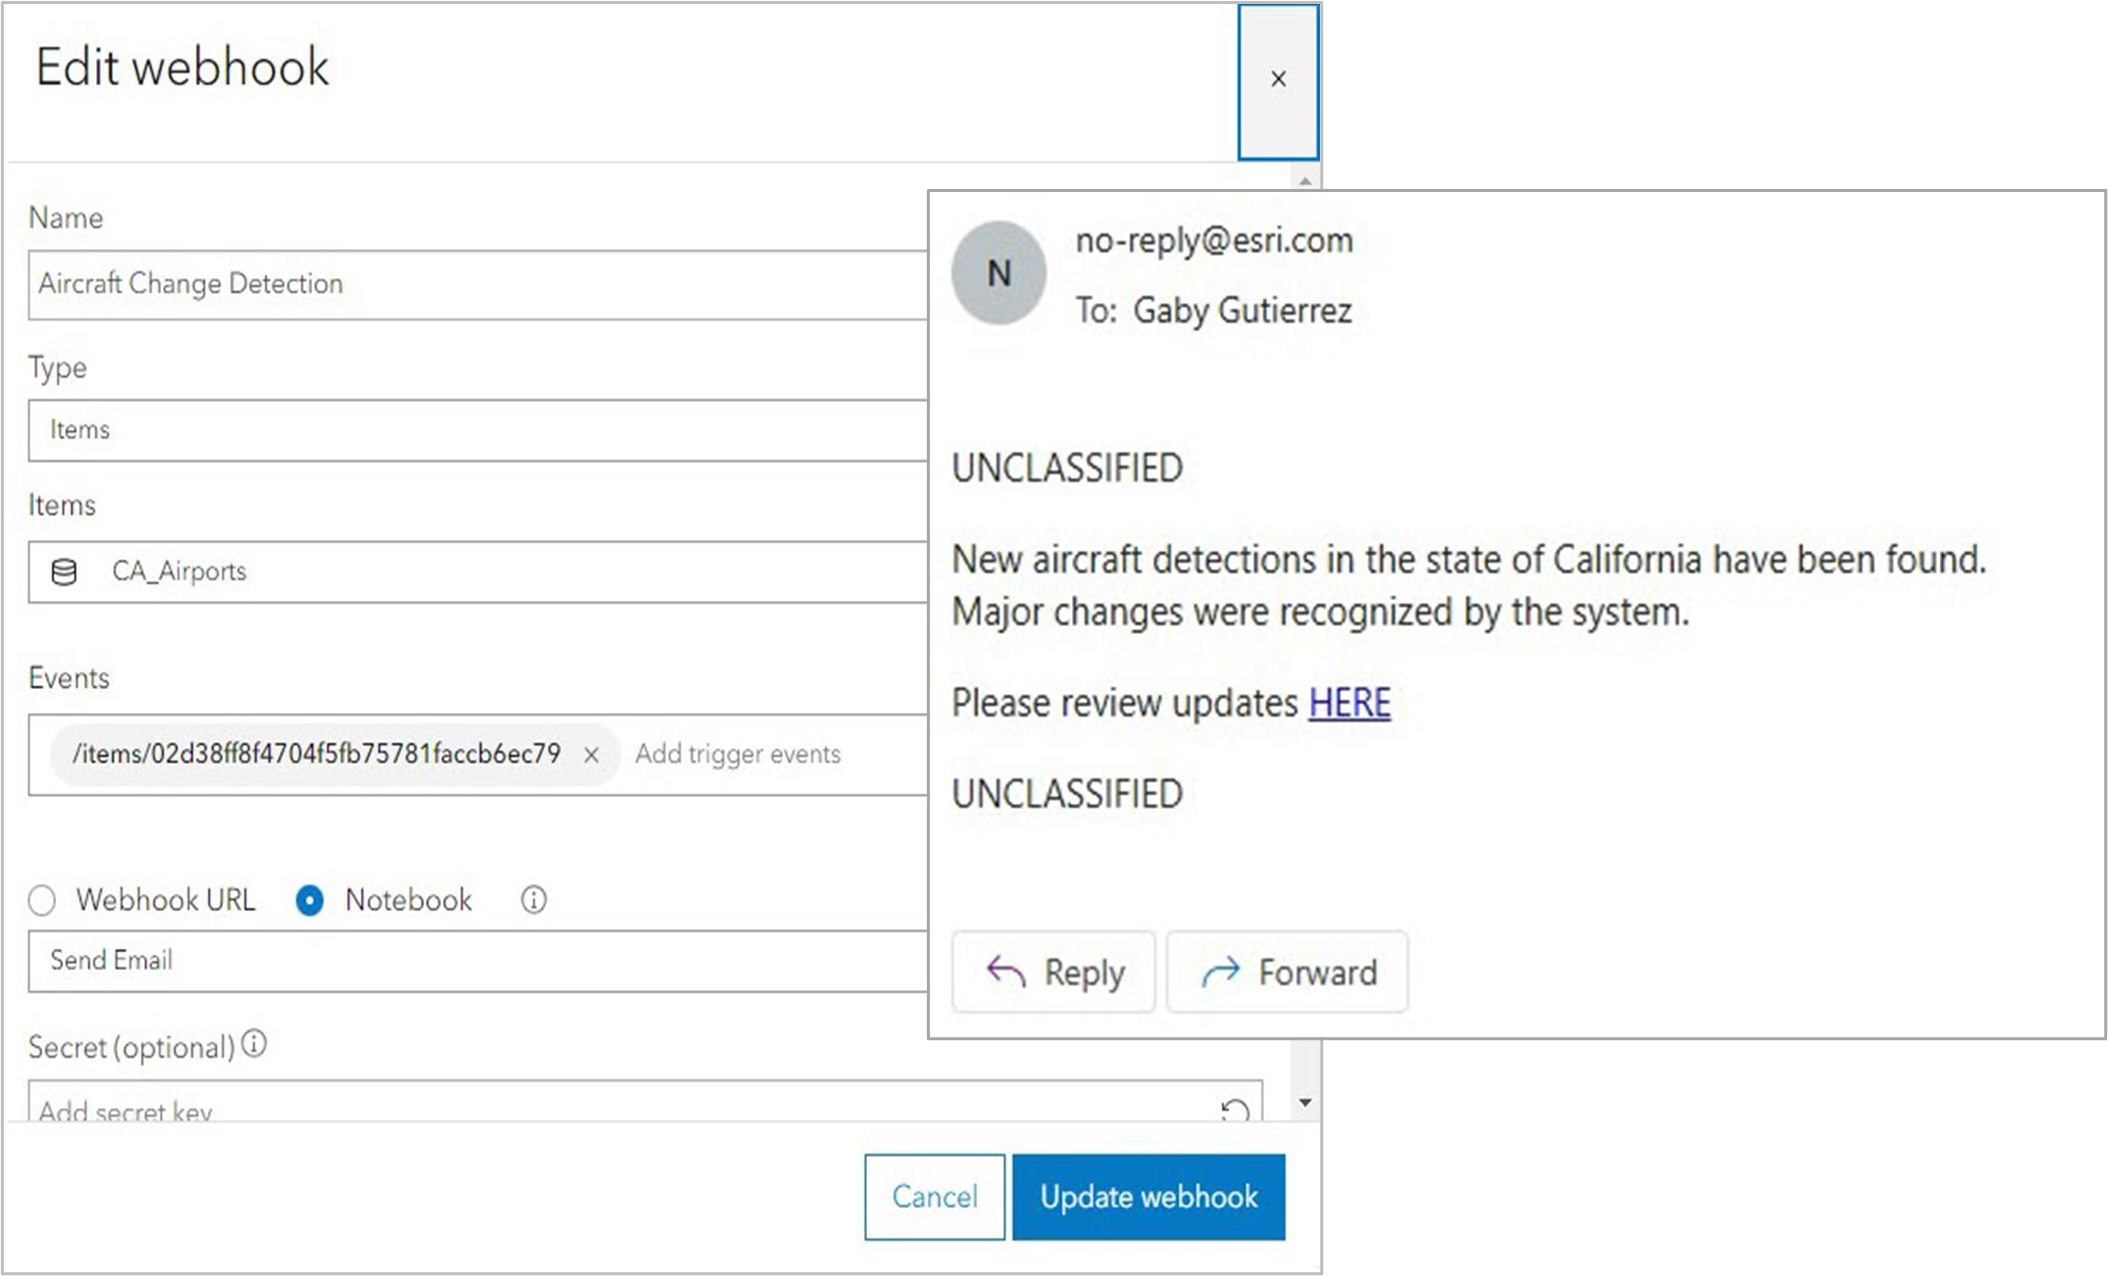
Reviewing the Results

When major changes were found, an email was sent to an analyst to review any changes in the data. Within the email sent by the webhook, was a link to an ArcGIS Dashboard where the analyst could get a quick glance of the detections for the day and review any anomalies found in our results. Looking at San Diego International Airport for example, we noticed one feature just outside the airport and wanted to investigate further.
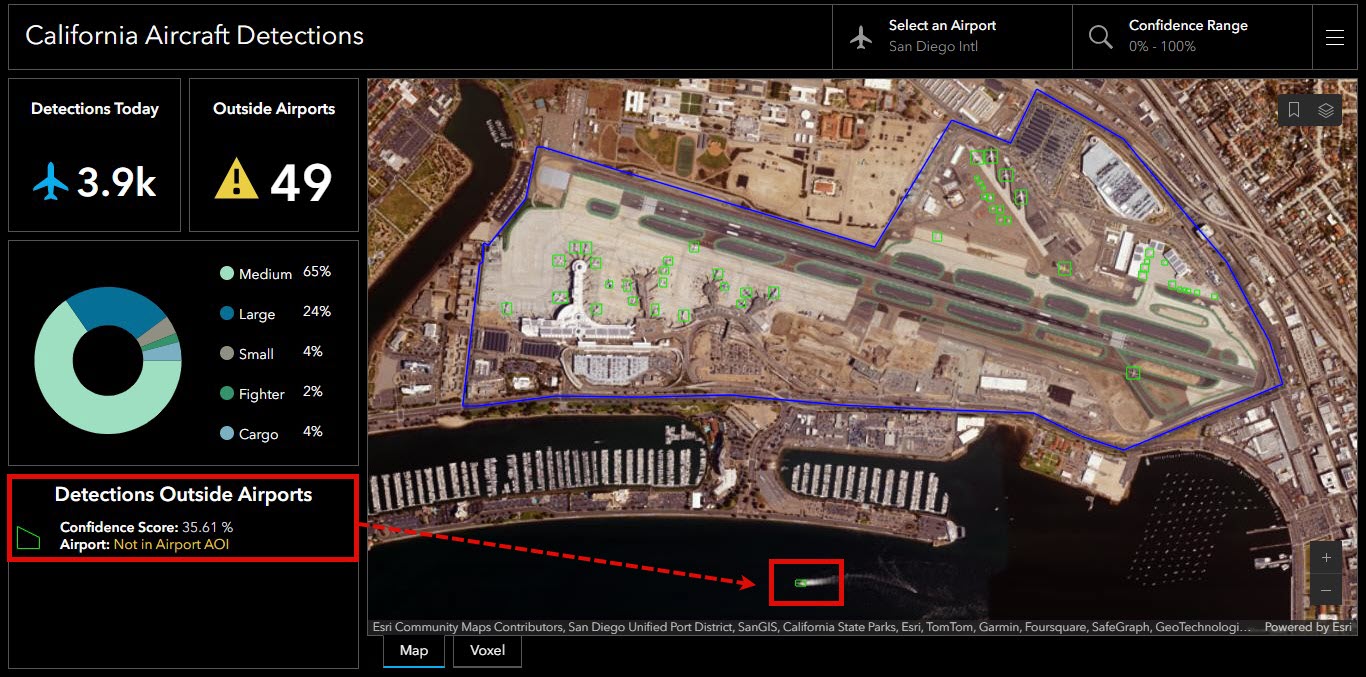
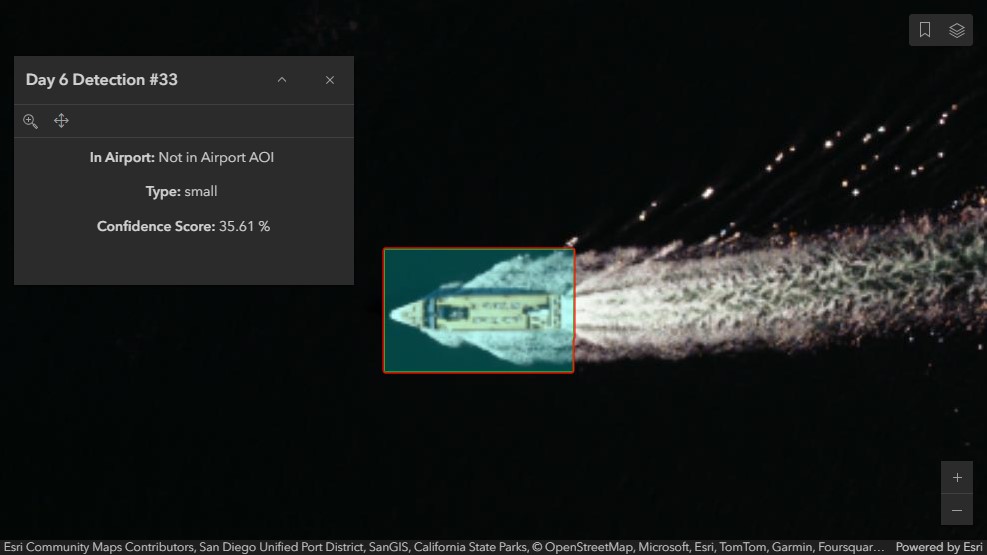
As we looked closer, we came to realize this object is in fact not a plane, but a boat in the San Diego Bay. Reviewing the confidence score from our custom model, it returned a 35% rating. This meant that the model was not so sure this object was an aircraft detection. AI is not always going to be perfect, but with human-machine teaming we can carry out quality checks like this one and use this to further refine our custom model in Deep Learning Studio to get as close to perfection as possible.
Understanding Detections Over Time
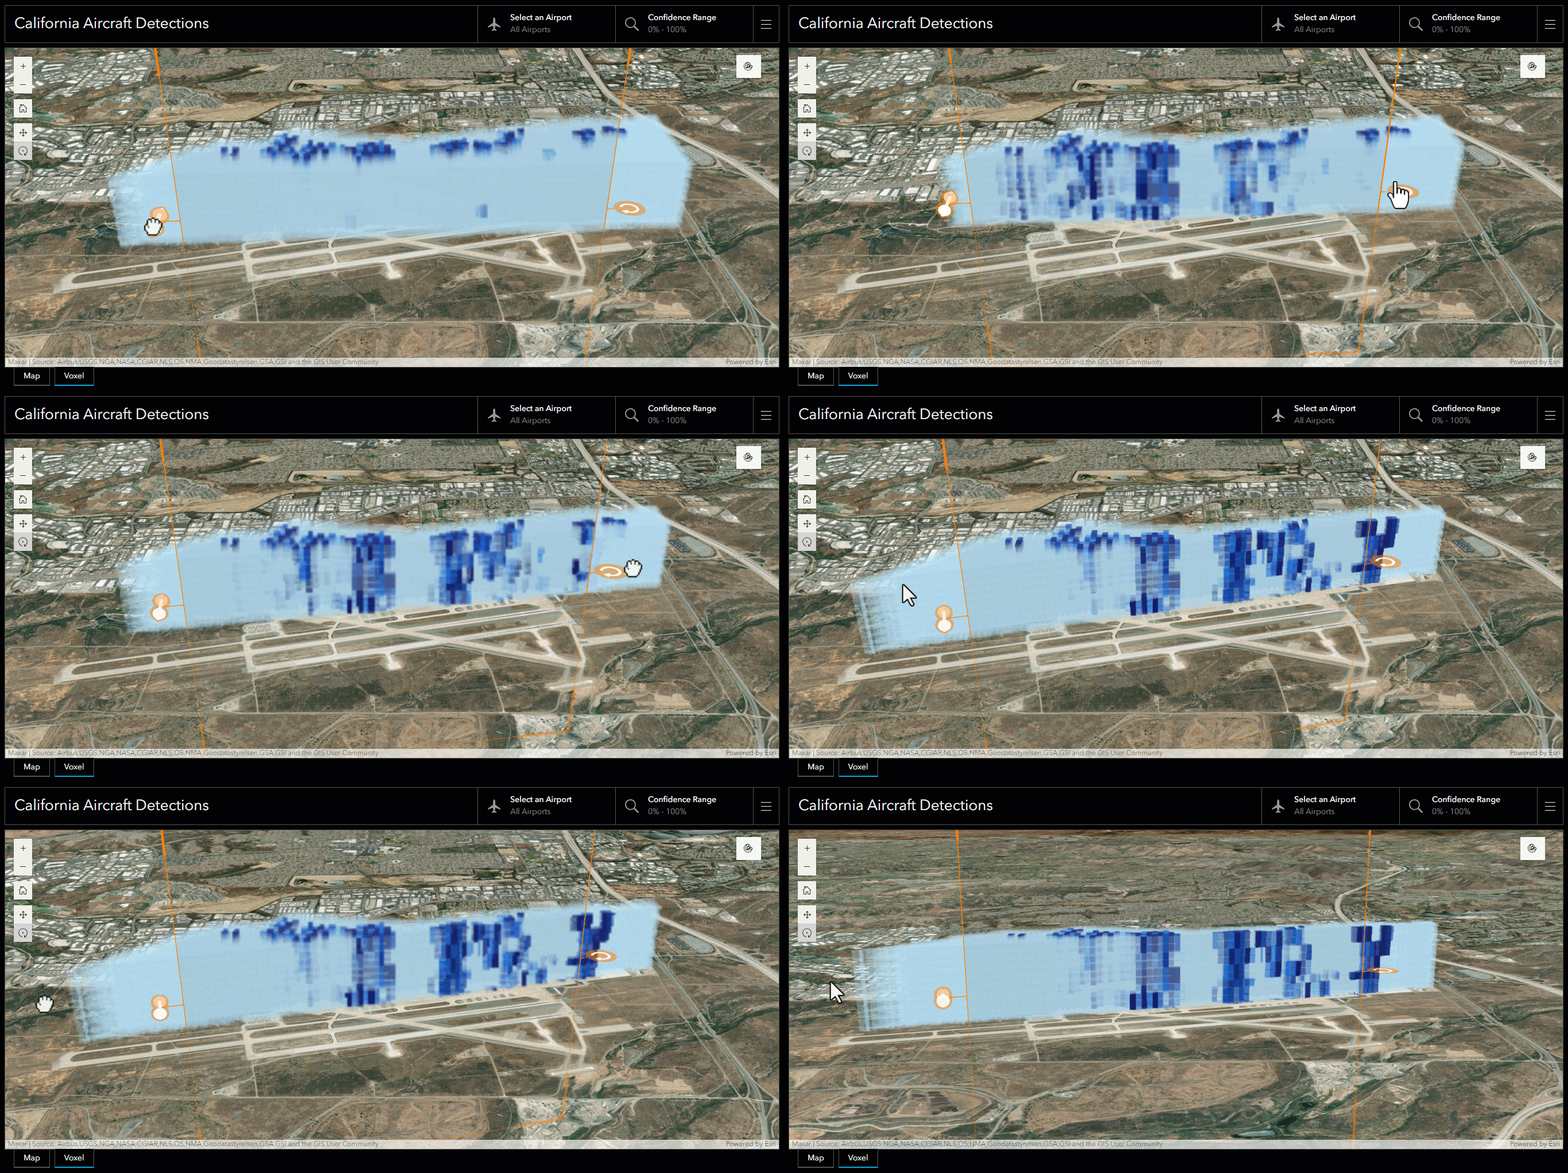
As we continued to collect aircraft detections each day, our data began to build up. This made it difficult to visualize spatial patterns where grounded aircraft were detected over time.
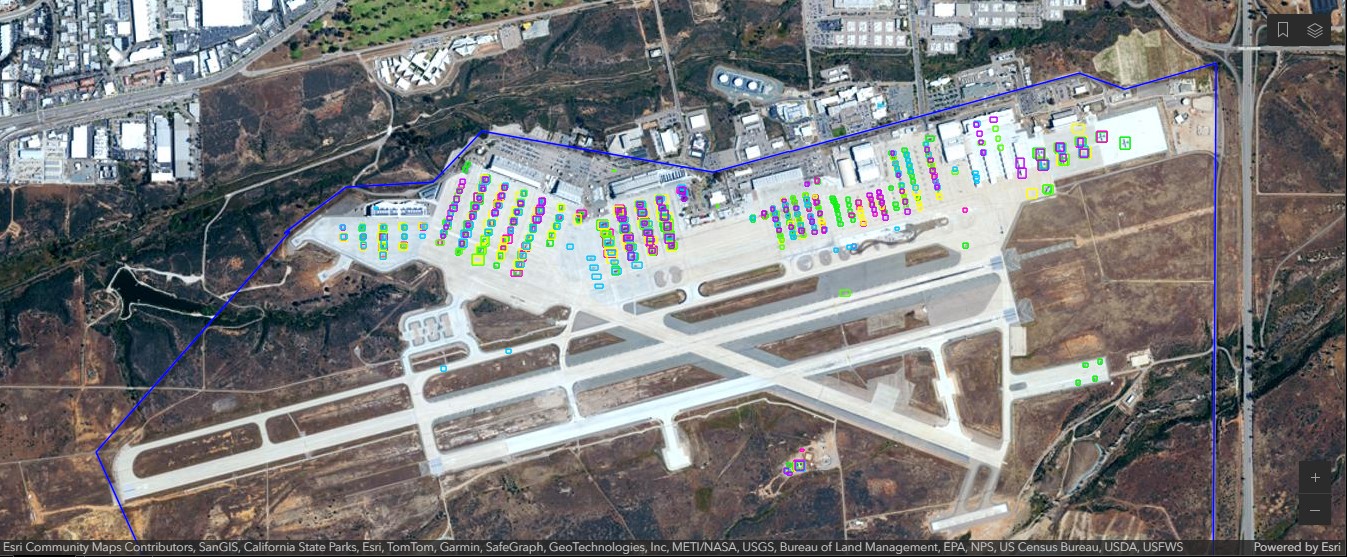
To visualize our data across both space and time and better understand any anomalies or hot spots, we created a voxel layer. Voxel layers are structured in 3D gridded cubes where each cube stores one or many variables, the same way a 2D raster stores a value for each pixel. This allows for detailed modeling of multidimensional spatial information and in our case helps us visualize how our spatial detections change each day by converting time into a height(z) dimension.
By integrating automation and rich analytics with ArcGIS, we can streamline our ability to extract insights across any geographic area, for any object. This partnered with the collaborative approach between AI and human-machine teaming ensures continuous improvement and reliability in our spatial intelligence, enhancing our capability to analyze and understand valuable assets at any scale.

Article Discussion: