The Vegetation Layer indicates tree canopy and represents one of the recommended base layers within the Community Basemap: providing depth and realism to the map.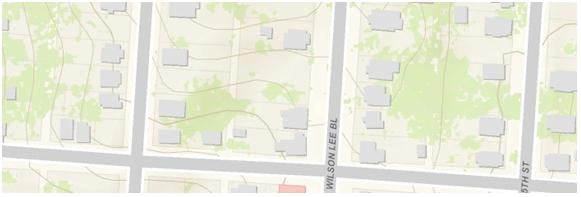
A recommended vegetation development workflow that leverages the ArcGIS10.0 Image Analysis Window and NDVI function is available here on the Community Basemaps Resource Center. Optimal output requires 4-band imagery (Infrared band). Where 4-band imagery is not available, we suggest using the new Image Classification Tool Bar to create a classified image from 3-band imagery. This reclassification process is dramatically simplified with the newly available tools in ArcGIS10.0. 3-band and 4-band imagery can be found at the USDA’s Geospatial Gateway for most of the United States.
1. Add 3-band imagery to ArcMap and make sure the Spatial Analyst Extension is on
2. Open the Image Classification Toolbar

3. Select your image in the pull down Training Sample Manager button
4. Zoom into an area with forests and use the Draw Training Sample with Polygon button to draw an area that has just forests in it or just around trees

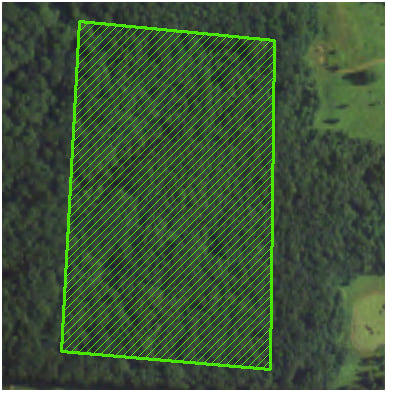
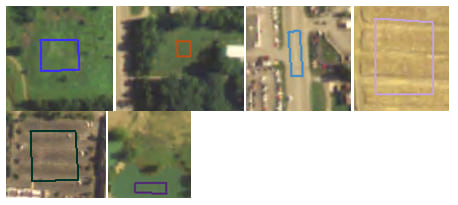
5. Add more training areas, include many polygons of open spaces and areas that do not have trees
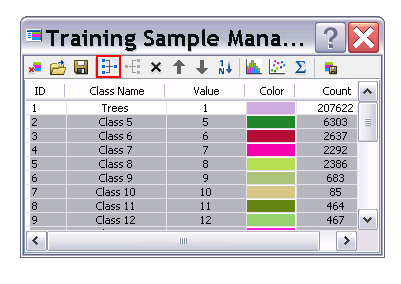
6. Open the Training Sample Manager while collecting these by clicking on the Sample Manager Button highlighted below on the Image Classification Toolbar (tip: pause your computer screen for this)

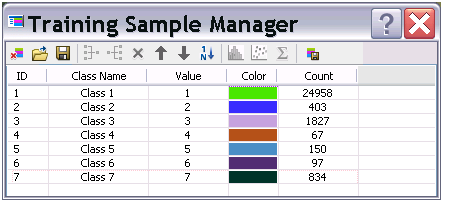
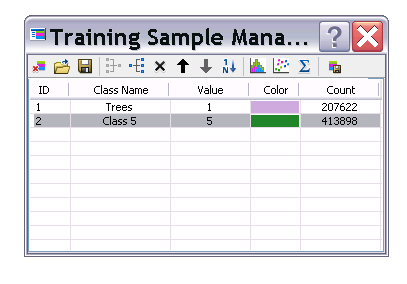
7. Rename the Class Name for vegetation Trees and select the rest to merge together using the Merge button on the Training Sample Manager
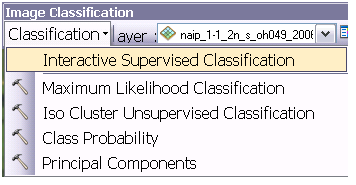
8. In the Image Classification Toolbar, select Interactive Supervised Classification
9. Open the properties for the new Classification image
10. Go to the Symbology tab, open the colors for the
Class 1 (trees). Click on more colors
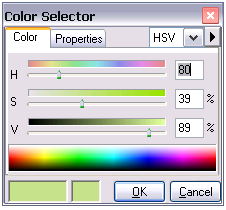
and set the color to HSV to H: 80, S: 39 and V: 89 and make the other class No
Color.
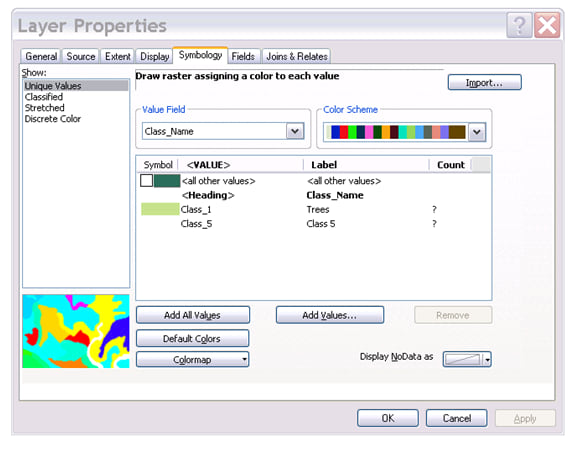
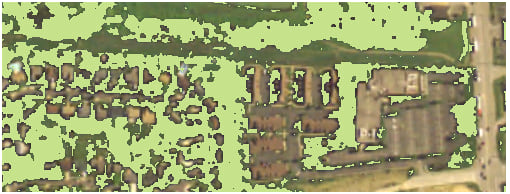
11. End result should look like this with imagery behind it
12. Double click on Layers in the Table of Contents
13. Click on the coordinates tab
14. Change the projection to Web Mercator (Auxiliary Sphere)
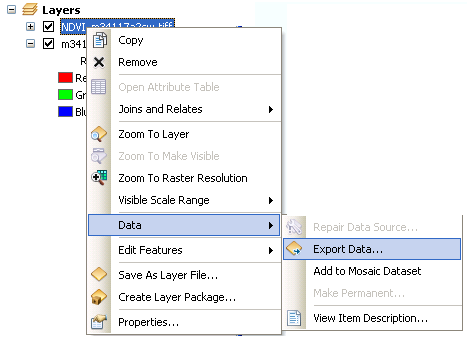
15. Right click on the classification image, go to Data, Data Export
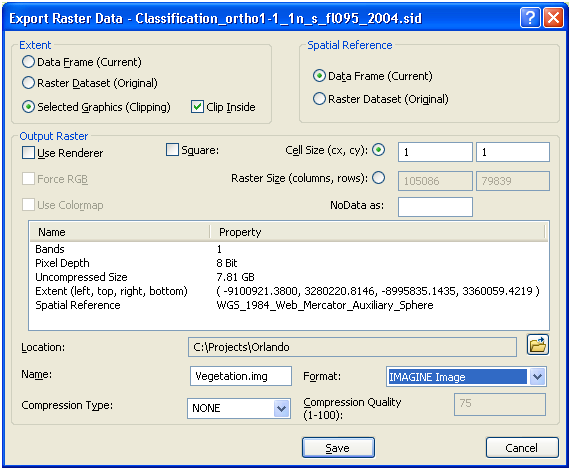
16. Export the image:
a. Clipped to the county or city boundary (you must add that layer before hand, convert it to a graphic and select that graphic)
b. Using the data frame spatial reference system
c. Set the Format to an ERDAS Imagine or TIFF image
17. Click Save
18. You may have to promote the pixel depth to store no data values on the next dialog (if you clipped the raster to a non-rectangular extent).
19. Click Yes to add the exported raster as a layer
20. Open the properties for the exported raster21. Set the colors as in Step 10
If you need additional help with these procedures, please email communitymaps@esri.com.
Commenting is not enabled for this article.