As the pace of coastal change accelerates, there is naturally a greater need for efficient and timely acquisition of coastline information.
At the Developer Summit 2021 plenary, Rhea Jackson demonstrated how you can use the ArcGIS API for Python and the ArcGIS Notebook Server to automate coastline extraction, which can facilitate the analysis and protection of these dynamic and fragile landforms.
Watch the plenary video below, and then read the rest of the blog for a summary of the processes that Rhea explored in her demo.
Search and visualize satellite imagery
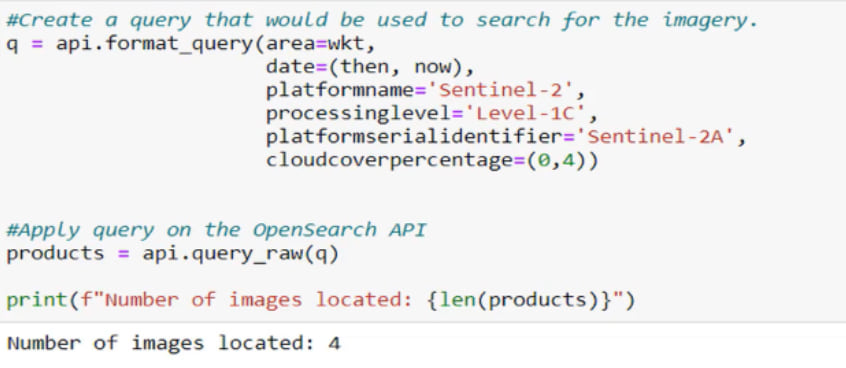
First, Rhea used Sentinelsat, a Python package, to search for Sentinel-2 level-1C satellite images in the Copernicus Open Access Hub (SciHub). Sentinelsat provides a Python API and a command-line interface that simplifies the searching and downloading of all Sentinel products from SciHub.

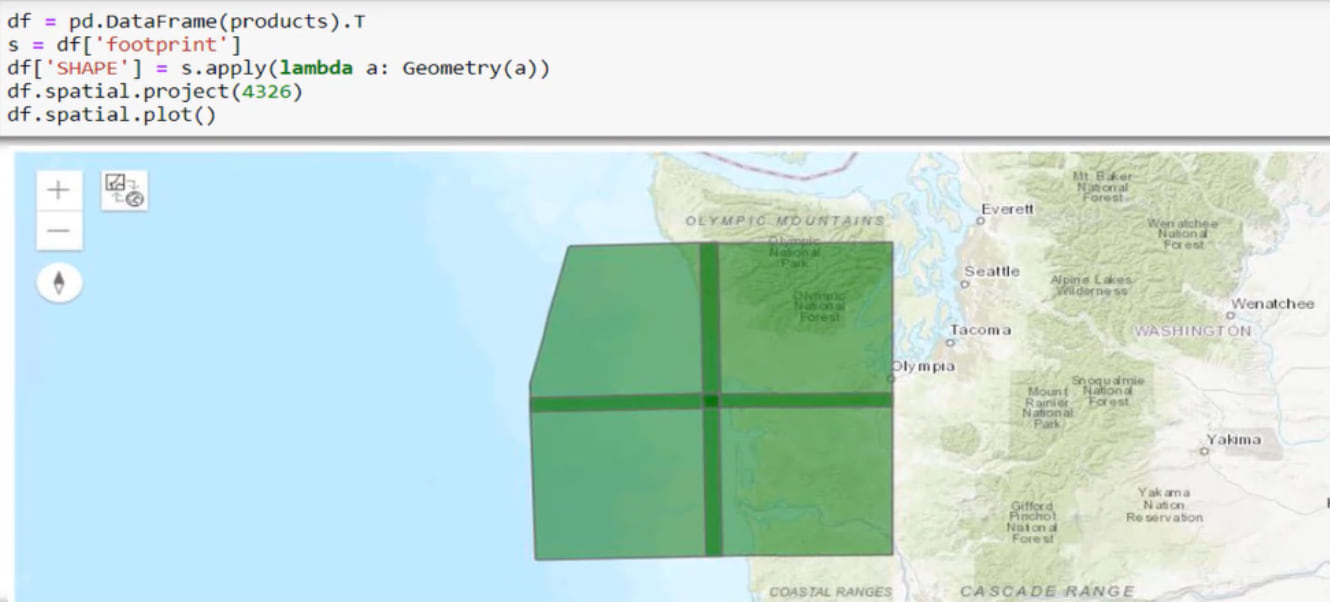
She then transposed the index and columns of the resulting data frame using the Pandas Python package and visualized the footprint on a map widget provided by the ArcGIS API for Python.

Download and process the data
Next, Rhea used Sentinelsat to download the satellite images and retrieve their metadata.

She then used the create_image_collection method to create an image layer from the downloaded images. Note that she specified ‘Sentinel-2’ as the raster type.

Immediately after, she performed three pre-processing steps—extracting the near-infrared (NIR) band, the blue band, and the red band to delineate certain surfaces—before running the raster calculation function to apply the band ratio technique, which is a remote sensing technique for coastline extraction. She later converted the binary raster to a polyline feature during the post-processing of the data.


Automate the process
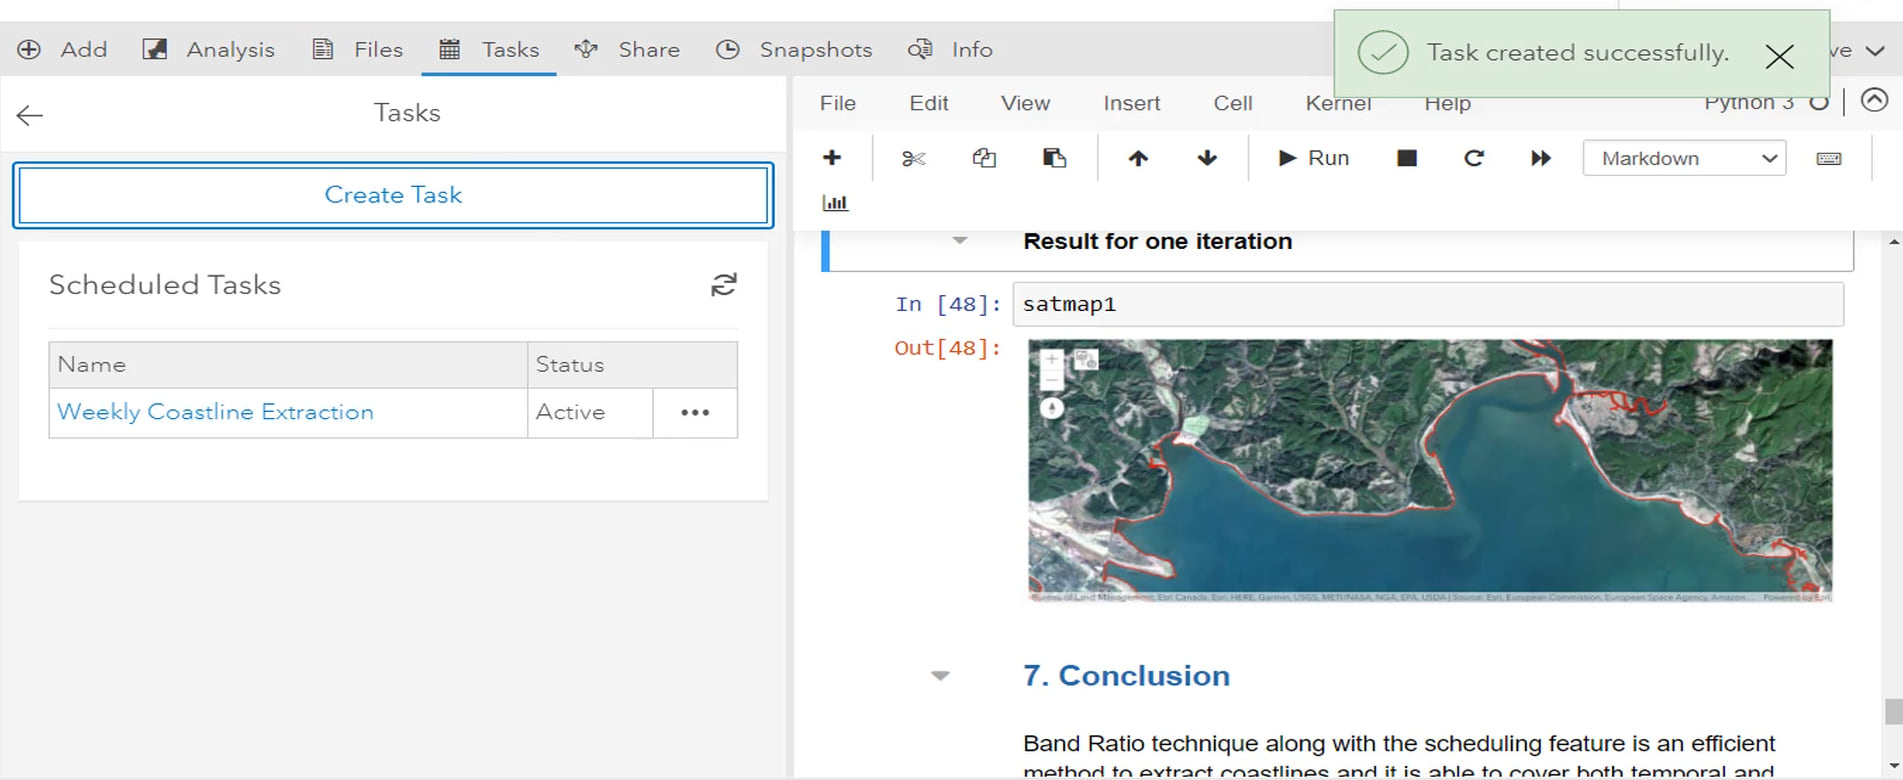
After successfully extracting the coastlines, Rhea used the ArcGIS Notebook Server’s task scheduling feature to configure a task that automatically executes the ArcGIS Notebook every Monday at noon.

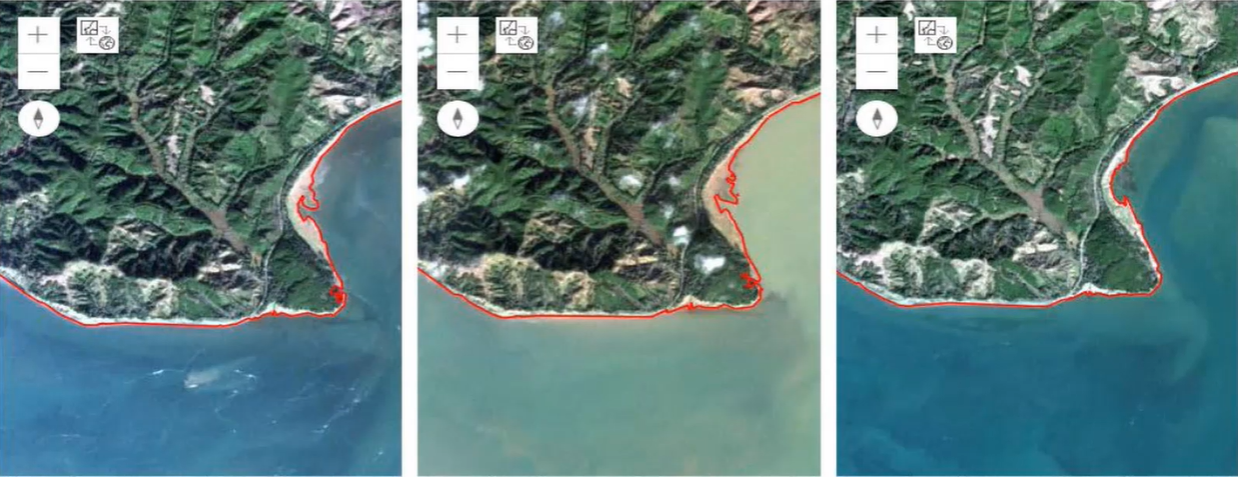
Finally, she showed the results obtained after three weeks of automated execution of the notebook.

Try it for yourself
Rhea’s demo showed how a time-consuming and labor-intensive task such as coastline extraction can be automated with the powerful remote sensing capabilities of the ArcGIS API for Python and the ArcGIS Notebook Server’s task scheduling feature. Visit the ArcGIS API for Python and the ArcGIS Notebook Server pages to learn more about how you can automate the execution of your notebooks to facilitate your GIS work.


Commenting is not enabled for this article.