Did you know that as an administrator, you can use ArcGIS API for Python to get an overview of resources and activities in your ArcGIS Online organization for a specific time period? At this year’s Developer Summit, Manushi Majumdar shows five ways to utilize the API to monitor and manage your organization efficiently and effectively.
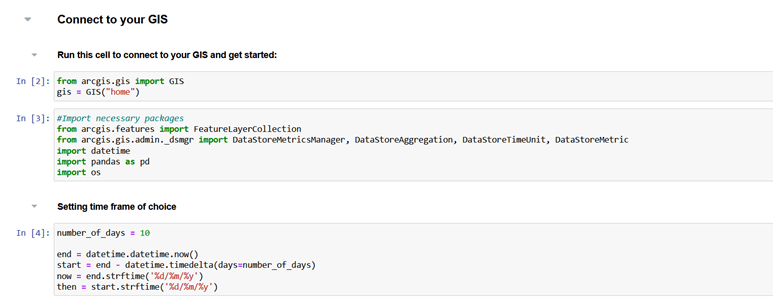
Manushi starts her demo by running the foundational code cells in her notebook, which import the GIS object and other required packages and set the time frame to 10 days.
Usage history
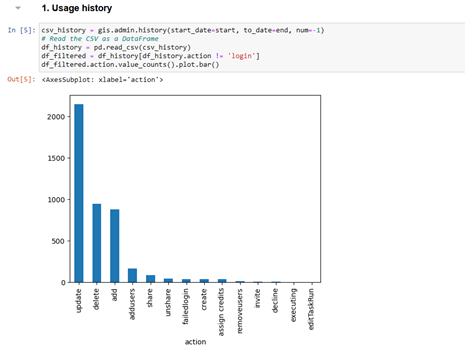
Administrators can use ArcGIS API for Python to understand the status of their organization’s members and their activities. To get usage history for the past ten days, Manushi uses the history() method of the arcgis.gis.admin module, which returns a CSV file containing a history of user actions. She filters out the login history from the CSV file and plots the remaining actions on a bar graph.
Credit reports
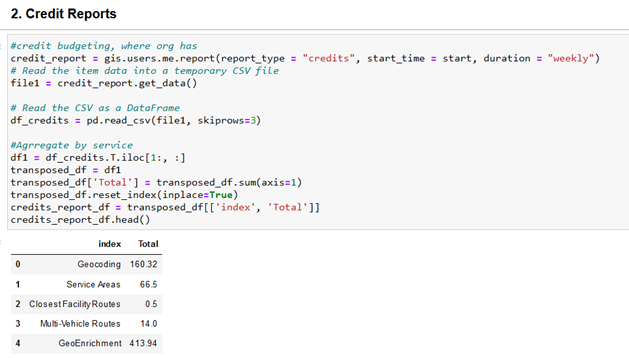
A credit report is valuable in helping administrators assess credits consumed by members of their organization. To generate a credit report, Manushi uses the report() method of the gis.users module, with the report_type parameter set to a credit report. She then aggregates the number of credits used by credit-consuming tools, such as geocoding, GeoEnrichment, and spatial analysis, and presents the results in a table.
Content reports
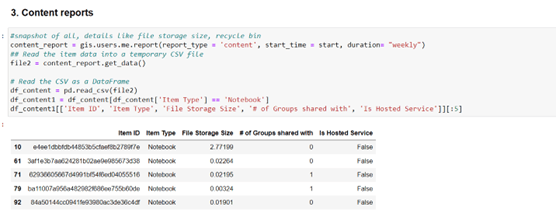
A content or item report provides administrators with a snapshot of all content items in their organization. It includes information such as item name, type, storage size, and share level. To get detailed information on the content items in her organization, Manushi generates a content report using the same report() method. This time, she sets the report_type parameter to a content report. For easy visualization, she selects only the Notebook items and a few item details and presents the first five results in a table.
Metadata validation
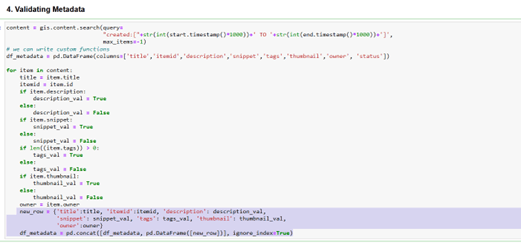
Metadata is any information that describes an item, helping users discover and validate its usefulness and reliability. Some examples of item information include the item title, type, description, source, author, last modified date, thumbnail, and tags. To see if new items created in the past ten days have the required metadata, Manushi implements custom code that loops through each item and checks for missing information. After an item is checked, a new item with the same item name and item ID is created and populated with Boolean values for other item information based on their presence. The new item is subsequently added to a new DataFrame object with column names that match the item’s properties. Next, Manushi presents the DataFrame object in a table to identify items missing the required metadata.
Data Store metrics
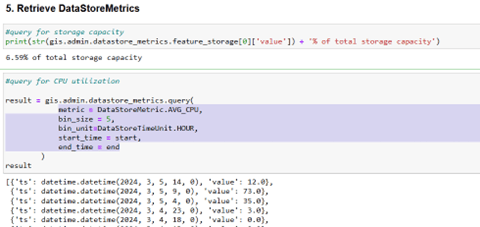
The upcoming release of ArcGIS API for Python (version 2.3.0) will feature a new DataStoreMetricsManager tool that allows administrators to monitor key resource metrics of their ArcGIS Online Premium Data Store. Manushi leverages the tool to collect CPU utilization metrics for the past ten days by using its query() method with the metric parameter set to AVG_CPU and the bin_size set to 5.
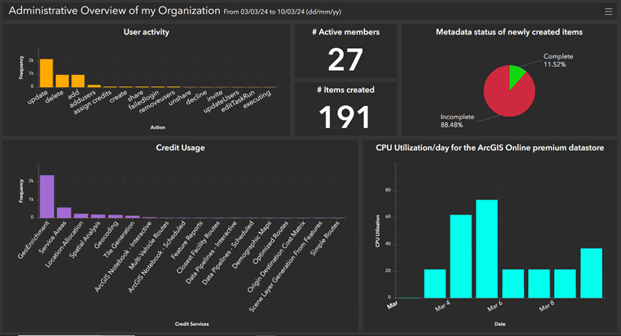
Finally, Manushi compiles all her findings onto a dashboard to monitor events, identify trends, make decisions, and inform others in her organization.
Visit the ArcGIS API for Python page to learn more about these and other ways to supercharge your ArcGIS Online organization management.


Commenting is not enabled for this article.