Insights for ArcGIS 2.1 has been released and is available for users with ArcGIS Enterprise 10.5.1. Take a look at what’s new in the latest release:
Maps
New and enhanced map pop-ups are now available. The Pop-up tab in the map legend displays attributes for features that are selected on your map. This new tab is a simplified way to find out information about your data.
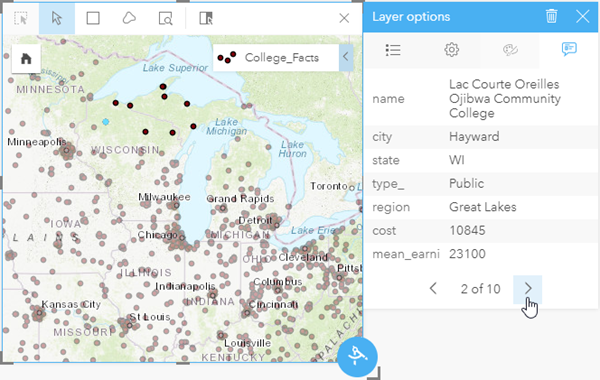
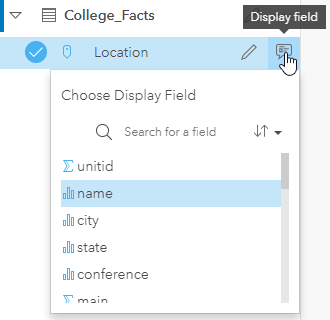
In-map pop-ups have also been enhanced to add configuration: you can choose a field to be displayed in the pop-ups using the Display field button. By default, the pop-ups will display the value from the first string field. The Display field button allows you to choose which field you want to display from the list of fields. If the map is being styled by a field other than the location, then the Display field will be a secondary attribute in the pop-ups. This new enhancement gives you more control over the way your data is displayed in Insights.
Charts
There have been several new enhancements to charts in Insights, including new spatial treemaps, zoom tools, and a redesigned chart menu. Spatial treemaps are similar to normal treemaps, but the categories are displayed using the spatial distribution of the data. You can also create a treemap using a second categorical and numeric field, which will be used to create a subgroup and display the chart with graduated colors respectively.
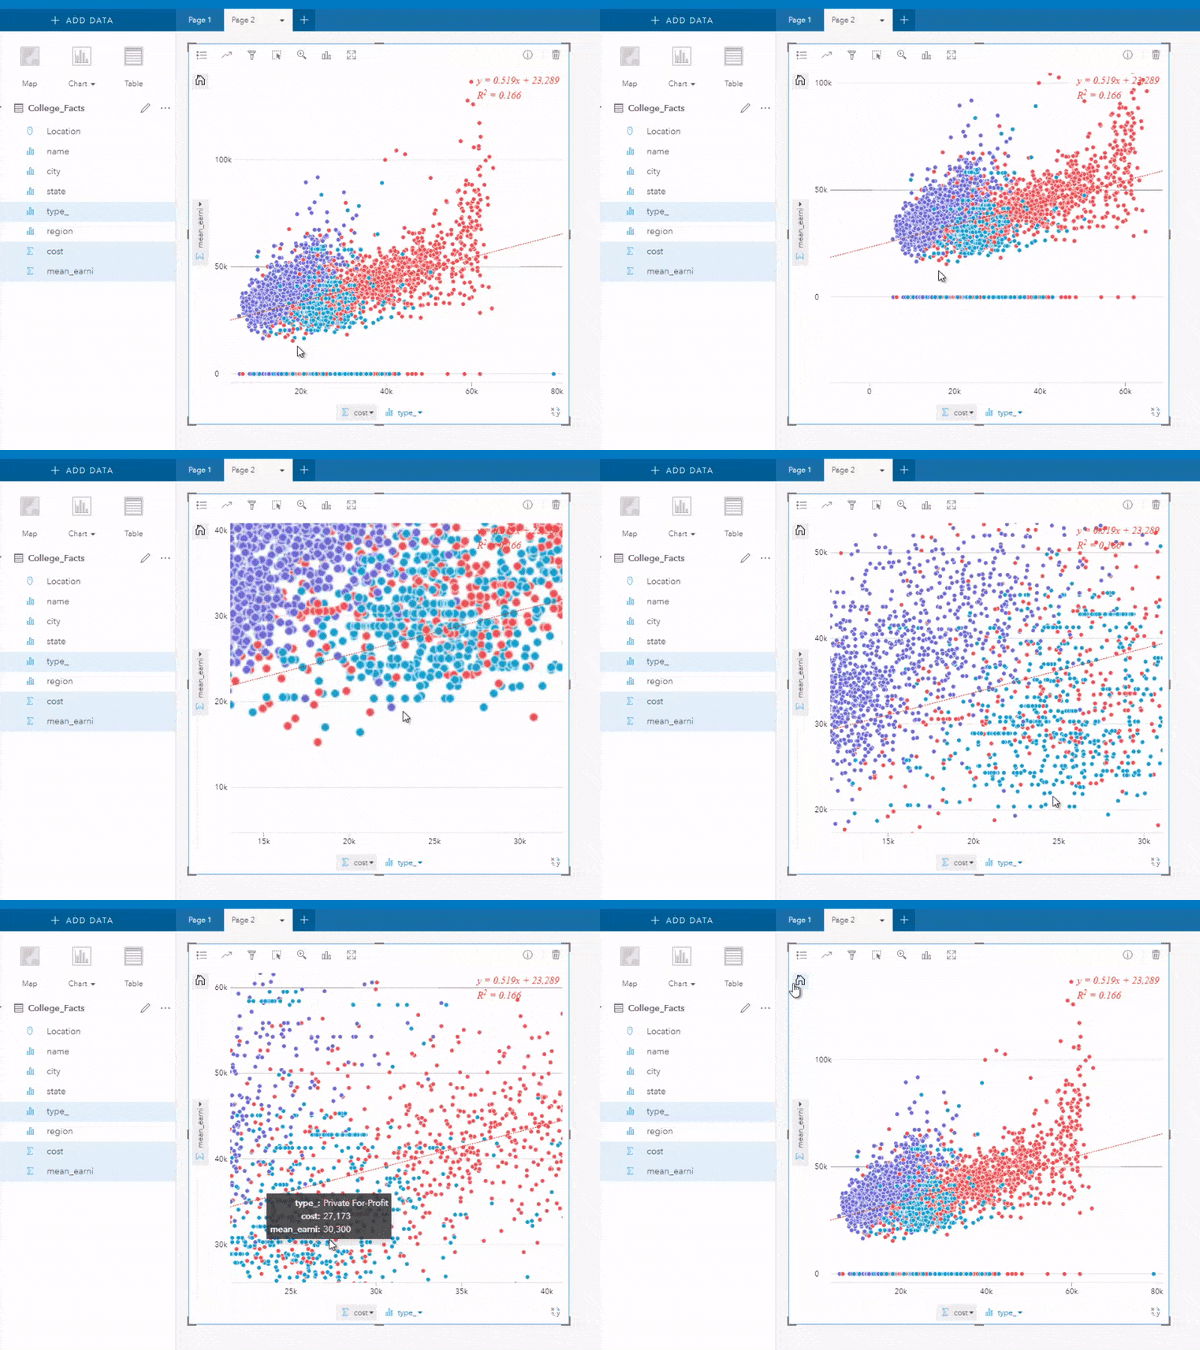
You can now zoom in and out on your scatter plot, as well as pan around the display. Zoom is useful for closely examining data that is clustered together, that has large quantities, or that is spread out in a large range. In each of these cases, it may be difficult to see individual data points. Using zoom will allow you to focus in on smaller sections of the chart to see the patterns more effectively.
The Chart menu above the data pane has been redesigned to show available chart types based on the type of information they display. The redesign will help users determine which charts are best to communicate the data they are displaying.
Filters
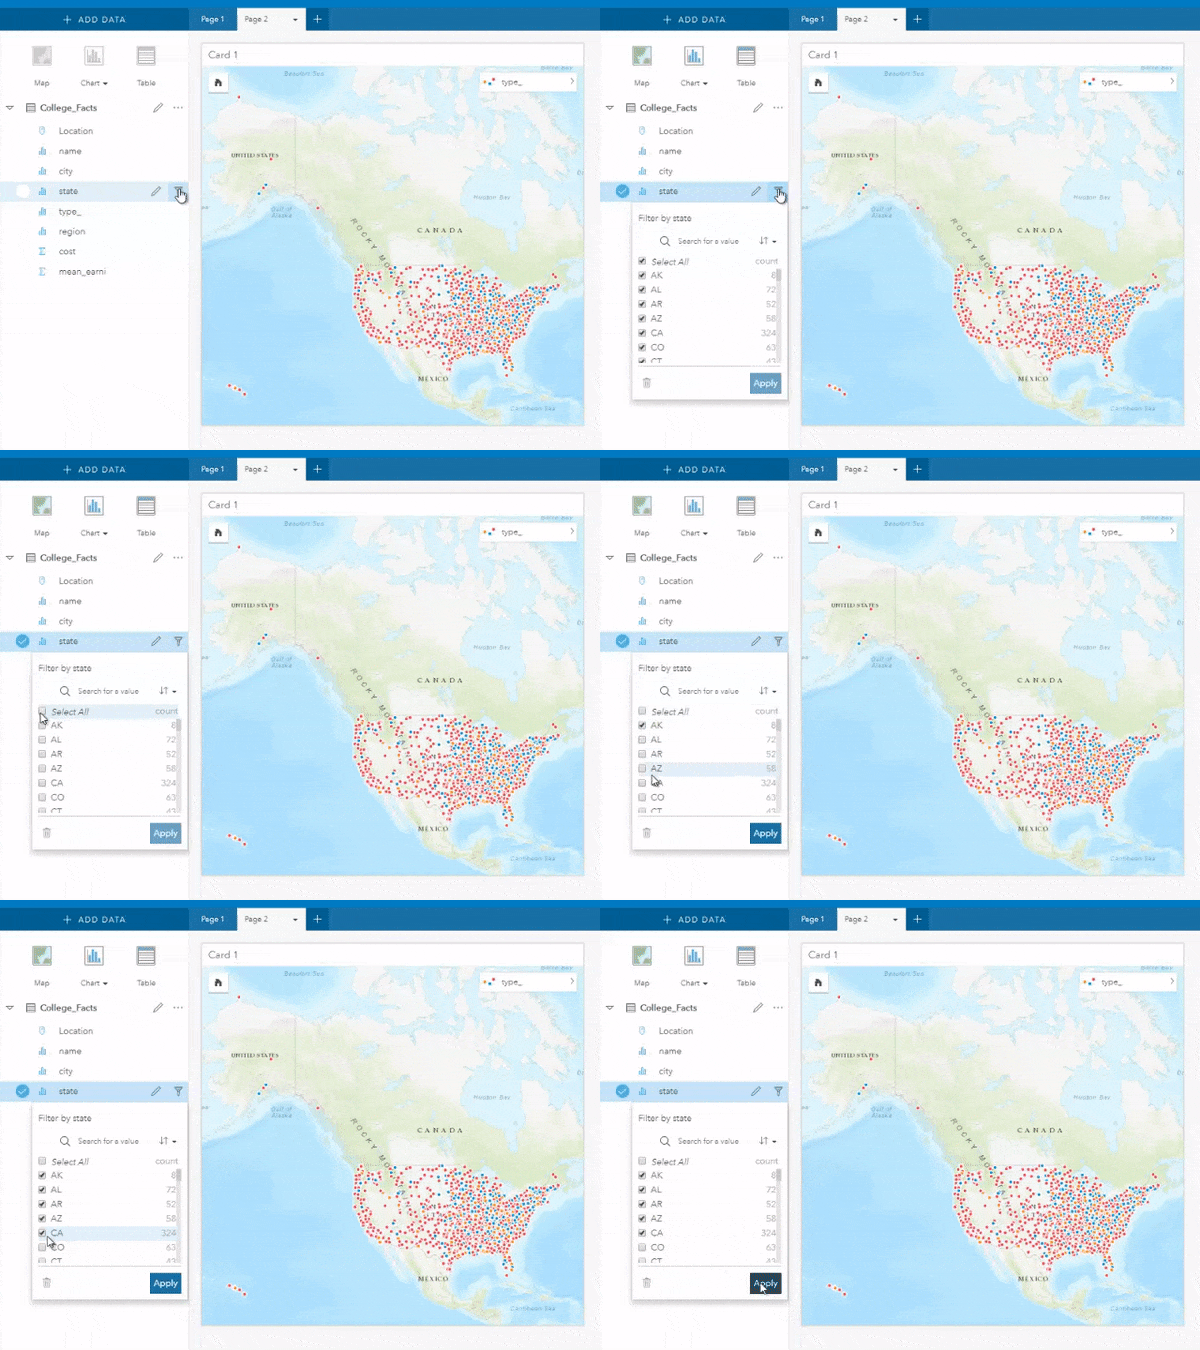
Filters have been enhanced to allow Shift + click as a form of multi-select for string fields. To use this function, select a value on the filter, then use Shift + click to select a second value. All of the values between the two toggles will be selected. Shift + click can also be used to deselect values from the filter.
Data
Insights now supports Microsoft Azure SQL Databases, along with the previously supported Standard and Enterprise database editions. These new supported databases mean that users have even more options for adding data.
Insights now has limited support for geodatabases. You can now connect to a database that has an enterprise geodatabase and add registered geodatabase tables to a workbook. Only geodatabase user tables not created under the sde user schema can be viewed and accessed from Insights. The Insights team will continue to enhance the geodatabase support from Insights. Keep checking for updates in future releases!
Analysis
Result datasets are now listed in the data pane under the dataset that was used in the analysis in reverse chronological order. These changes will make the connection between datasets and results more intuitive, and make the organization of the data pane easier to follow.
Resources
Check out the ArcGIS Blog for posts about Insights. Use the Insights for ArcGIS tag to find news and tips for using Insights. The ArcGIS YouTube channel also includes an Insights for ArcGIS playlist, which can be used to find other helpful tips. Submit your questions to the product team via the Insights for ArcGIS GeoNet group or follow us to stay up to date on the latest news.
Check out the brand new Get started topics in the Insights help documentation for overviews of the main processes in Insights. You may also want to try the three scenario-based exercises: Create your first workbook, Solve a spatial problem, and Share your analysis.

Commenting is not enabled for this article.