Intelligence analysis is a complex process that involves integrating multiple data types. Analysts utilize techniques and workflows, such as pattern recognition, statistical analysis, and other methods, to identify relevant information and extract meaningful insights. Creative analytical workflows are a crucial decision-making component in national security, law enforcement, and business intelligence.
The following workflow example demonstrates how an intelligence analyst would use Esri’s analytical, graph, and motion imagery capabilities within the same workflow to derive meaningful insights. ArcGIS AllSource is Esri’s newest desktop software explicitly designed for intelligence professionals. It empowers users to turn raw data into decision support.
Movement Data Analysis
In the following notional example, the activities of a crime syndicate operating in Adelaide, Australia, are visualized. Utilizing the intelligence toolset in ArcGIS AllSource, particularly the movement tools, allows us better to understand the syndicate’s primary areas of interest. The movement analysis toolset will enable you to analyze point track data, including comparing tracks over different areas, extracting unique identifiers from a point track dataset, and identifying where tracks meet. This analysis will help identify potential surveillance locations in the future.
The Find Meeting Locations tool identifies areas of high meeting concentrations (depicted by the orange polygon) and physical meetings that have occurred with their locations (represented by the points). In this case, the meeting points are centered around a single building at the port. The meeting points reveal critical attribute information like the meeting start and end times and the participants involved.
When using the Timeline functionality, which is unique to ArcGIS AllSource, analysts can quickly identify how long each meeting area has persisted and, therefore, which areas may be most influential to this organization. For example, the meeting area below has been active for over a week.
Graph Data Analysis
While the map and movement tools help visualize interactions spatially and temporally, ArcGIS Knowledge, combined with graph analytics, can help explore the network and its relationships in a whole new way.
Knowledge graphs identify relationships between areas of interest and the members of this network, illustrating how they are interconnected.
Using the movement tools, analysts can identify significant locations in this network, like the meeting areas you see in the graph below. By loading the output of these tools into an Investigation in ArcGIS knowledge, critical areas can be quickly identified where the members of this organization met and dwelled or loitered for extended periods of time, as well as the persons associated with this network and the relationships that connect them.
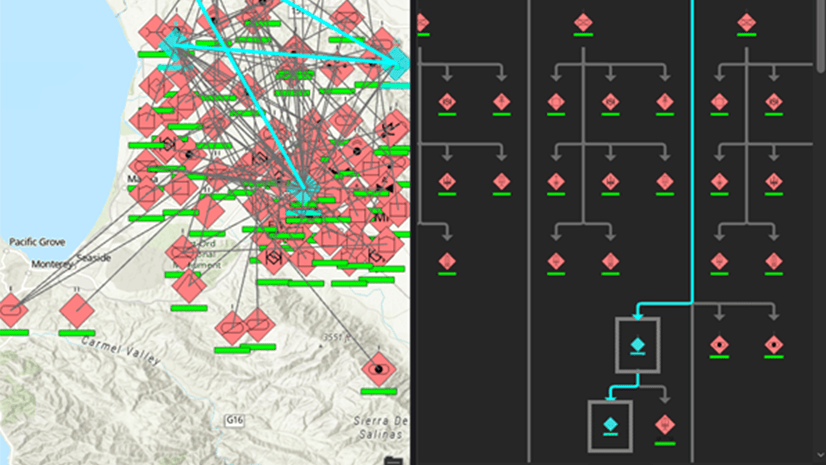
Focusing specifically on these areas of interest will help identify which locations would likely be the most prolific for future surveillance. Areas of Interest are added to a link chart, displayed as if drawn on a whiteboard, and complete with the robust symbology available through ArcGIS AllSource. This link chart will reveal which locations are of the highest value to prioritize the placement of surveillance assets.
When the link chart variables are expanded, they visualize and quantify the individuals’ locations observed, making it easy to discover which locations have the highest value.
The geographic layout for the link chart allows me to visualize this data in a spatial context by positioning the location of interest entities on a map canvas according to their real-world locations. The nonspatial person entities they’re connected to are arrayed around them so the analyst can see all the data, especially the spatial data, in its proper geographic context.
Utilizing the graph analytic capabilities native to ArcGIS Knowledge, analysts can quickly identify and locate the map’s most influential area of interest. Not surprisingly, the top location is the meeting area previously observed by the port, as shown below.
Video Data Analysis
After utilizing ArcGIS AllSource and ArcGIS Knowledge on the desktop to identify the most influential location for this crime syndicate, the insights discovered can be used as a starting point for video surveillance operations. The newest server role, ArcGIS Video Server, is utilized through ArcGIS Excalibur. ArcGIS Excalibur is a web-based imagery and video analysis application that will enable search and discovery of aerial surveillance over the location of interest for exploitation.
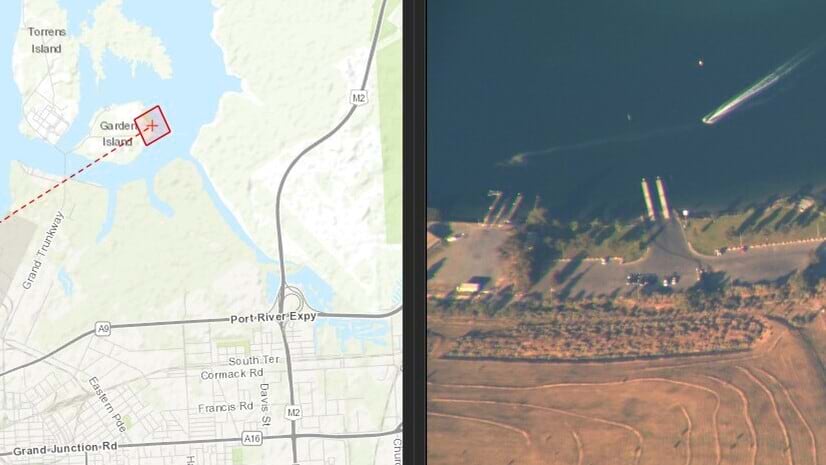
Analysts can identify video footprints over the port of interest in Adelaide through ArcGIS Excalibur. Zooming into the specific location of interest, the building where most of these meetings occurred can be easily identified. A point-based or polygon-based search filter can be applied to the video based on this specific location of interest to find all the times in the video that this building is visible, which saves time and enhances the collections process.
Analysts can take the video search results and connect to the canvas to watch the surveillance video (following either the video, the sensor or the frame on the reference map). The search results are designated by the orange markers on the video timeline and analysts can jump to the times where the building of interest is in frame.
Additionally, in scenarios where analysts are lacking up to date imagery over a location of interest, a frame can be captured directly from the video and seamlessly viewed on the reference map to have better context of where observations are made.
To provide additional spatial context, analysts can also flash locations, like the building of interest, in the video onto the map to better orient to key locations.
As observations are made, and persons of interest are identified, those observations can be added to the knowledge graph for more foundational understanding of this organization of interest. Prior to 11.2, knowledge graphs could only be utilized by analysts in the desktop software but have now been brought to the web and easily viewed in the brand-new Knowledge Studio web application.
Getting Started
Incorporating tools into an intelligence analyst workflow that seamlessly work together without a loss of data reduces the complexity of integrating and exploiting multiple data types. Intelligence analysts are charged with pattern recognition, statistical analysis, and other methods, to identify relevant information and extract meaningful insights. Having tools available to be creative in the analytical workflow are crucial to decision-making.
To get started, visit the webpages for ArcGIS AllSource, ArcGIS Knowledge, ArcGIS Video Server, ArcGIS Excalibur and contact sales.


Article Discussion: