Learn how to do real analysis with 3D data in Chapter 6 of The ArcGIS Book
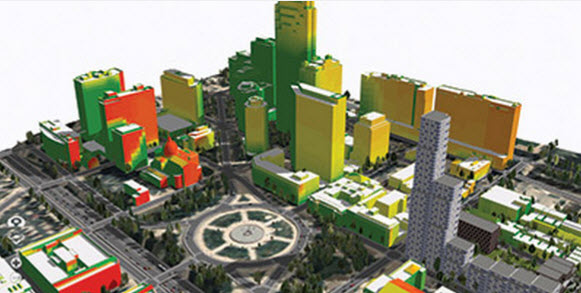
3D mapping and cartography are used in many disciplines to solve real-world problems. Emergency managers, urban planners, crime analysts, architects, facility managers, tourism boards, and historians represent some of the professionals employing 3D GIS for their purposes. If you’re looking for ideas on how to use 3D in your work, you will certainly find inspiration in chapter 6 of The ArcGIS Book.

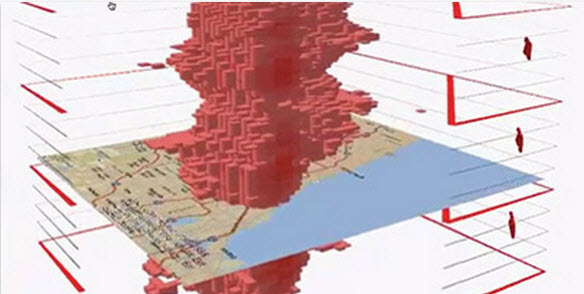
Beyond inspiration, this chapter also describes the advantages of 3D. You will explore the power of the z-axis and its ability to incorporate vertical information such as the elevation of mountains or flight paths of jetliners. Also, you will see how intuitive symbology eliminates the need for a legend, showing real-world bird’s-eye views helps us gain a better understanding of a place, and human-style navigation replicates our natural experience.

You will also learn 3D terminology and understand important considerations when working with 3D content. For example, what is the difference between a map and a scene? Should you display content in a local or global scene environment? What is a surface? What is the best way to symbolize features for a specific project?
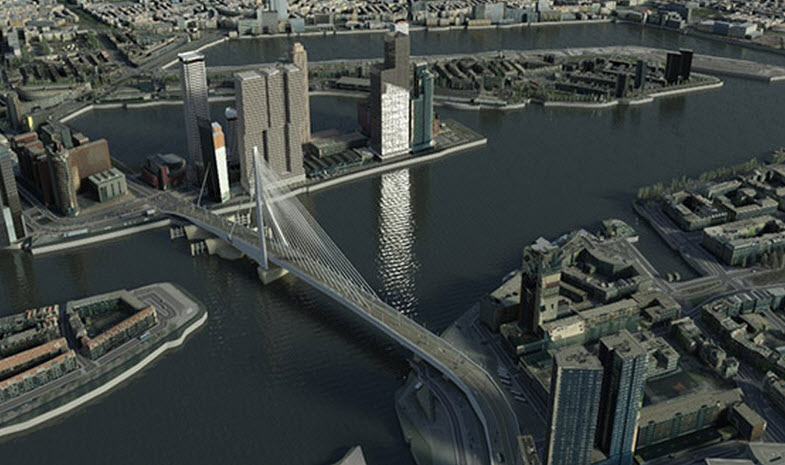
When representing the world in 3D you can do so in a photorealistic, 3D cartographic, or virtual reality view. Find out when it makes sense to use each view and what look and feel, styling, and thematic view would make a great scene for a given project.

“GIS users share maps and scenes with one common goal—to communicate spatial information—and careful use of thematic symbols in 3D can be as effective, or even more effective, than similar techniques in 2D,” says Nathan Shephard, a technology evangelist and 3D GIS engineer at Esri, and the thought leader introduced in this chapter. He is also an independent game developer who believes that “in the same way that every map is not an aerial image, every 3D view should not be an attempt to recreate the real world.”
The Quickstart in chapter 6 invites you to think about the purpose of the 3D scene you want to create before you start designing it to ensure it effectively conveys your intended message or information.
The Learn ArcGIS lesson in this chapter will transport you to Venice, Italy to create 2D and 3D maps to analyze flooding. You will build skills in the following areas:
- Adding data to a map and editing features
- Creating a scene and analyzing raster data
- Applying 3D symbology
3D is how we see the world. Get started with 3D Web GIS today.
Article Discussion: