This blog article was originally published on Feb 24, 2018, and has been updated. The last previous update was December 11, 2022.
I was fast asleep when I was suddenly awakened by a public safety alert on my cell phone, instructing me to drop and seek cover. I knew immediately it was an earthquake, a familiar possibility living in Southern California. I’d ridden through a few signficant temblors, often feeling a shudder followed by a gentle rolling sensation as if a large hand had slapped the side of the house and the solid ground it sits upon was now a plate of jello.
This time I felt nothing, but with the alert I thought the temblor must be close by, but where? I learned later that there was a cluster of 16 quakes within a half hour starting at midnight near El Centro, Calfornia. The largest initially registered a magnitude above 5 (downgraded to 4.8), triggering the cell phone alert.
Make a quake map
ArcGIS Living Atlas of the World includes authoritative live feeds and other content that helps you learn more about earthquakes, faults, and what was experienced. Follow these steps to make your own earthquake map in a minute. The workflow is as follows:
- Make a map using the ArcGIS Living Atlas of the World Recent Earthquakes.
- Apply filters to display only the most recent quakes.
- Refine and finalize the map by changing the basemap and adjusting layer styles (optional).
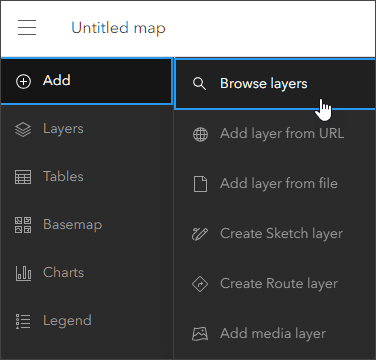
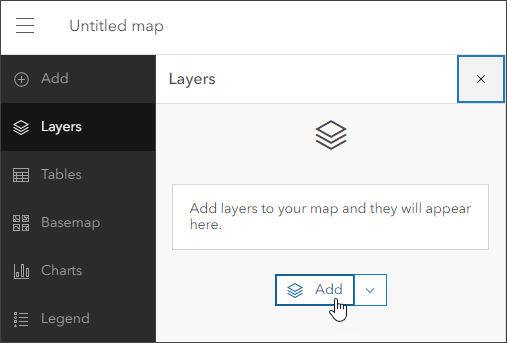
Step 1 — Sign in to your ArcGIS account and open Map Viewer. There are two ways to add layers from the Contents (dark) toolbar:
(1) Click Add, then Browse layers.
(2) Click Layers, then Add.
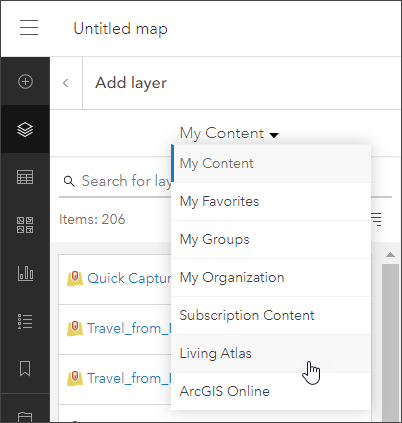
Step 2 — Choose Living Atlas from the Add layer drop-down.
Step 3 — Enter “earthquake” in search to locate the Recent Earthquakes layer. Click [+ Add] to add it to the map.

Step 4 — View the layer information to learn more.
Click the layer card to view the item information pane, providing quick access to the overview, description, details, and more.
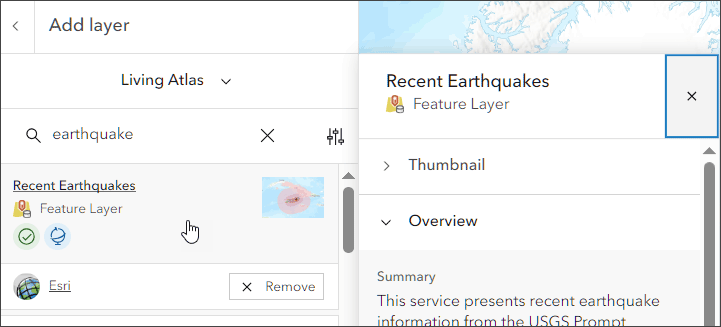
To open the full item pages, click View item details at the bottom of the pane.

From the Recent Earthquakes item details we learn that quakes are displayed by magnitude along with impact. Events are updated as frequently as every 5 minutes and are available up to 30 days, except for events of magnitude less than 3.0 (retained 3 days) and events of magnitude less than 4.5 (retained 7 days). Labeled quakes are those with a PAGER alert, a measure of the scope and impact of the event.
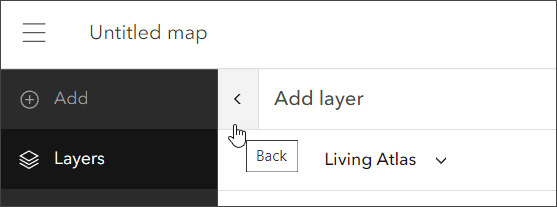
Step 5 — Click the left arrow to return to the Layers pane in the Contents (dark) toolbar.
The current map shows the magnitude (pun intended) of seismic activity in Southern California.
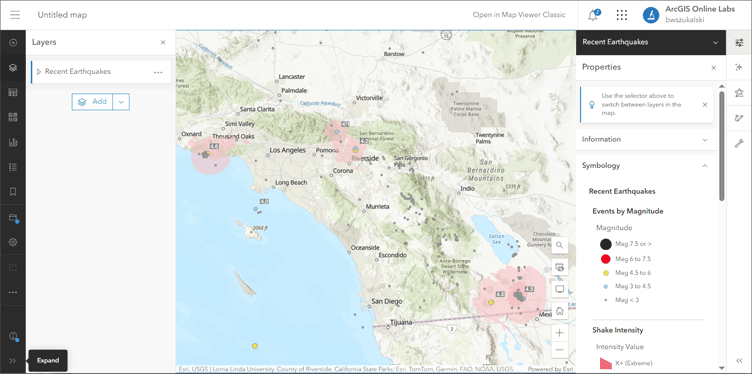
Step 6 — Click features on the map to view the layer pop-ups. Note that the layer is a group layer containing other layers.
When there are multiple features or layers found, you can cycle through the pop-ups using the arrows or feature pagination found at the bottom of the pop-up pane, or at the top of the pop-up when docked.
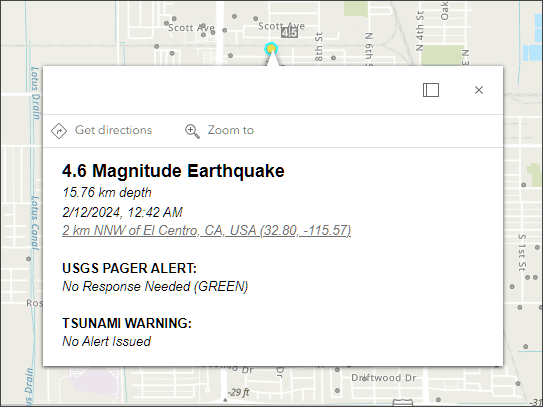
Recent Earthquakes includes includes a group layer with two sublayers that you can view: Events by Magnitude and Shake Intensity. The Events by Magnitude pop-up displays the magnitude, depth, date, time, PAGER alert status, and includes a link to the USGS event details.
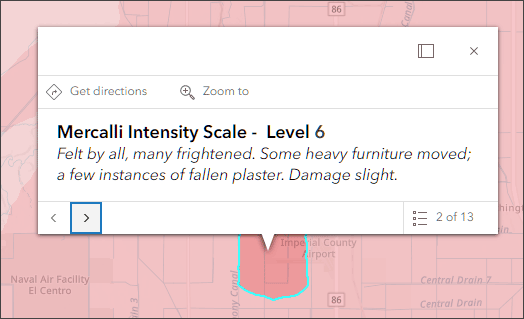
The Shake Intensity pop-up displays the Mercalli Scale intensity and a description of what was felt and any expected damage.
Congratatulations! You’ve made an earthquake map in a minute (or less) using ArcGIS Online and ArcGIS Living Atlas.
Doing more: Apply filters to find quakes of a specific magnitude
You can use filters to present a focused view of a layer in a map. The Recent Earthquakes layer shows events of all magnitudes. The next steps will filter for only those earthquakes having a magnitude of 4 or greater.
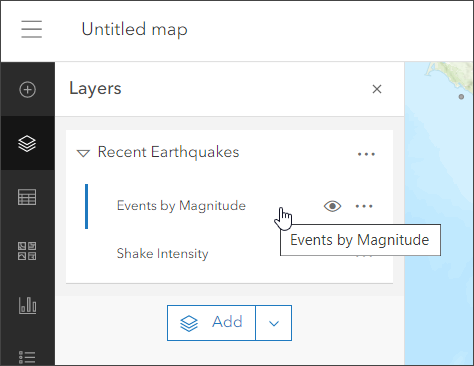
Step 7 — Open the Layers pane and select Events by Magnitude.
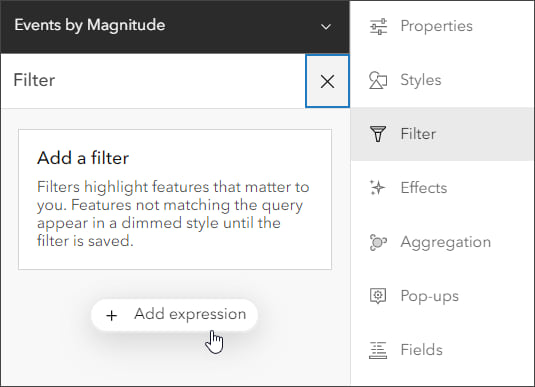
Step 8 — In the Settings (light) toolbar, click Filter. In the Filter pane, click Add expression.
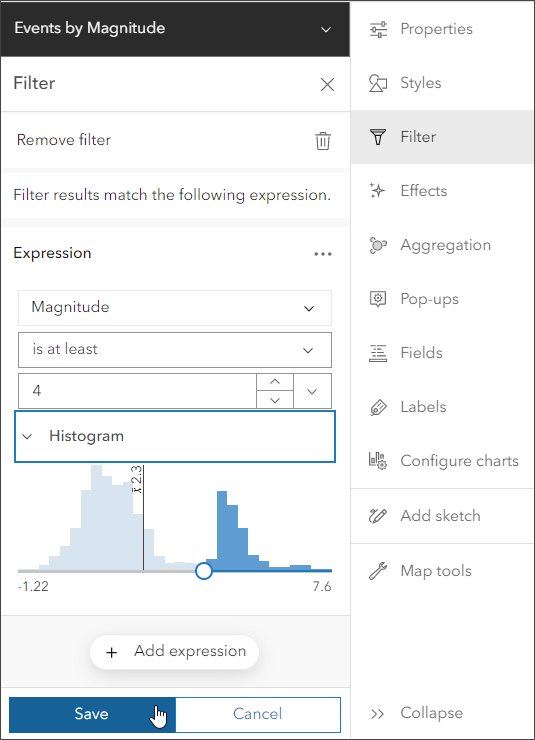
Step 9 — Create the filter expression.
Expressions use the general form of <field name> <operator> <value>. Use the drop-down menus to create the desired filter, in this case to find the quakes that are 4 or greater in magnitude.
Click the field selector and choose Magnitude. Click the operator selector and choose is at least. Use the histogram slider or value selector to choose 4.
When finished, click Save in the bottom left of the Filter pane.
Other filters you can try are:
- Magnitude is greater than 4
- Event Time in the last 1 week
To sync the display of the the two layers (Events by Magnitude and Shake Intensity), apply the same filter to both. Note that some of the field names will differ. Multiple filters and filter sets can be applied. For more information, see Apply filters.
Improve the map
World Topographic is the default basemap used in the map created above. This basemap seemed a little busy, competing with the Living Atlas Recent Earthquakes layer. A better map can be easily created with a few simple changes.
Recent Earthquakes is a group with two feature layers, letting you apply your own styling to highlight what you want. A different basemap can be chosen to complement and highlight the layer. You can add other layers, such as fault lines, to provide additional context and apply styles and effects to highlight features in your map. Experiment to see what delivers the desired effect. See the before and after comparison below.
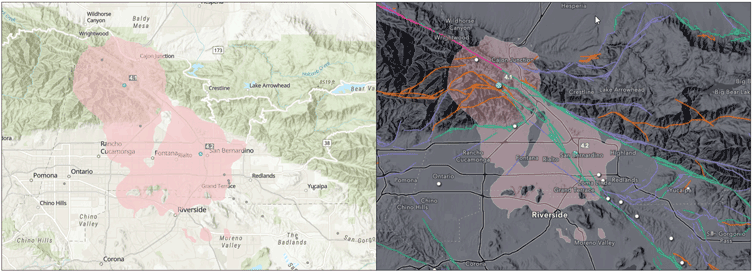
The following adjustments were made to make the map shown above on the right.
Basemap
- The World Topographic basemap was replaced with Human Geography Dark Map.
- Human Geographic Dark Label brightness was adjusted.
- The World Hillshade (Dark) layer from Living Atlas was added to the base layers, with brightness and contrast adusted.
- Human Geography Dark Detail, a reference layer in the basemap, was moved to the base so it would not draw on top of other map layers.
- Human Geography Dark Detail transparency was set to 25% so it would not compete with earthquake locations.
Layers
- Recent Earthquakes – Events by Magnitude style for magnitude 3 or less symbols was increased in size and changed to white (instead of gray) to provide more “pop.” All earthquake magnitude symbols were increased in size for better visual display.
- Recent Earthquakes feature display order was changed to Magnitude to ensure that the greatest magnitude quake is always on top.
- Recent Earthquakes – Shake Intensity was changed to 70% transparency to harmonize with the basemap.
- Living Atlas Earthquake Faults and Folds in the USA was added to the map, transparency was adjusted to 25% and moved to the Recent Earthquakes group layer, below the earthquake layers so as not to compete with earthquakes. Scale dependencies were set to range from County to Room to create a more pleasing visual display at small scales and a slight bloom effect was applied.
The steps for making these adjustments are detailed in Help and in other blog articles. See the More information links in the section below.
More information
For more information see:
- Browse Living Atlas layers (Help)
- Feature layers (Help)
- Change style (Help)
- Choose a basemap (Help)
- Configuring custom basemaps using Living Atlas layers (Blog)
- Set the feature display order (Help)
- Set transparency and visible range (Help)

Commenting is not enabled for this article.