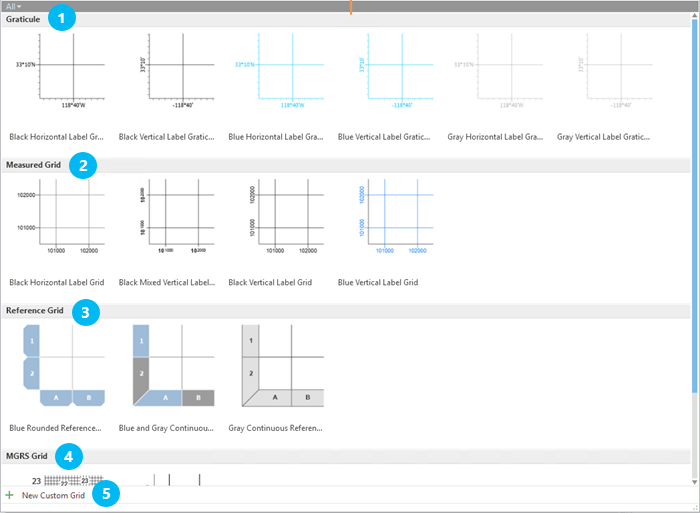
I often get asked about adding grids to ArcGIS Pro layouts. People want to show latitude and longitude, projected coordinates, township and range, and more using a grid. As of Pro 2.6, there are 5 types of grids that can be added to a layout map frame: graticules, measured grids, MGRS grids, reference grids, and custom grids. That’s a lot! Each of these grids does something a little different. So, which is right for your project?
Graticules
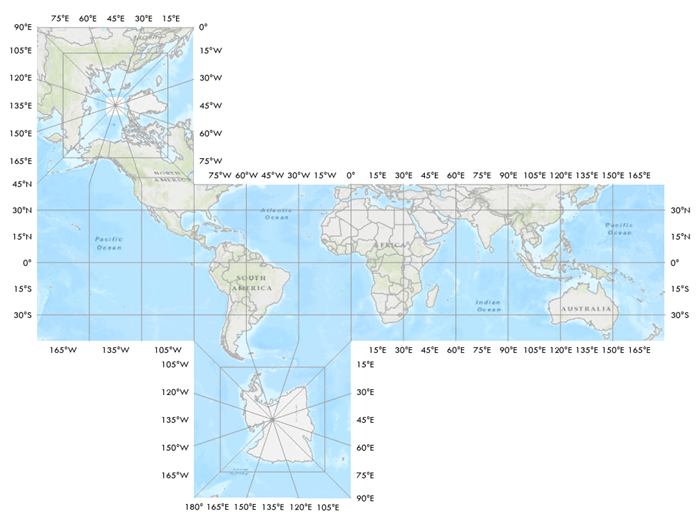
Graticules show lines of latitude and longitude. It doesn’t matter if your map is in a projected coordinate system or a geographic coordinate system, the graticule will show the latitude and longitude values. Personally, I like to use graticules when I’m creating world map. Also, since multiple grids can be added to a single map frame you can include a graticule to show latitude and longitude AND a measured grid as well. So, what’s a measured grid then?
Measured Grids
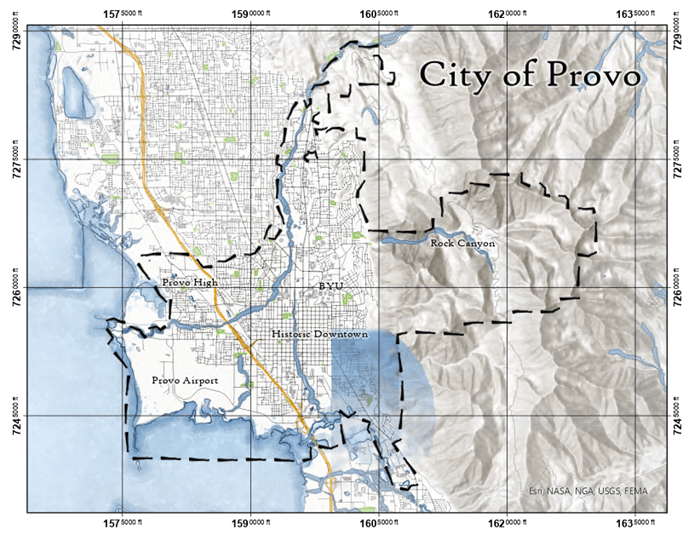
Measured grids show the projected coordinates (UTM coordinates, state plane coordinates, etc) for a map. I find measured grids to be useful on larger scale maps, especially when the projected coordinates are a better-known reference for the map reader than latitude and longitude. When you add a measured grid, it defaults to the same projection as your map, but you can change the grid to use a different coordinate system than your map.
Important Note: If you change the projection of your map and you want your measured grid to reflect that, you must manually go and change the grid coordinate system, it will not update automatically.
MGRS Grids
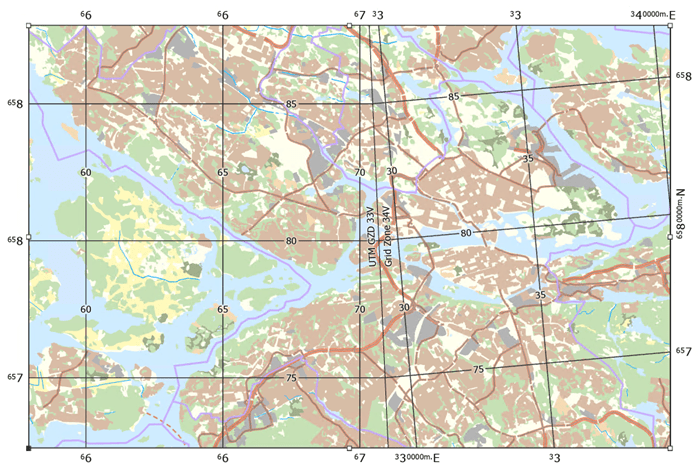
MGRS (Military Grid Reference System) grids are special measured grids showing UTM coordinates. The UTM coordinate system has some additional grid components, like 100,000m Grid Zone Labels and Grid Zone Designation Labels. If you need to provide more context for UTM coordinates, an MGRS grid may be right for you. MGRS grids also work for some industry specifications.
When you add an MGRS grid from the default grid styles, Pro automatically determines what UTM zone your map is in and sets the grid to that coordinate system (if your map falls in more than one zone, only one is selected). If you change the grid’s coordinate system to a non-UTM system some components, like Grid Zone Designation Labels, will be removed because they are no longer applicable. Conversely, if you inserted a regular measured grid and change the coordinate system to a UTM system these components become available.
Reference Grids
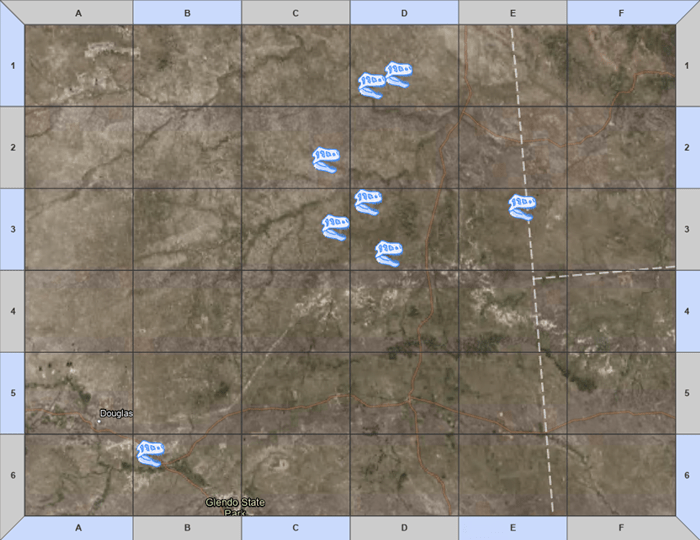
I consider reference grids to be the most unique grid type. Why? Because they aren’t tied to coordinates. Instead, reference grids divide a map evenly into rectangles. If you pan or zoom your map the reference grid stays the same. Also, reference grids usually have tabs that hold the labels. The look kind of like a bingo sheet, or my third-grade multiplication tables.
Reference grids are useful when you need to divvy up your map visually. For example, you can use them to point out features to map readers by referencing the box the features are in.
Custom Grids
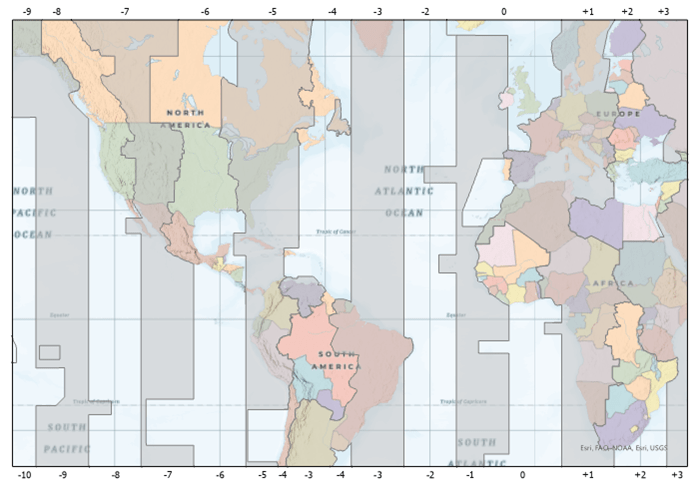
For any scenario not covered by the above grid types, custom grids are likely the answer. Custom grids are based on a line or polygon layer in your map. The layer becomes the grid line component, then you can label the lines using any field in the layer, or an Arcade expression. One common use for custom grids is to show townships and ranges from the U.S. Public Land Survey System. The fun thing about custom grids is that any line or polygon layer can be used, so you can get creative. I’ve used time zones, countries, states, grid indices, and more!
I’ve just briefly introduced each grid type. The components for each type, as well as the many ways to customize grids, are too long for one blog post. If you are interested in learning more, check out the ArcGIS Pro help:

Article Discussion: