This blog article was originally published on September 25, 2012, and has been updated. The last previous update was May 30, 2024.
Crafting a great pop-up is essential for making great web maps. Use color in your pop-up text elements to apply more meaning or emphasis on attributes, or clarity to what your map is showing.
Examples
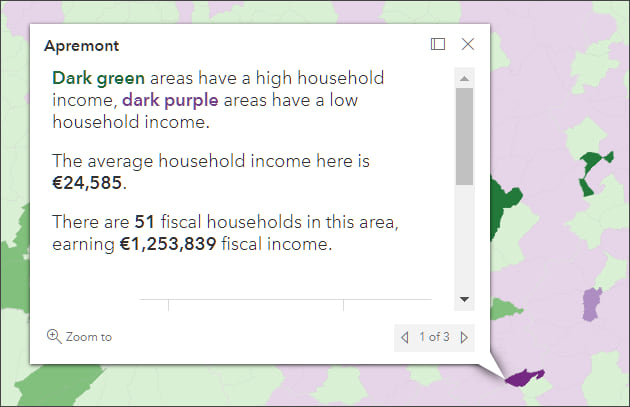
The example shown below uses color to emphasize specific bits of information, in this case the travel time shown in the analysis, the number of residents served, and the percentage of the total population.

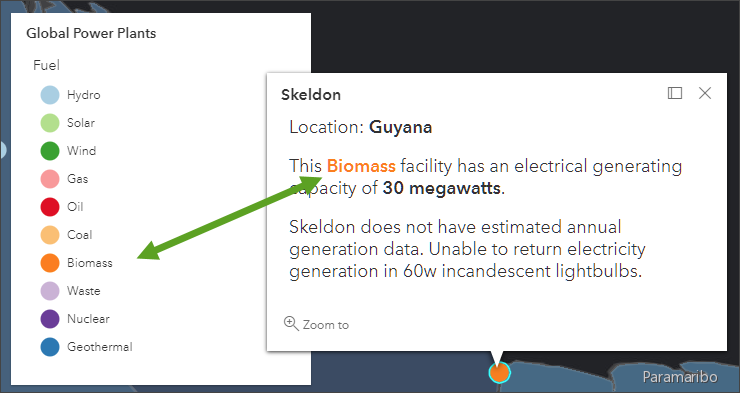
Color can also be used in a pop-up to echo the legend and clarify the map style. The use of color and text helps the viewer understand what they are seeing.
Below, the color in the pop-up emphasizes the unique value of the feature. Color matching was accomplished using ArcGIS Arcade. See the example at the end of this blog article.
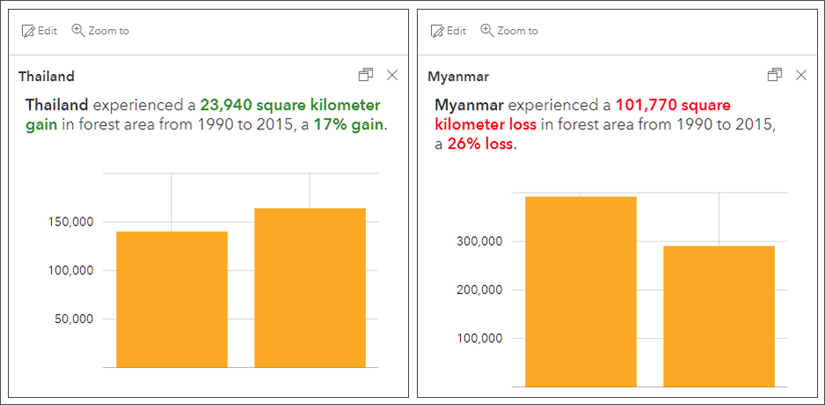
Using Arcade, text in pop-ups can be displayed with colors based on the evaluation of expressions. In this example, if there was a loss of forest area red text is used. If an increase in forest area, green text is used.
Add color to text elements
Adding color to text in pop-ups can be accomplished by applying a color to the selected text, field, or Arcade expression. See Pop-ups: text element essentials to learn the basics of working with text content in pop-ups.
In the text editor, select the text, field, or expression and click the Font Color button, then choose any color. To apply a specific color, enter the hexadecimal value of the color you want. Colors used previously are saved and can be chosen again.
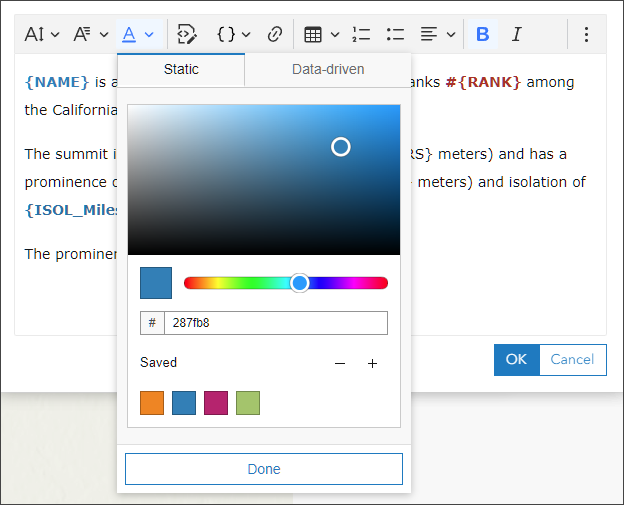
Colors can be static (chosen in the color picker) or can be data-driven using an attribute or an expression that returns a hexadecimal color value. See the example in the next section.
The example shown below uses Static color. The peak name, elevation, prominence, and isolation are blue. The peak rank is red. The Arcade expression, which returns a ranking of prominence (Low, Moderate, High), is brown.

Use Arcade expressions to add color
Arcade is an expression language that is supported across ArcGIS. It can be used to perform calculations, manipulate text, and evaluate logical statements.
In pop-ups, Arcade can be used in two ways; to create expressions in text elements that can be evaluated like fields, or as separate elements that return a complete block of content.
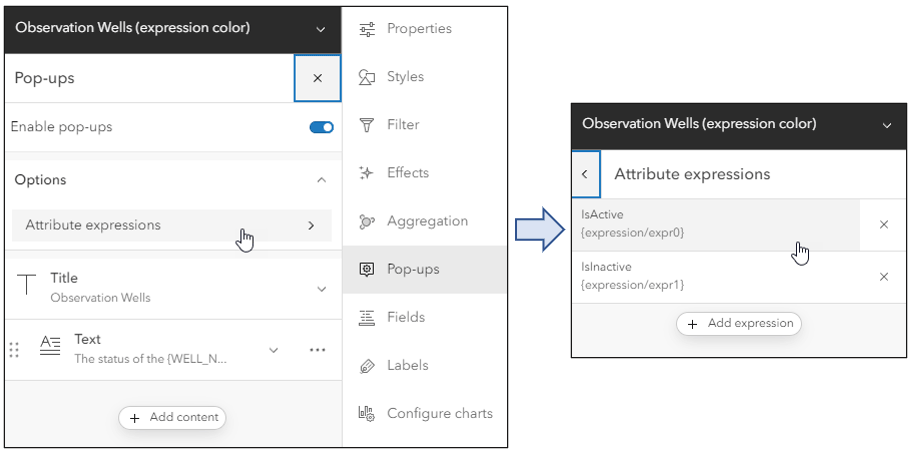
The Arcade pop-up color example map includes two layers presenting the the techniques discussed below. The attribute expressions can be found by opening the Layers pane in the Contents (dark) toolbar, selecting a layer, then clicking Pop-ups in the Settings (light) toolbar. Click Attribute expressions in the Options pane to see a list of expressions, then click an expression to view it in the Arcade editor.
Use expressions and static color
Follow along by viewing and selecting the Observation Wells (static expression color) layer in the example map.
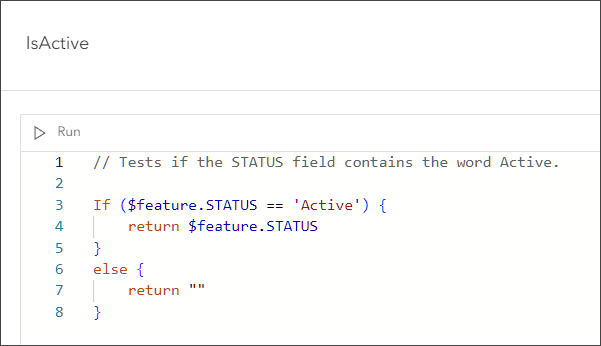
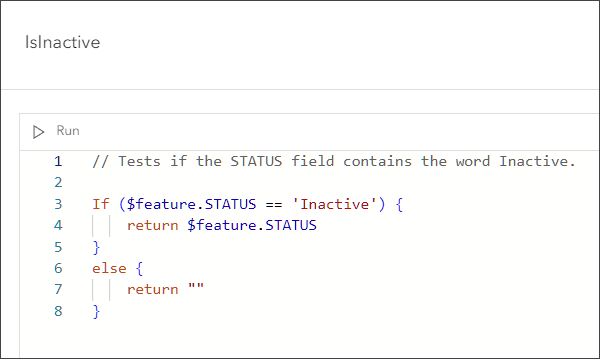
To accomplish the goal of coloring the text to show the well status, two expressions were constructed to evaluate the {STATUS} field which contains one of two attribute values; Active or Inactive.
The first expression, titled IsActive, evaluates whether the field for the feature contains the word Active.
The second expression, titled IsInactive, evaluates whether the field for the feature contains the word Inactive.
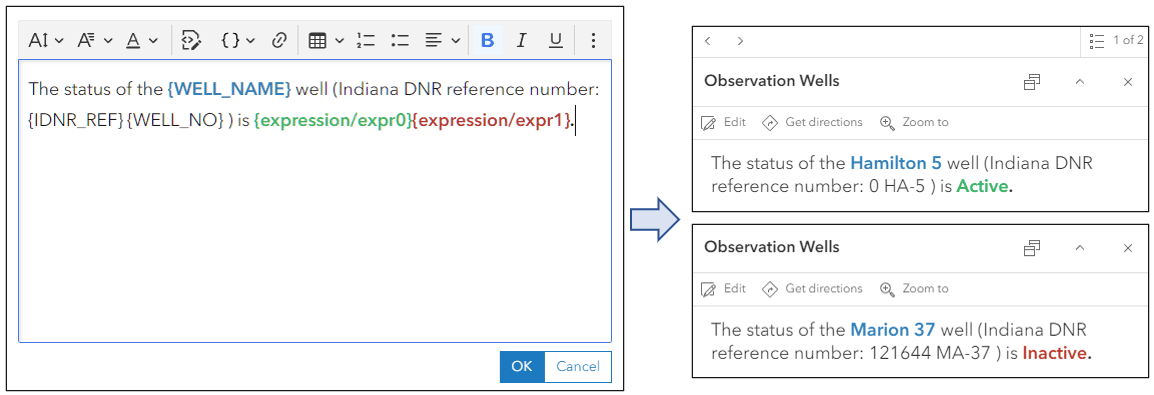
In the Text element editor, a static color (chosen from the color picker) is applied to the expression, which is treated like a field. While the logic here may initially seem confusing, we are creating two expressions which return the string value Active or Inactive. If the expression does not evaluate to True, Null is returned. The results are shown below.
Use expressions for data-driven hexadecimal color
Follow along by viewing and selecting the Observation Wells (data-driven hexadecimal color value from expression) layer in the example map.
You can also use expressions to return the hexadecimal color value to change pop-up text to match unique symbol colors. The Arcade expression shown below checks the STATUS field and returns the hex color value; green when active, red when inactive. If you have more unique values, just extend the expression for all possible values.
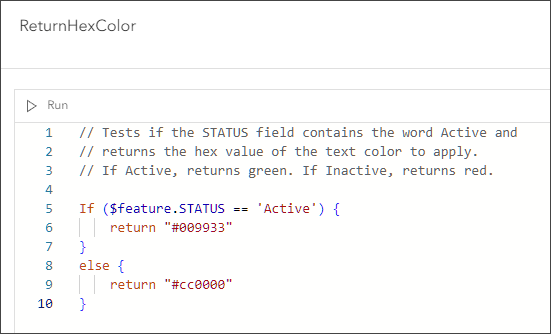
Tip: Make sure to include the hash symbol (#) in the hexadecimal number.
Select the text in the Text element editor, then click the Font Color tool. Click Data-driven (the default is Static), then select the Arcade expression to return the hexadecimal color.
Curly braces { } will appear around the Font color tool and the selected text will be outlined. Using hex values you can set the color for the entire text block (as is done in this example), or individual words, fields, or expressions.
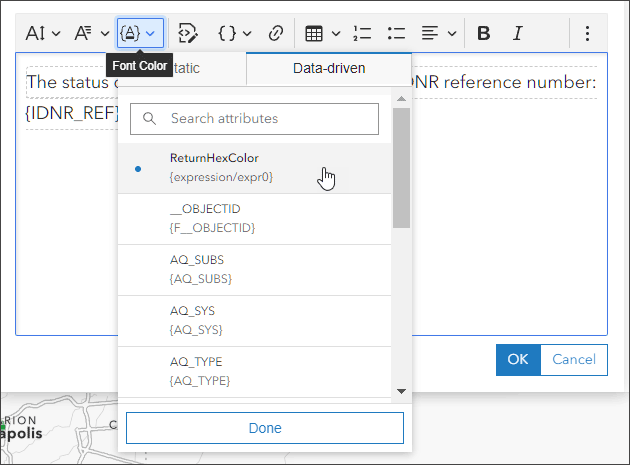
The text color in the pop-up is now set by the expression and matches the feature color.

Color tips
As with many visual techniques, use pop-up color sparingly. Too much color can be distracting and detract from the overall map aesthetics.
Avoid light or pale colors, they are difficult to see on the white pop-up background. Bold text can help to highlight the color differences.
If your map is intended for use in apps and app builders, consider the theme color of the app, which also changes the pop-up background color, to ensure best results.
More information
For more information, see the following:
- Pop-ups: the essentials (ArcGIS Blog)
- Pop-ups: text element essentials (ArcGIS Blog)
- Get started using ArcGIS Arcade (Learn ArcGIS)
- ArcGIS Arcade (Documentation)

Commenting is not enabled for this article.