Growing up in the Mojave Desert I often longed to be somewhere else—somewhere greener. As a child, I played in the foothills of the San Bernardino mountains and, naturally, wondered what was on the other side. I liked to imagine a dark, raging ocean.
Now, as a geologist, the desert is a wonderful puzzle. It contains chapters from the story of this continent and those worlds that came before it. The chapters have been reordered, pages torn, and many are missing; although, the dry climate has exposed and preserved rocks that tell of shallow tropical seas and white sand beaches. In the late afternoon, the wind streams over lonely outcrops of limestone that once formed ancient reefs at the edge of ancestral North America. As it turns out, almost everywhere was once a beach.
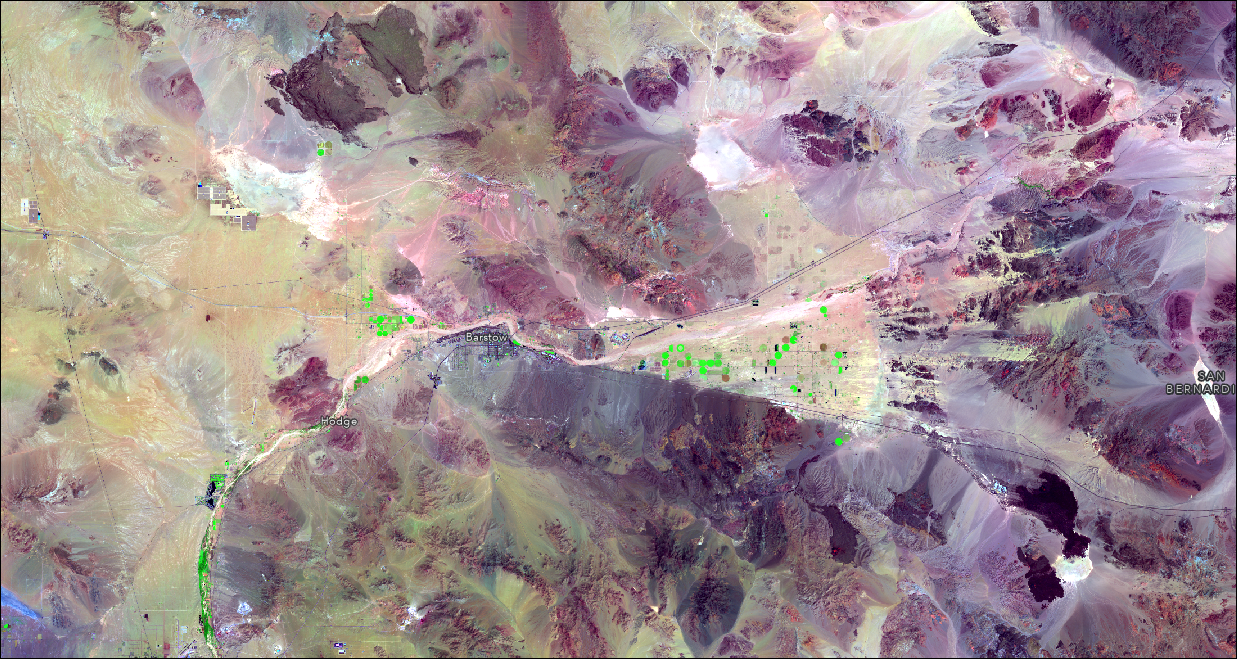
The Mojave is a great location for armchair geology. Pull in Landsat imagery from Living Atlas of the World in ArcGIS Pro, and you’ll find a rich palette of brown, maroon, and swirls of ivory. Contrasts in rock type are accentuated in false color, where alluvial aprons flow into and against one another. White smudges form the remnants of ancient lakes, and the dark blotches record periods of volcanism in the desert.
Imagine standing on the marshy, evening shores of Lake Manix, while to the southeast, a fire fountain lights up the sky and basalt sears the landscape. The lake, of course, is no longer there, but we can see its imprint to the east of Barstow, CA.
Spectral Unmixing
The geologic timescale is unimaginably deep. I would love to slide down through the epochs, but let’s start small. Fifteen thousand years ago—hardly a blip even in recent geologic time—the Mojave Desert was a wetter, cooler place. A system of perennial lakes stretched across the region, fed by the Mojave river to the south and the Owens and Amargosa rivers to the north. The shadows of this system are apparent in the bright salt crusts that remain, although the true extent has been dulled by erosion.
At this point, you’re wondering, “When do we get into GIS?” Well, I thought I would use the new Linear Spectral Unmixing tool, available in Pro with an Image Analyst or Spatial Analyst extension, to map the range of ancient lake and river deposits and imagine the Mojave as it was. If you aren’t interested in rocks or dirt, the results, if nothing else, are mesmerizing.
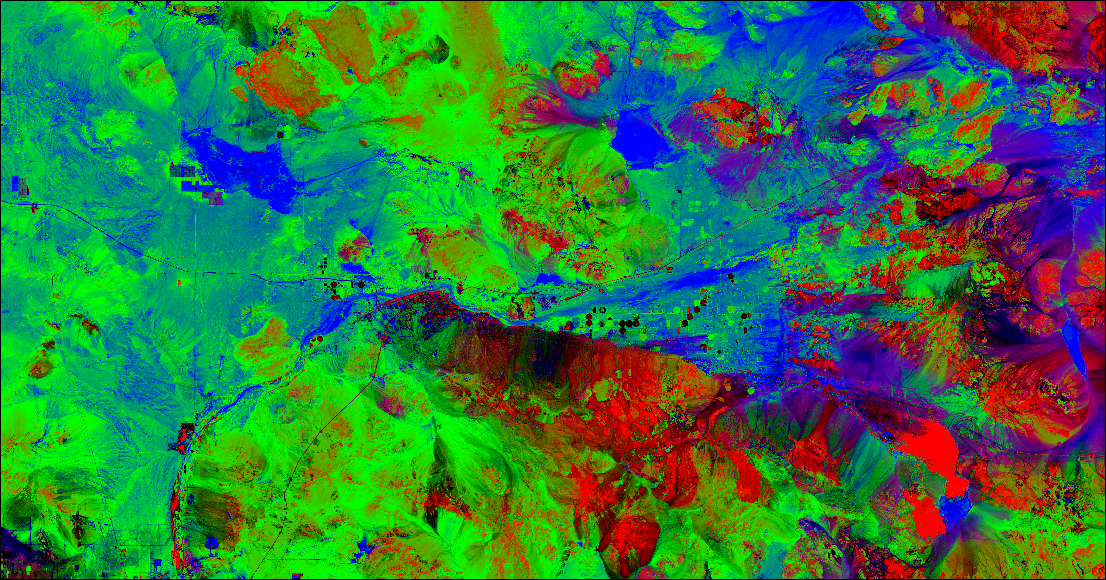
The utility of this tool lies in land cover classification, particularly for coarse-resolution imagery like Landsat. Often, individual pixels capture multiple land cover types, and it’s difficult to map mixed areas or quantify land cover change. The Linear Spectral Unmixing tool untangles the spectral signatures in each pixel and resolves the contribution from each land cover class.
Training and Psychedelic Results
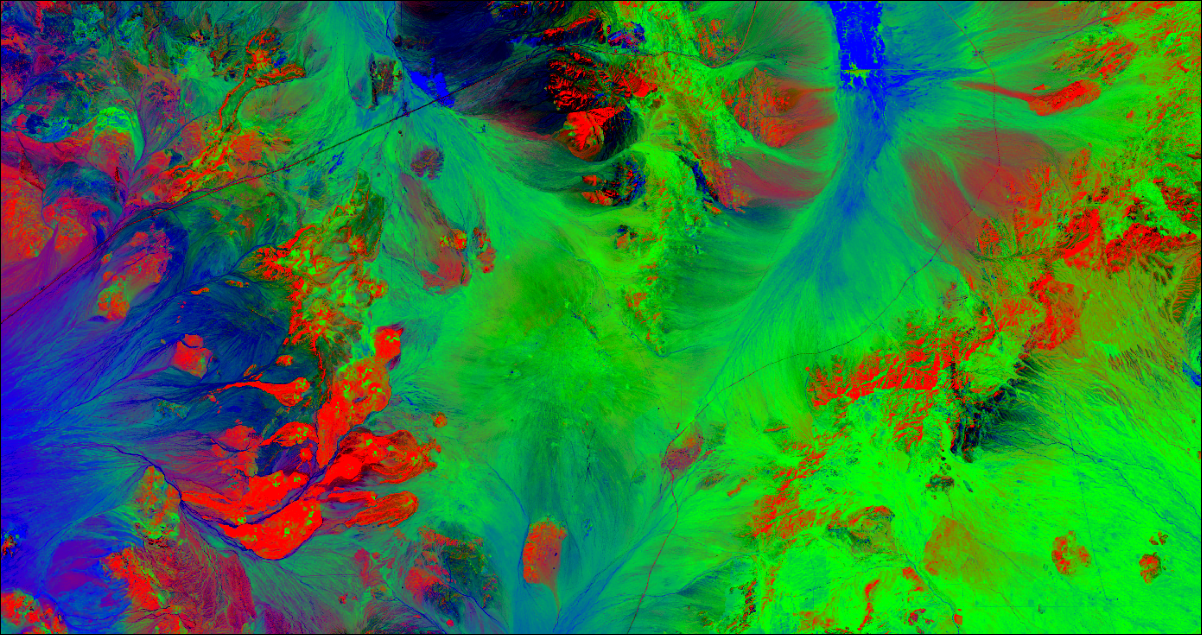
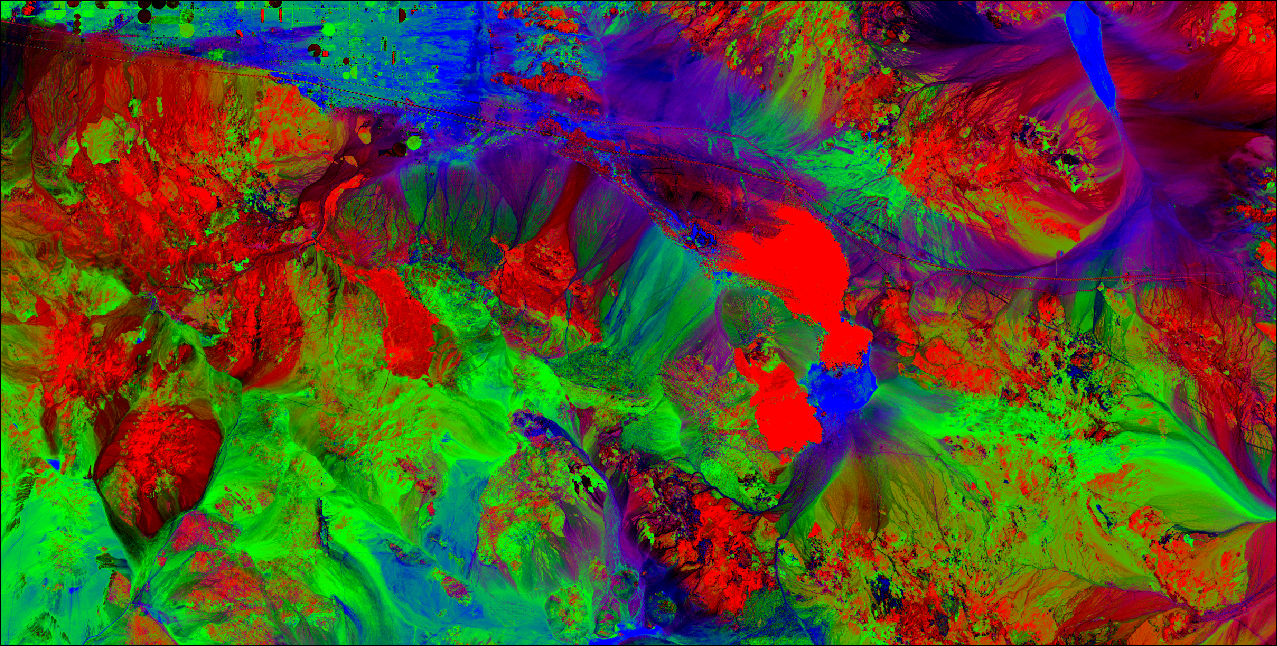
To generate the raster above, I first used the Training Samples Manager to build a classification schema that defined three broad rock or surface classes: granite, basalt, and lake deposits. For a bit of unsolicited geologic background, granite generally occupies the higher end of the silica range, while basalt sits toward the low end and is rich in iron and magnesium. This mineralogical difference dictates whether you get an explode-y volcano, like Mount St. Helens, or a flowy volcano, like Mauna Loa.
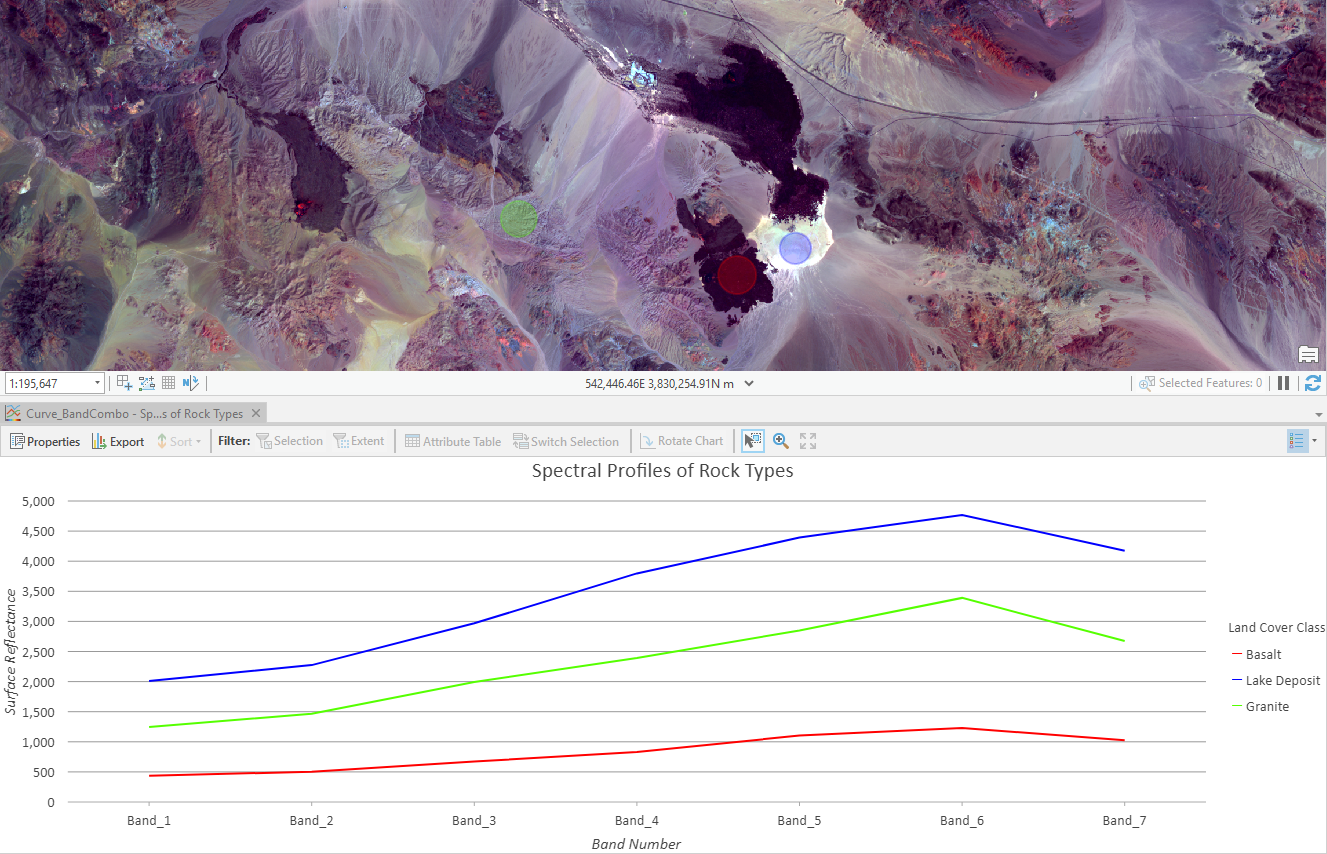
I wanted to test whether this schema could also capture the sediments derived from these rocks, since they should have similar mineral compositions and, therefore, comparable spectral signatures.
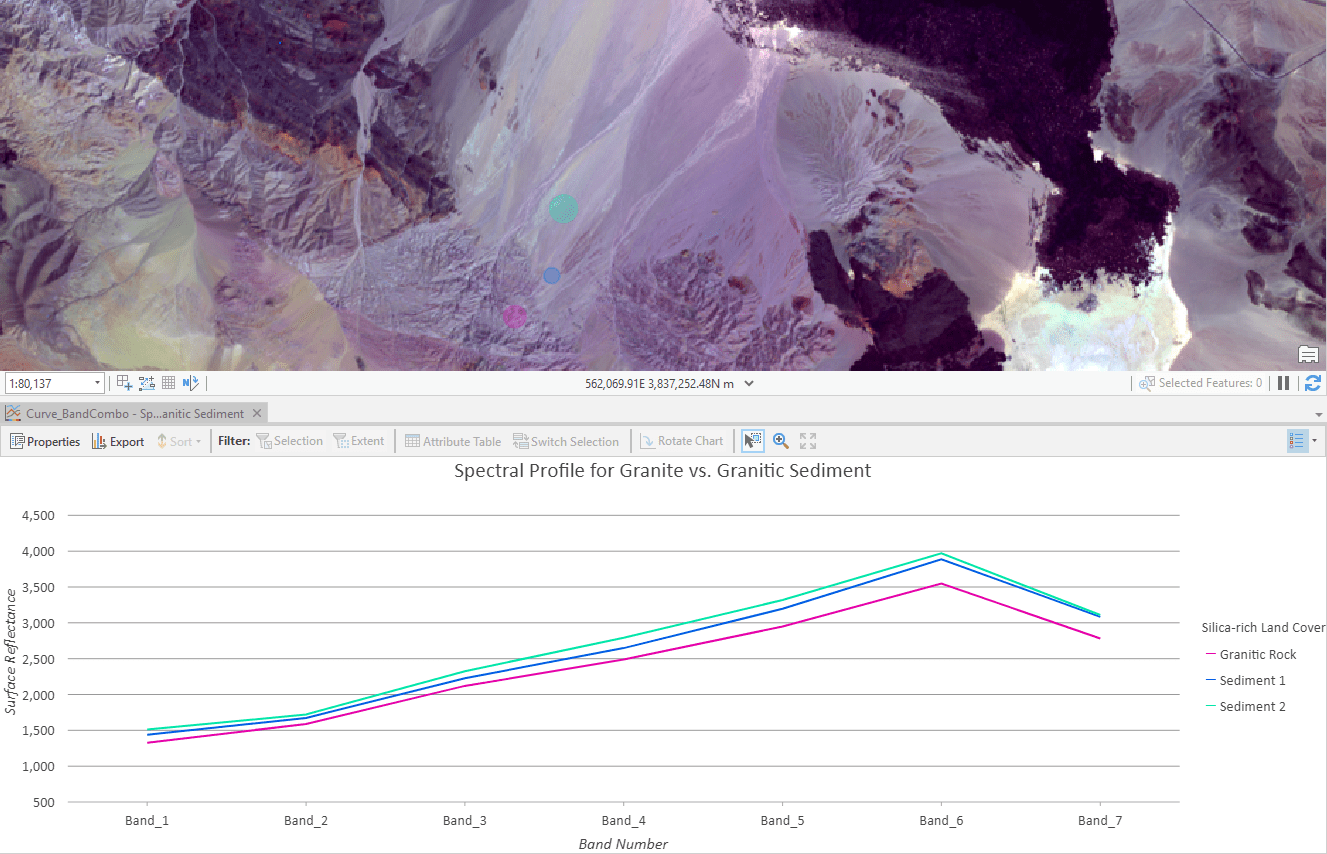
I selected my training samples from areas of known rock type using a geologic map for reference. Geologists love maps, by the way. Each fall and spring, new geology students traipse into the field with a blank map, a Brunton Pocket Transit, and cargo pants full of colored pencils. They (hopefully) emerge with a colorful portrait of geologic structure. These results are reminiscent of a 3-band geologic map . . . sort of.
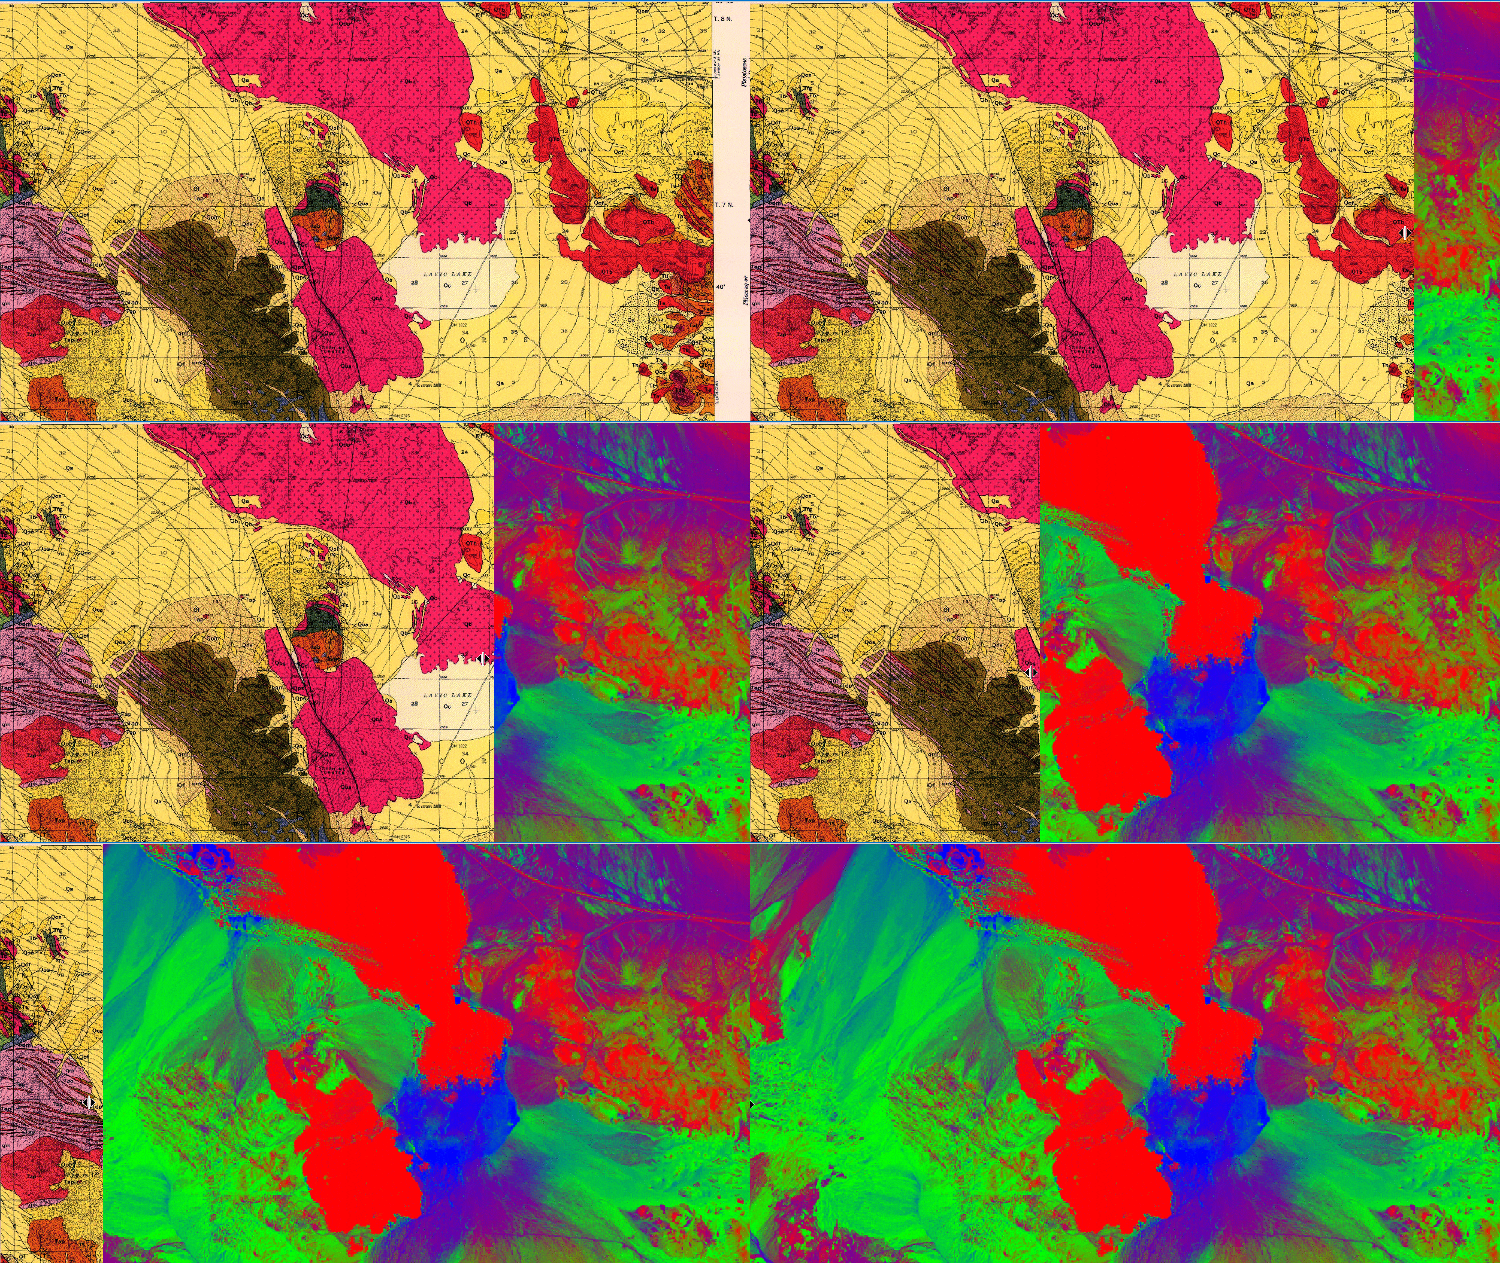
Basaltic, iron-bearing rocks and sediment appear red, whereas silica-rich surfaces glow in neon green. Lake and alluvial sediments are appropriately assigned to blue and are generally composed of fine-grained sand, clay, silt and salts. Spectrally pure endmembers—lava flows, granite mountains and dry lake beds—are thick brushstrokes and dollops of color. Mixed pixels occupy valleys, where alluvial flows merge.
Extracting Lake Sediments
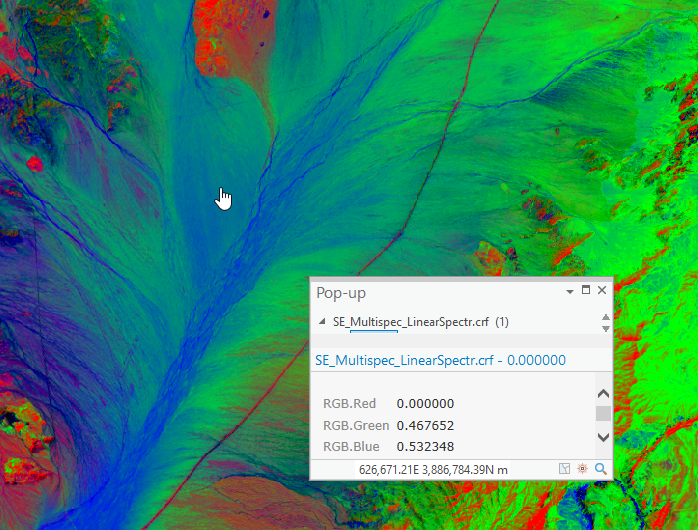
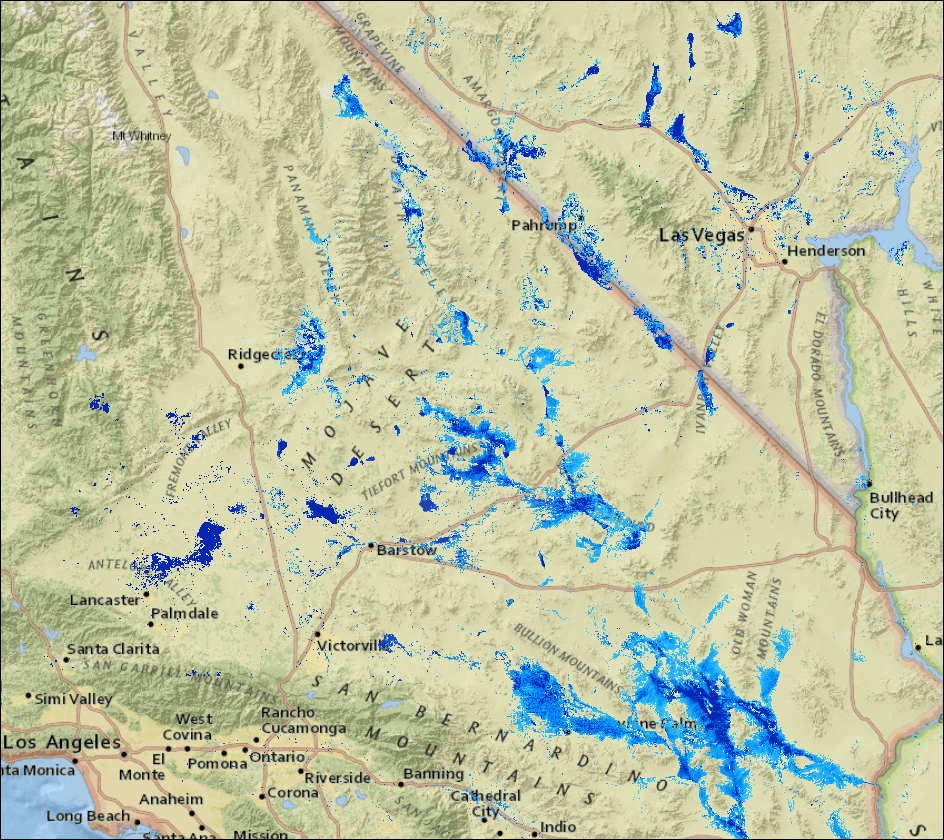
It’s difficult to visually discern the makeup of mixed zones and nearly impossible on a per-pixel basis. With the unmixed raster, however, I can click on any pixel and a pop-up will list the fractional composition for that pixel. From here, I can filter and extract pixels according to the fractional land cover values to create a map of ancient lake sediments. To do this, I used the Extract Bands and Mask functions to extract the “Lake Deposits” band and display only those pixels with a fractional value of 60% or greater. Once I refined my workflow, I chained the functions together in a raster function template to automate processing for the remaining Landsat scenes.

A Wetter Desert
Finally, here’s how the Mojave may have looked during the last glacial period. Not all the lakes and drainages existed at the same time, but it’s fun to imagine an environment very different from the one we know today. This is the heart of historical geology—piecing together Earth’s past and resurrecting long-extinct places.
Well, that about does it. Thanks for sticking with me to the end. If you enjoyed this foray into Earth history in ArcGIS Pro, stay tuned for future geology-themed posts.
Article Discussion: