With the release of ArcGIS Pro 2.4, you can now use schedule-based public transit data with Network Analyst. You can answer questions like “What area of town can I reach within 30 minutes by walking and taking transit?” and “What is the optimal location for a new clinic in Manhattan?” You can also perform analyses for transportation and urban planning, public health, economic development, and so on.
The best place to start is with this tutorial. The rest of this blog post will give a quick overview of the new features and how they work.
To solve network analysis problems with public transit, you need to create a network dataset that includes your public transit schedule data. To do that, you need to put your transit schedules into a set of feature classes and tables defined by the new public transit data model. You can do this manually, but it’s far easier to make them automatically using the new GTFS To Network Dataset Transit Sources and Connect Network Dataset Transit Sources To Streets tools. Once you’ve created the data model feature classes and tables, you can create a network dataset with them. In future releases, you should be able to create and configure your network dataset manually in ArcGIS Pro, but for now, use the template provided with tutorial. This is easier anyway, since it will configure everything for you with recommended settings.
Your network dataset must use the new Public Transit evaluator. An evaluator defines a calculation that determines the cost, such as travel time or distance, to traverse a particular edge, junction, or turn in the network. The Public Transit evaluator calculates the travel time along a public transit line segment based on the scheduled public transit service. This travel time includes the wait time until the next scheduled transit trip begins plus the travel time along the transit line segment from one end to the other. If you use the template provided with the tutorial, the network dataset will be automatically configured to use this evaluator.
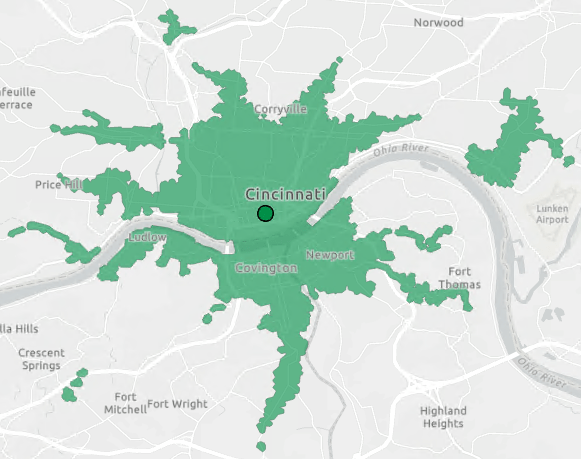
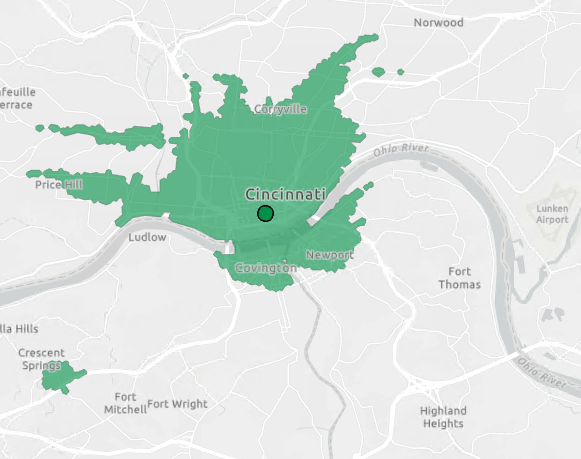
Once you have created your network dataset, you can solve Network Analyst problems just like normal. But, be sure to designate a start time and date for the analysis, or else it won’t use the public transit. The images below show an example of a Service Area analysis in Cincinnati showing the area reachable within 30 minutes by public transit and walking at two different times of day.


If you want to take your analysis even further, check out these downloadable tools that help you perform transit-specific network analysis, such as calculating accessibility and visualizing service areas over time.
Note: If you’re familiar with the downloadable Add GTFS to a Network Dataset toolbox for ArcMap, this new functionality in ArcGIS Pro replaces it. The downloadable tool is now deprecated and will not be updated in the future.
Article Discussion: