In our March, 2019 ArcGIS Online release, we’ve just added seven new visually stunning starter infographic templates to help you summarize your data and analysis.
These templates are available in the following product areas:
As a fun way to cycle through their functionality and look and feel, here’s an infinitely looping band of animated GIFs showing the seven templates.
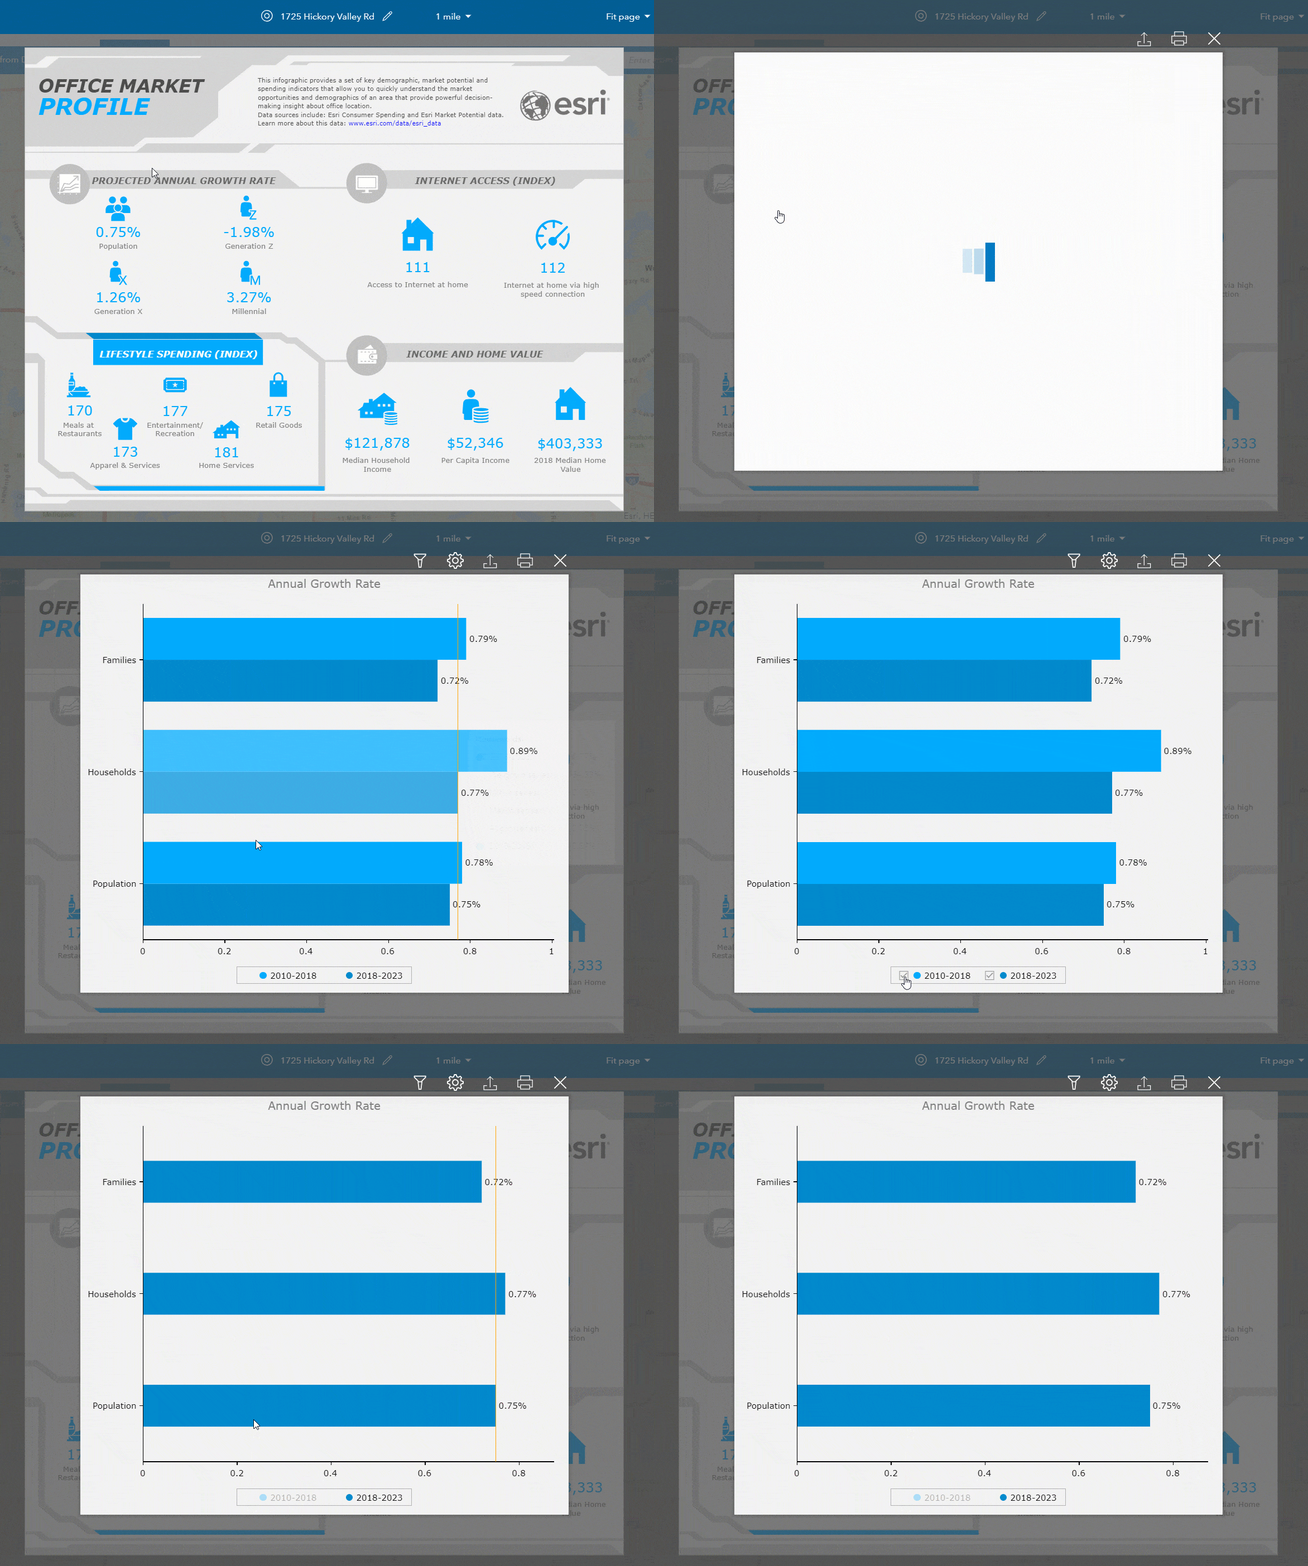
(1) Office Market Profile
Understand market opportunities with indicators for demographic, market potential, and spending data.
Potential industry use: Franchise Acquisition
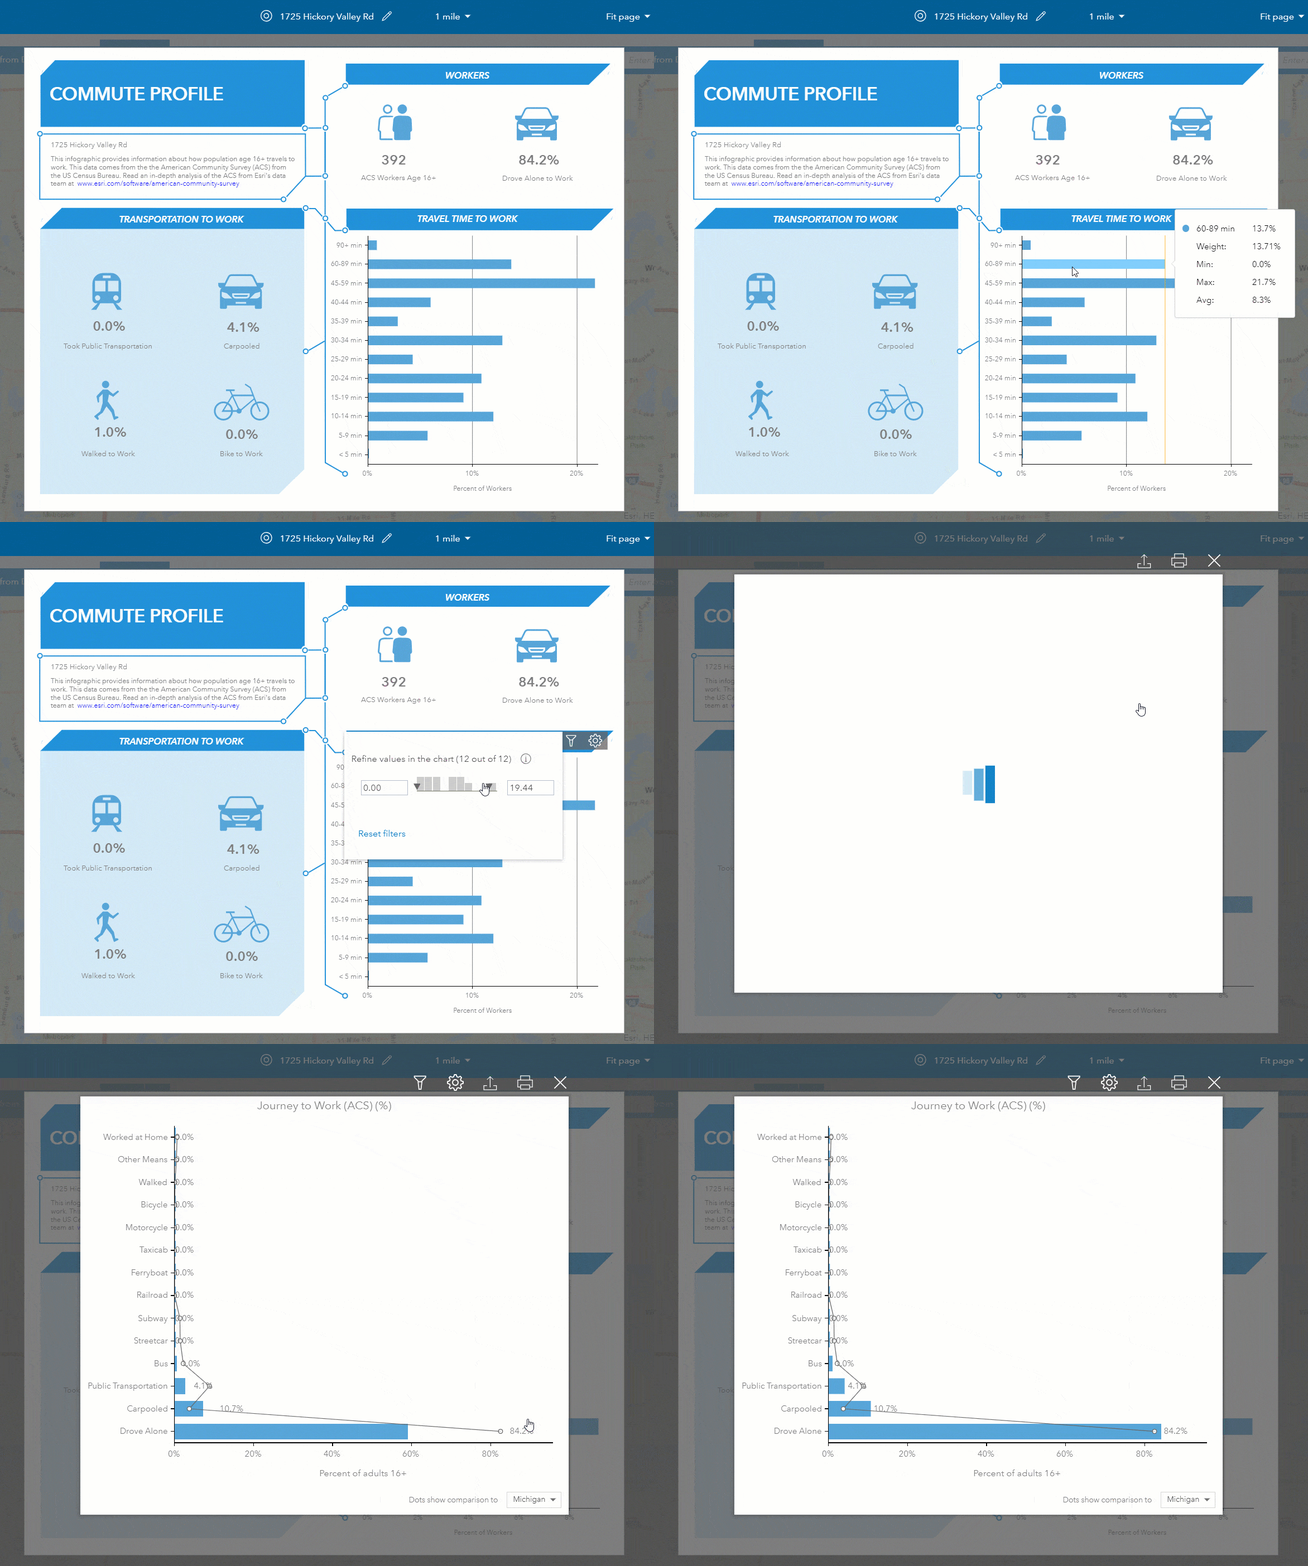
(2) Commute Profile
Information about how people, ages 16-and-up, travel to work.
Potential industry use: Urban Planning Agency
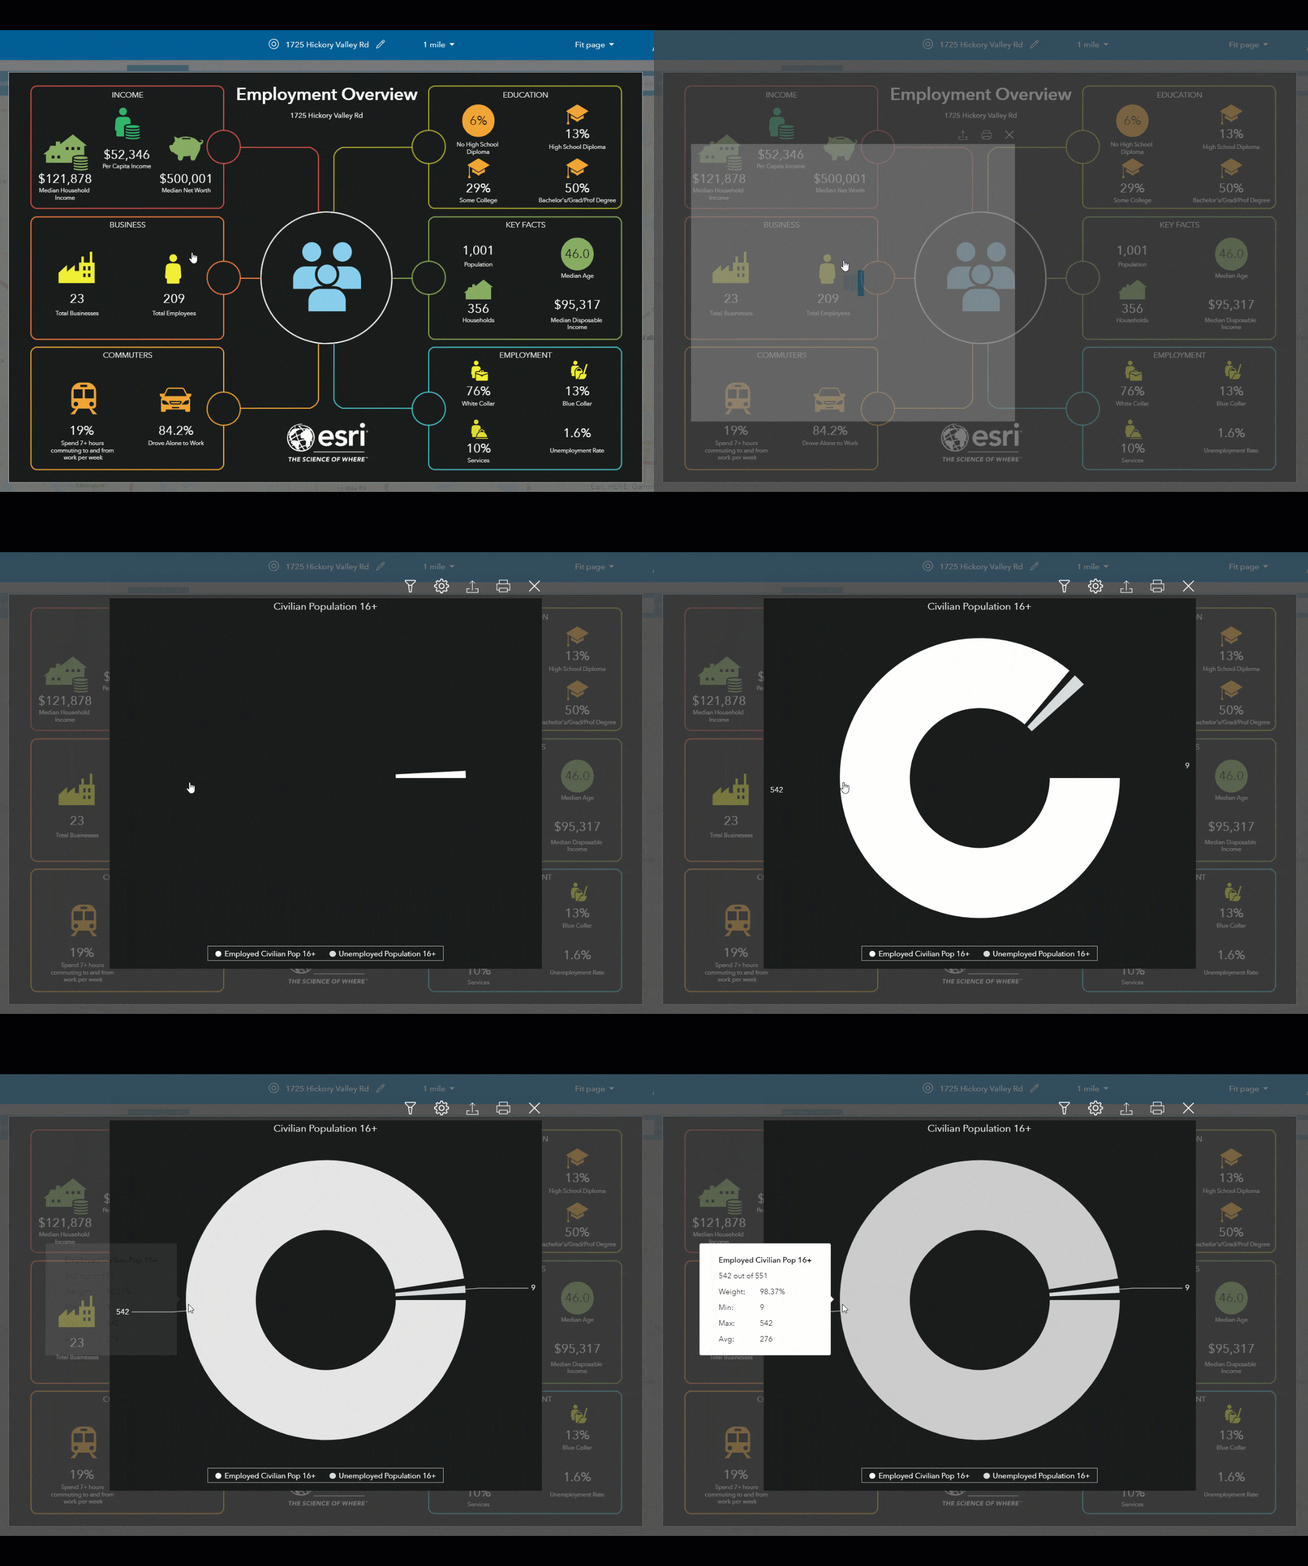
(3) Employment Overview
See key employment stats in an area with income estimates, businesses and employees, education, commuters, and other facts.
Potential industry use: Economic Development
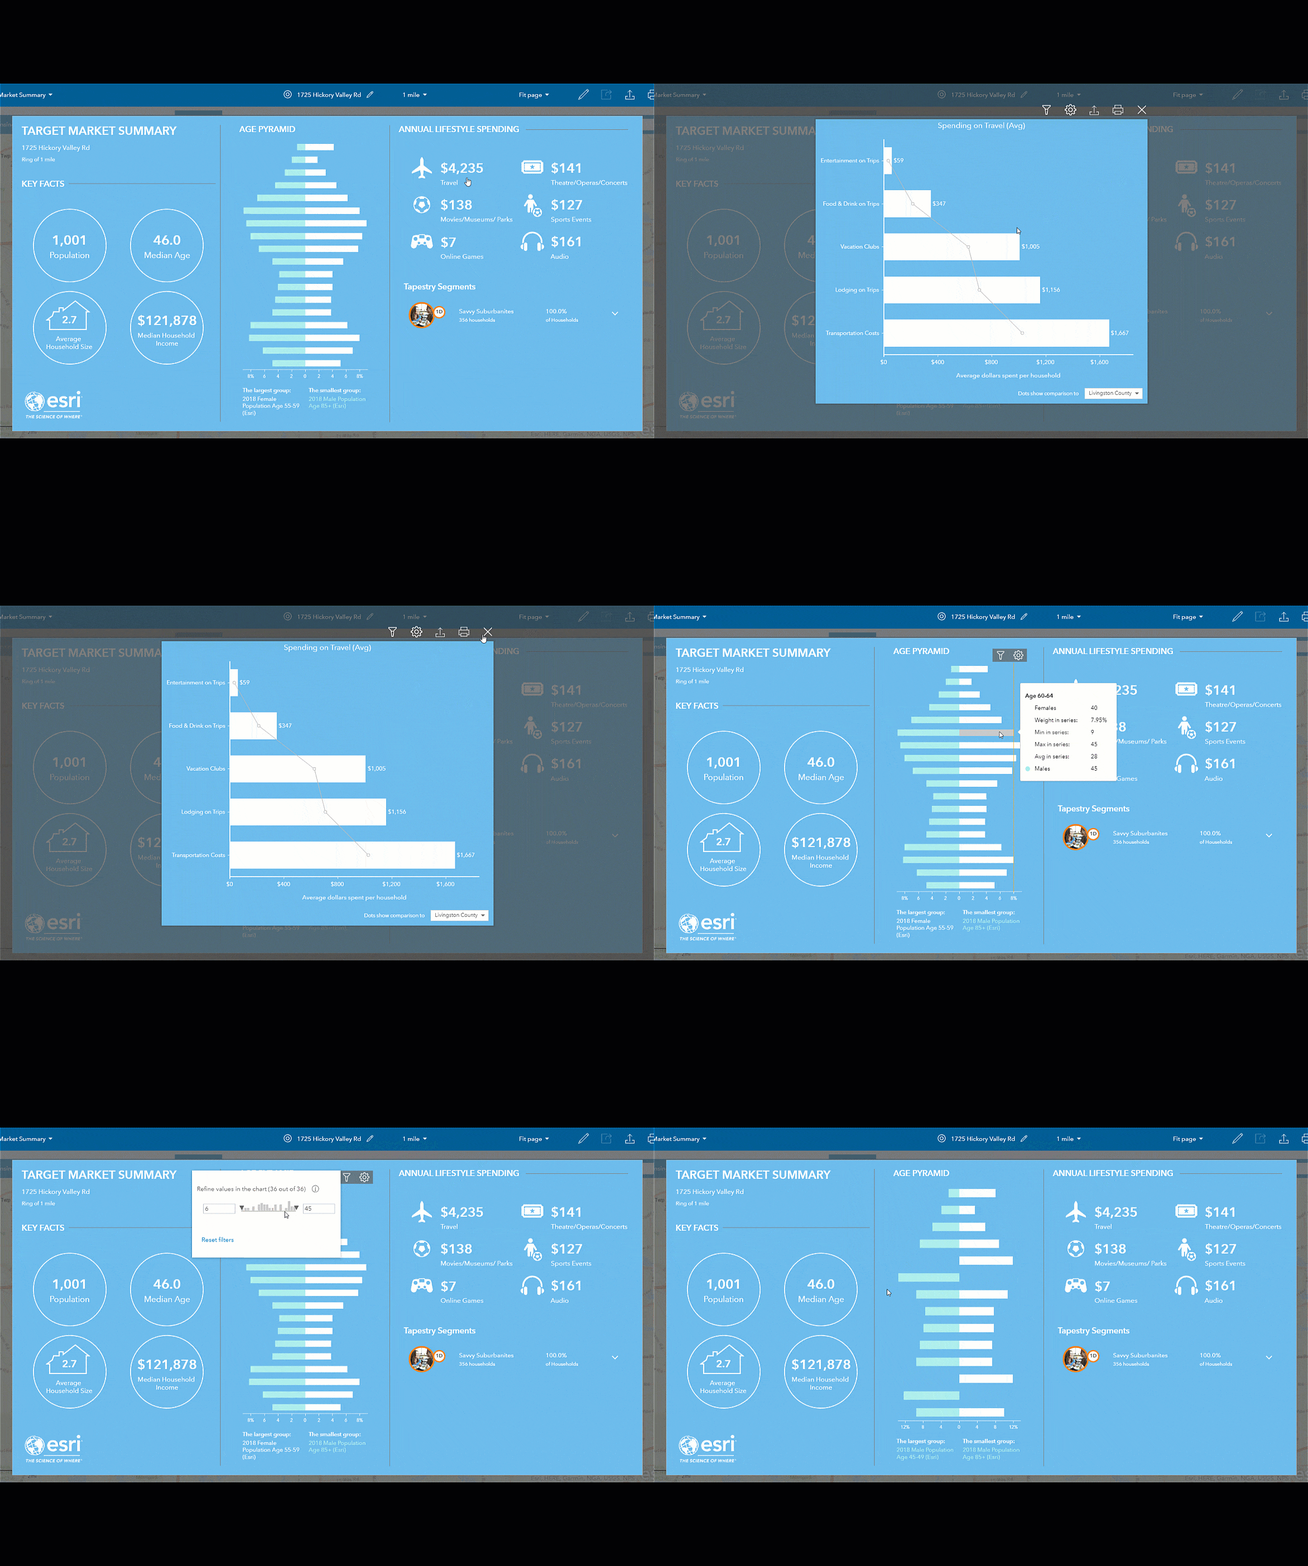
(4) Target Marketing Summary
Get crucial facts, lifestyle spending, Tapestry segments, and an age pyramid.
Potential industry use: Product Merchandising and Advertising
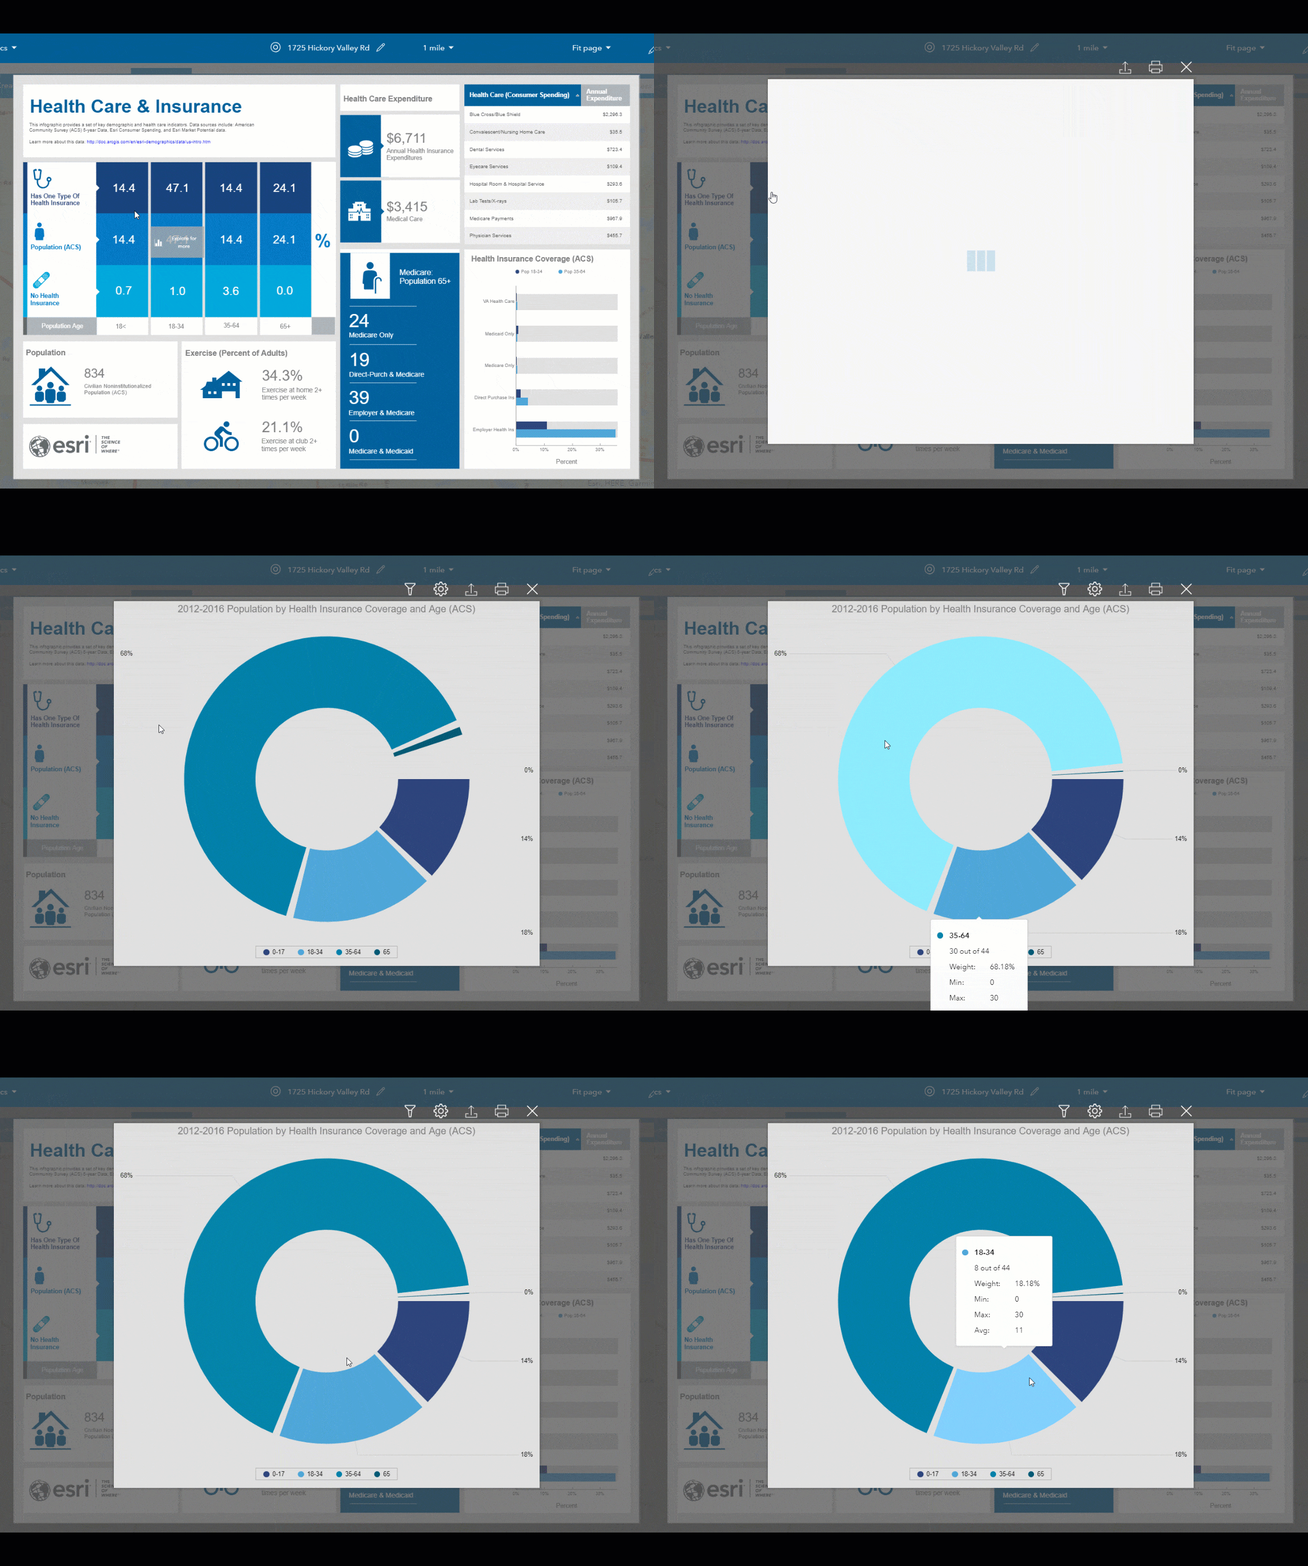
(5) Health Care and Insurance Statistics
A set of major health care-focused demographic indicators.
Potential industry use: Occupational Safety
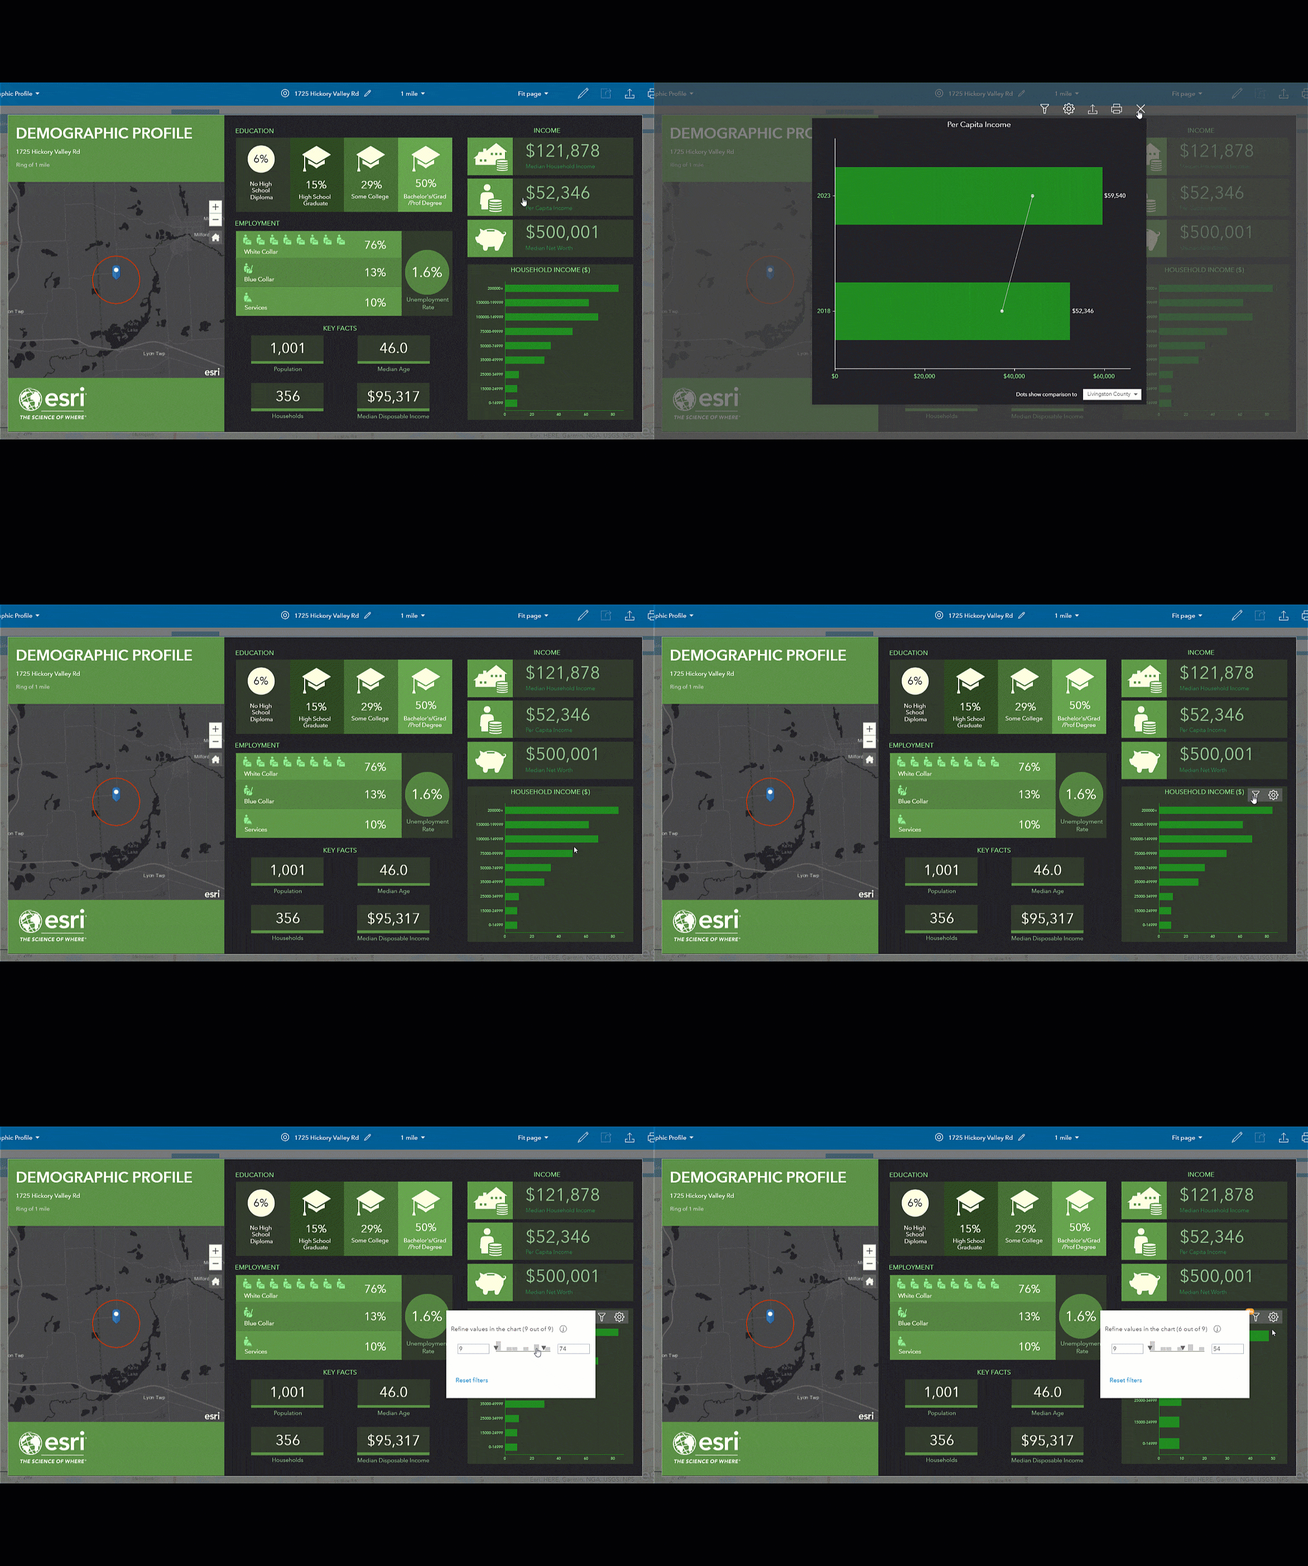
(6) Demographic Profile
Key facts such as population, education, income, and employment.
Potential industry use: Higher Education Recruiting
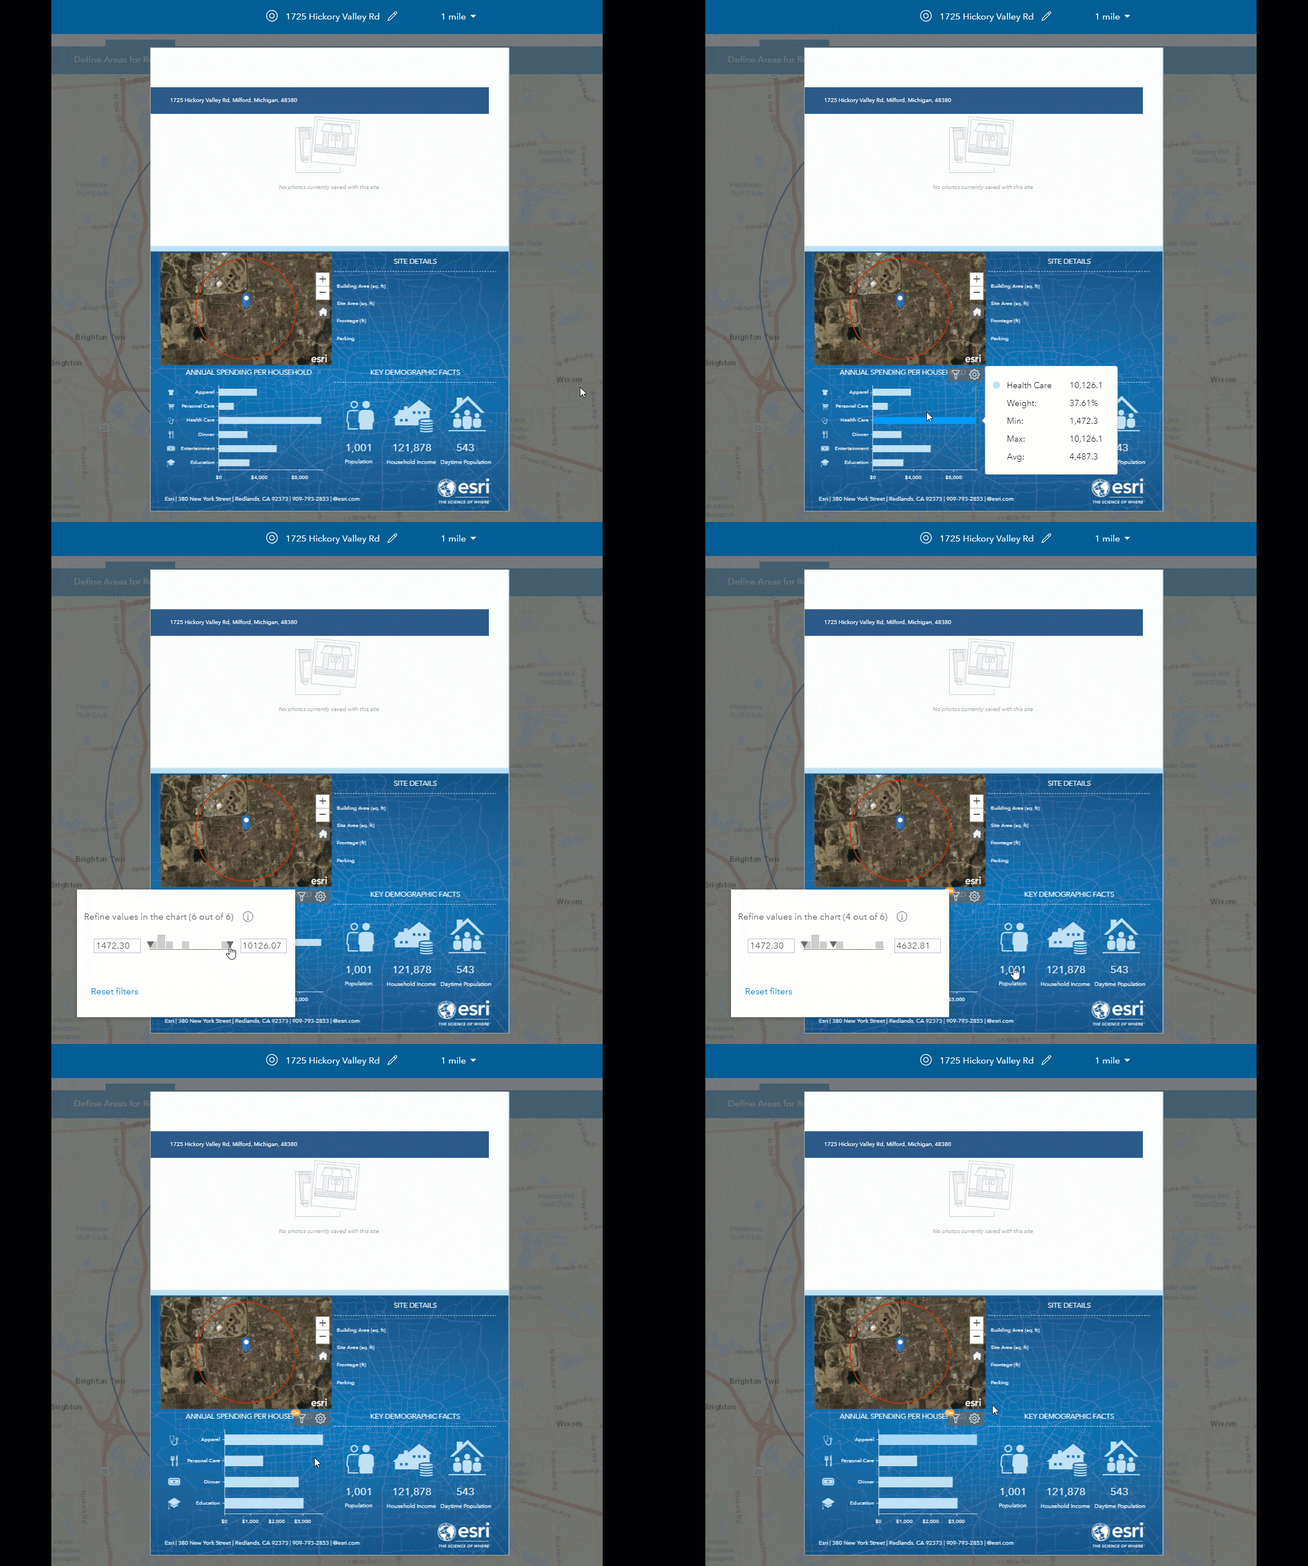
(7) Property Details
Site details, household spending, and demographics for an area. You can link and display your site photos and attributes.
Potential industry use: Real Estate Development
This summarizes the seven new infographic templates available in our March, 2019 ArcGIS Online release. And you can always build your own custom infographics!
Commenting is not enabled for this article.