From care packages to Christmas presents to groceries, we’ve all had packages delivered to us, and in the near future delivery companies are considering deploying drones to make these deliveries faster.
In this scenario, you’ll use raster analytics to find optimum paths for drone deliveries.
But, flying these drones is not as simple as grabbing a remote control. Not only does the FAA have many regulations for drone operations, flight conditions like wind and weather are constantly shifting. To account for these variables and derive flight corridors for your fleet of drones, you’ll use a raster function template. Raster functions produce outputs that are processed on the fly without saving any data to your disc, allowing you to run and rerun the template until you’re satisfied with the model.
In this blog, you’ll plan a drone flight corridor that avoid some of the most critical factors:
- Areas of high wind that can blow your drone off its flight path
- Overhead transmission lines and other aerial obstructions
- Environmental factors, such as particular classes of land use including conservation areas
- Locations of potential human interaction like schools
- No fly zones like hospitals, airports, etc
Create a cost surface
*Requires the Spatial Analyst extension
- Unzip the DroneDemo.zip file to your C: drive and double-click Drone Flight Corridors to open the project in ArcGIS Pro.
Note: The folder path for this lesson must be C:\DroneDemo to make the data paths in the raster function template work. If you save this to a different location, you’ll need to update the data paths in the template.
The map opens to today’s deliveries. The points in blue are homes that are close to main roads, so they’re easy to route trucks to. Points in red show homes that are farther off main roads, making them better candidates for drones to deliver to. To help you derive flight corridors, you’ll create a cost surface that shows areas where it is easiest for a drone to fly.
- In the Contents pane, turn on and off the layers in the Flight Corridor Variables group.
These layers show point, line, and polygon features that your drone should avoid. Each of these layers will be used in the RFT to calculate the cost surface.
- On the ribbon, click the View tab and choose Catalog Pane.
- In the Catalog pane, click the Portal tab and choose All Portal. Search for the Drone Corridors- Cost Surface raster function template. If necessary, add the search term owner:Learn_ArcGIS.
- Right-click Drone Corridors- Normal Conditions RFT and choose Open Raster Function.
When opened, the Parameters tab of the RFT looks like a geoprocessing tool. Because there are so many variables that a drone’s flight path must account for, a lot of inputs are required. The Federal Aviation Administration (FAA) has many guidelines, such as no fly zones- the airspace around hospitals, airports, and other important zones. Additionally, you need to worry about aerial obstacles such as power lines and wind, both of which can knock the drone out of the air.
| Avoids | Input |
| Areas of high wind | Wind Speed (at three elevations) |
| High elevations | Elevation |
| Steep slopes | Slope |
| Conservation areas, military bases, protected areas | Land Use |
| Overhead lines | Ski lifts, power lines |
| Human interaction | TransLinesMajor, Hospitals, Buildings |
- At the bottom of the Raster Functions pane, click the Create new layer menu and choose Save As.
- In the Save As pane, for Category, make sure Custom is selected.
Saving the RFT as a custom function template will allow you to open it in other projects without pulling it off the portal each time.
- Click OK.
The RFT is now available in the Custom tab of the Raster Functions pane. Before you run the RFT, you want to look at the input data needed.
- On the Custom tab, right-click Drone Corridors and choose Edit.
The rasters used in this template are shown in blue, and the Elevation raster is connected to many other inputs through the Buffered function. In this context, the Buffered function keeps the last accessed pixel block in memory. Because you’re using the Elevation raster in so many functions, this allows it to run faster.
As you saw in the Contents pane, most of the input layers are currently in the form of points, lines and polygons. To use them as inputs for the function template, you’ll use the Rasterize function to convert them to raster layers. The Rasterize function requires a single raster to be used as an input to define cell size and extent, which is why the Elevation raster is connected to each Rasterize function.
Some inputs have also been given weights, shown in blue circles; depending on their relative importance to the cost surface, the weight increases or decreases. The most important variables to avoid, including high winds and airport locations, have been given the highest weights.
Note: If you saved the project folder in a location other than C:\DroneDemo, the data paths will be broken. To fix this, you can add variables to the RFT and use the data path from where you saved the folder.
- In the Raster Functions pane, click the Cost Surface template to open the Properties pane.
If the data inputs are correct, they will automatically fill in the Properties pane.
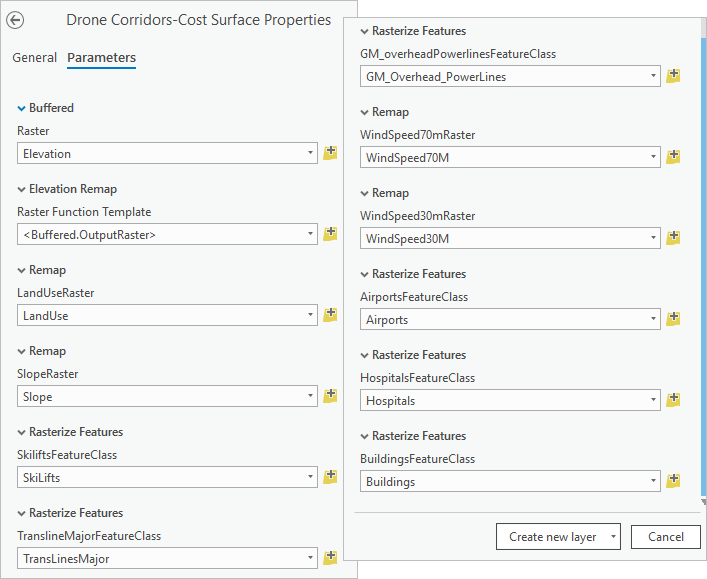
- Click Create new layer.
When the surface is calculated, it will be added to the map.
- Close the Editor
- In the Contents pane, click the color ramp for Drone Corridors-Cost Surface.
- In the Symbology pane, for Color Scheme, choose a green-yellow-red color ramp.
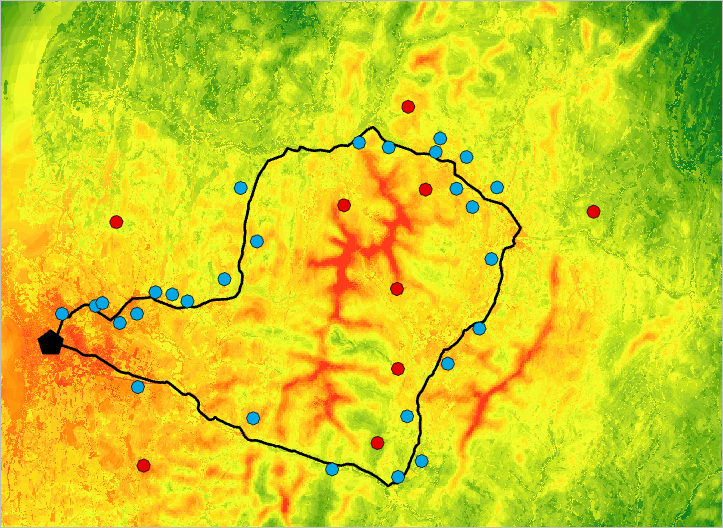
The higher values, shown in red and orange, are less suitable for drone flight as they have more of the criteria that make the path unsuitable according to the input layers.
Model drone flight corridors
The suitability surface forms the basis of the drone flight corridor analysis- now that you’ve calculated which areas a drone can safely fly through, you’ll use another RFT to draw a route to the first house.
- In the Catalog pane, search the portal for the First Drone Stop RFT.
- Open the RFT and save it as a Custom RFT.
- In the Raster Functions pane, on the Custom tab, right-click the RFT and choose Edit.
To run this template based on the cost surface you just created, you’ll edit the RFT directly. The Least Cost Path function currently has an empty raster variable as a placeholder input. You’ll replace this with your cost surface raster.
- In the Contents pane, click the Drone Corridors RFT result layer and drag it into the Editor pane next to the Resample function.
The cost raster has 200 meter cells, while the other inputs have 30 meter cells. To make the dimensions match, you’ll pass the cost surface through a resample before using it as the cost raster input.
- Hover over the Cost Surface raster and drag the cursor to the Resample function.
- Connect the output from the Resample function to the Cost Raster input for the Least Cost Path function.
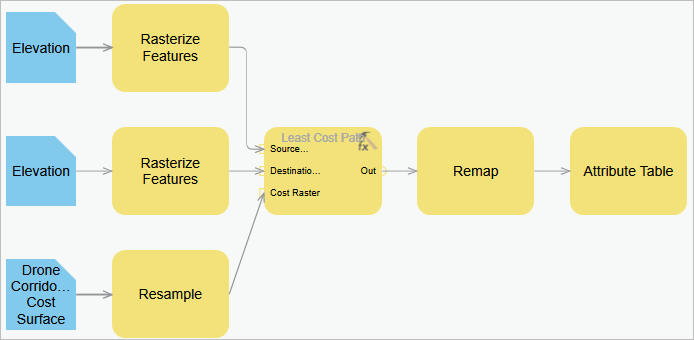
The Cost Surface raster replaces the blank raster variable as the input. You can remove the extra raster from the template.
- Right-click the empty raster variable and choose Delete.
- On the Editor ribbon, click Save.
Now, you’ll finish filling in the inputs using the Raster Functions pane. The Rasterize Features functions will be used as before to turn the point layers for drone and truck stops into raster layers for processing.
- In the Raster Functions pane, click the First Drone Stop RFT to open the Parameters tab.
- For Drone Stop, choose D1 and for Truck Stops, choose T1_T2. Click Create new layer.
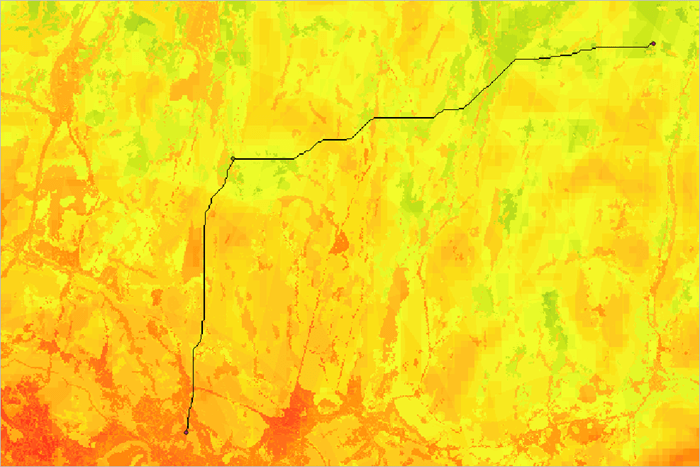
The result shows the least cost path for a drone to fly between the three points. Because you used raster functions, you can recalculate this flight corridor as frequently as needed to account for changing inputs.
The model you used can be built and edited in ArcGIS Pro, and is easy to use for a single truck and drone. To more easily scale the workflow across a fleet of trucks and drones, you can use a scripting approach, as shared in the Jupyter Notebook available on the ArcGIS API for Python’s github repository.

Commenting is not enabled for this article.