For a current project of mine about redistricting, I have a six-step sequence of geoprocessing tools that I need to run for every state using ArcGIS Pro. Each tool has multiple parameter options that I need to set a specific way. I counted all the clicks I had to do for one state – 21. Even more time consuming was the amount of running time in between all the tools that I was using, especially for the larger states. I do not want to do this manually 50 times! Fortunately for me, there’s ModelBuilder.
ModelBuilder allows you to string together multiple steps of a process by building a diagram that depicts your desired workflow. If you’re familiar with graphical programming environments, or visual programming languages that use block diagrams, then you may find ModelBuilder to be similar. I was not used to such environments. I’ve spent the past decade using command-line interfaces to write macros and for-loops, so when I learned about ModelBuilder, I was intrigued. I learned that it’s a great way to make your workflow repeatable while also making a great visual representation of the whole sequence.
If you want to automate a multi-step geoprocessing workflow, I encourage you to use ModelBuilder. In addition to having a stored process, you’ll also get a visual representation of your workflow. To create a new model, click on ModelBuilder in the Analysis ribbon:
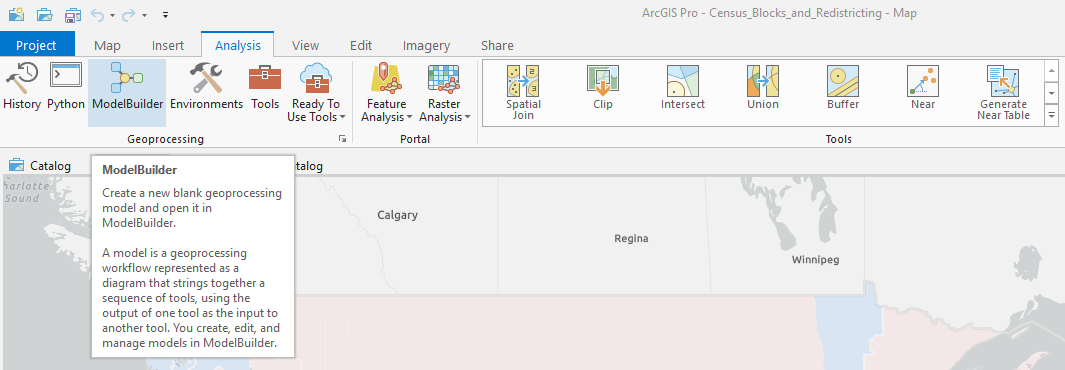
This will open up a blank canvas for you to drag and drop data from your Contents pane, tools from the Geoprocessing side panel, as well as arrows to connect all the steps in your process. The basic chain of elements is usually Input Element -> Geoprocessing Tool -> Derived Data, shown like this:

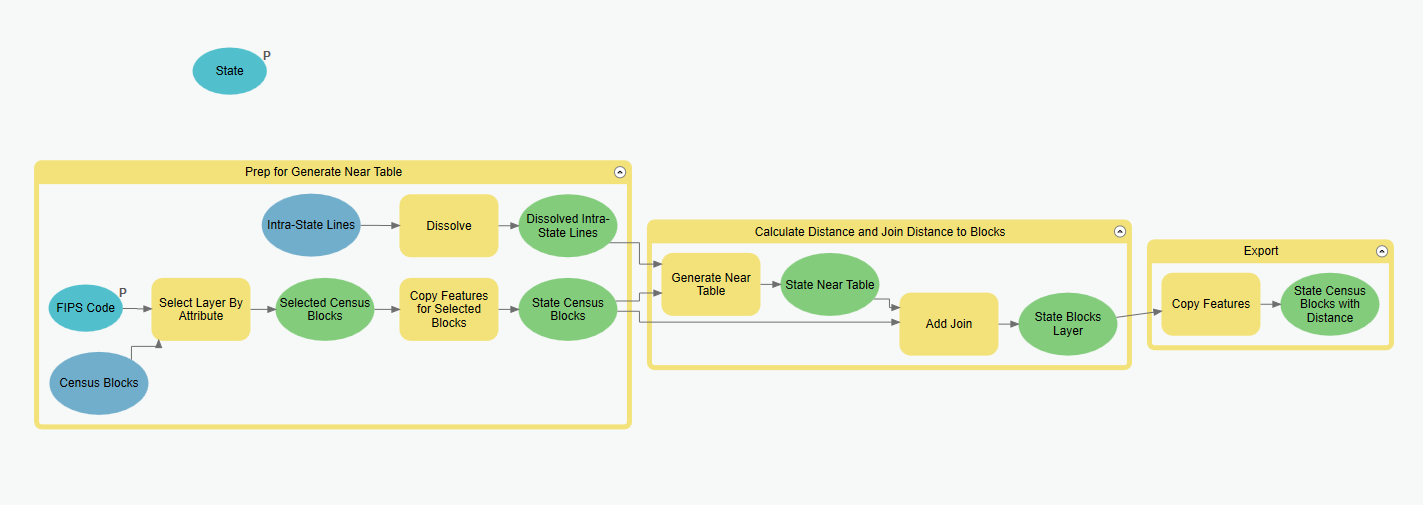
Input elements are shown in blue ovals. These can be layers, data tables, etc. In my model, I’ve got one layer of polygons (Census Blocks) and one layer of lines (Intrastate District Boundaries).
Geoprocessing tools are shown in yellow squares. Geoprocessing tools are the basic building blocks of your models. Common geoprocessing tools include Select, Buffer, Clip, Merge, Union, Intersect, Spatial Join, Join by Attributes, etc. ArcGIS Pro has over a thousand specialized geoprocessing tools for you to choose from, which are found in specific toolboxes. When you drag and drop the tool you want from the Geoprocessing side panel into the ModelBuilder canvas, it will first appear gray. Click on it to select your input and then it will appear yellow. The geoprocessing tools I’m using in this model are Select by Attributes, Dissolve, Copy Features, Generate Near Table, and Join by Attributes.
Derived data is shown in green ovals, which is output from one tool that will be used as input in another tool. There are two types of derived data: modified input (a temporary dataset), and new output on the disk (a permanent dataset). If you want to make your modified input data permanent, use the one of the Copy tools appropriate for your data type, in my case Copy Features. You can also make a copy of a raster or a table to persist it out.
Creating descriptive labels for all your model’s elements is easy. Give the elements labels so that they are meaningful to you by right-clicking on the element and selecting Rename.
If you have any inputs to a geoprocessing tool that you want to be able to control, then you can add variables. Variables are shown in light blue ovals. Variables are all non-dataset inputs. These can be of type string, long, double, and Boolean. An example of a variable would be the distance to use for a buffer tool or a search radius for density tools.
In my case, the state’s FIPS code is going to have to change every time I run this, so that I select the right blocks for a given state. In my input layer is Census Blocks, I’m using a different FIPS code every time to run Select Layer by Attributes, selecting on a field called State that takes different FIPS Code values. This will create derived data that contains only the blocks that contain a specific FIPS Code.
I also created a universal variable for the whole model called state. I have a light blue oval at the top of my model (unconnected to anything in the diagram) that is used to change the name of the state I’m currently running.
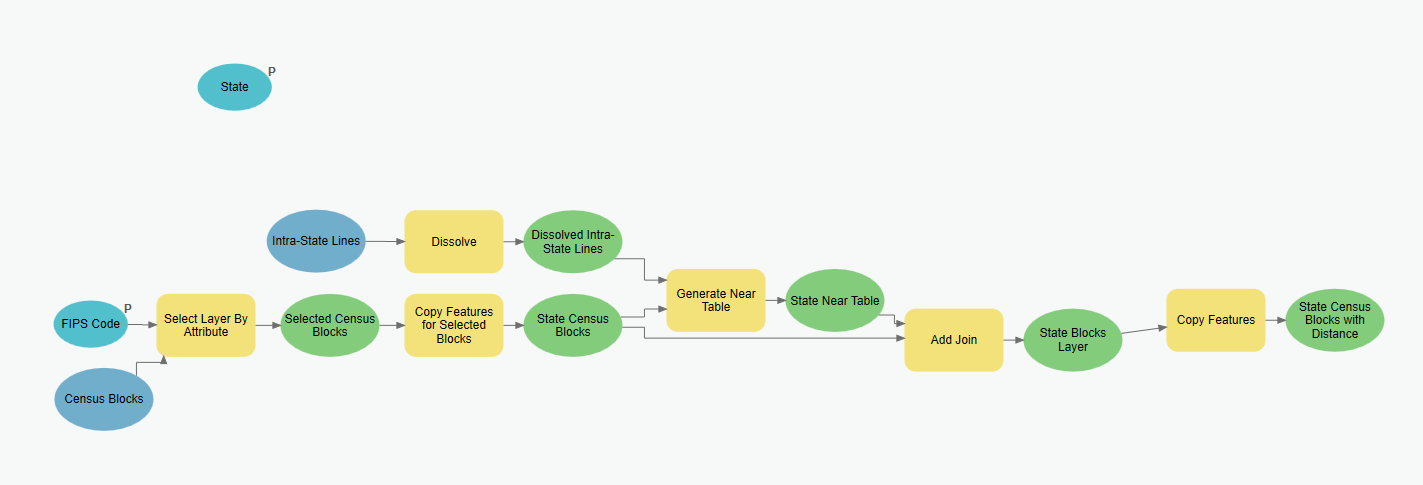
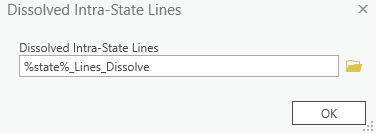
This allows me to use in-line variable substitution for all my path names for each output file using % symbols on each side of my variable name. This way, I only change the state name in one place, instead of every place I’m creating output. For example, in the Dissolve tool, my output is set up like this:
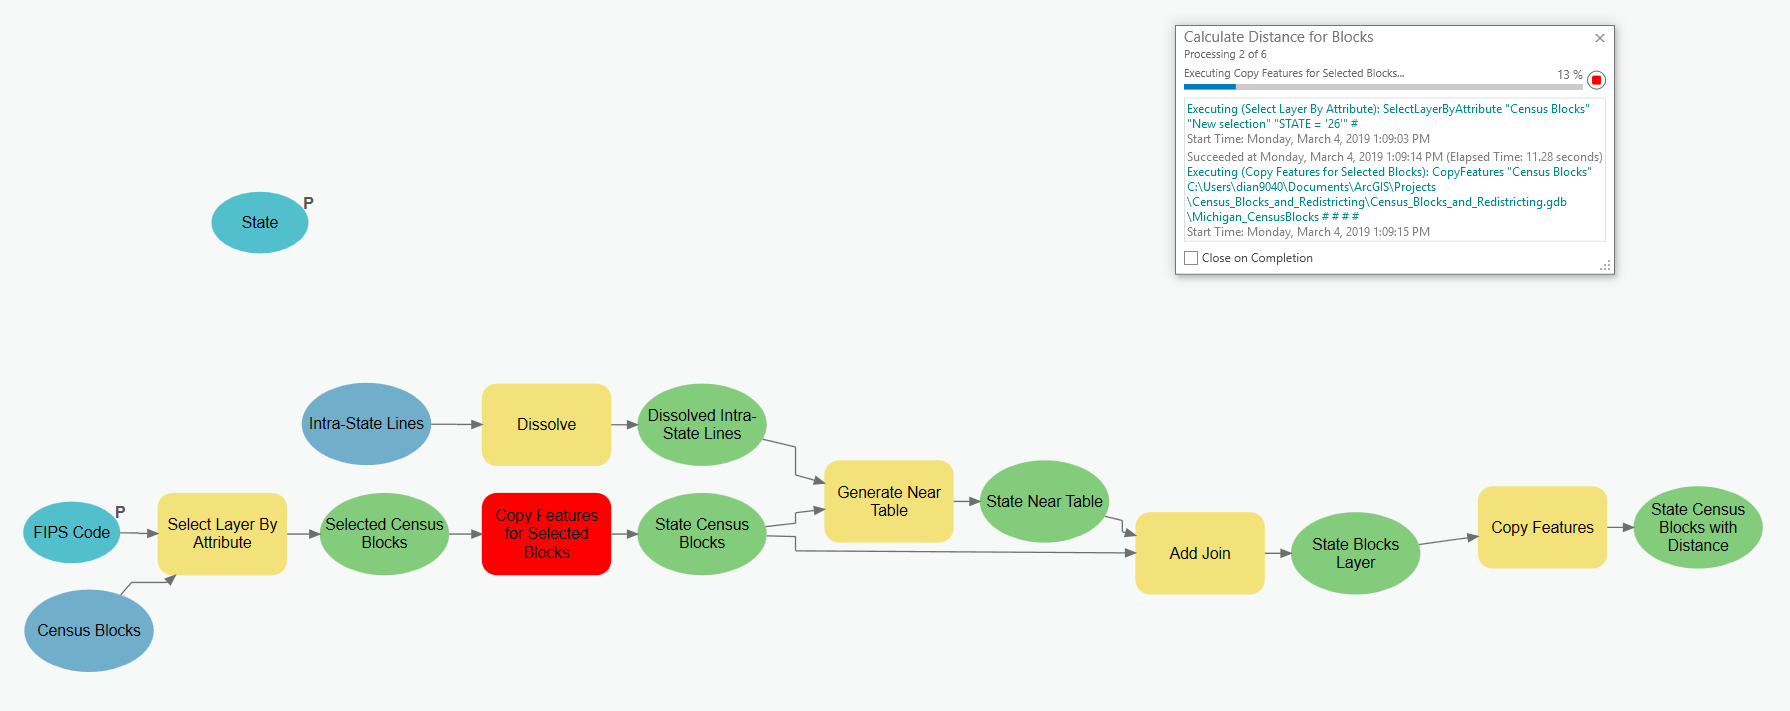
When a model is running, the part that is currently executing will display in red. You’ll also see a log window appear showing the progress.
When the model stops running, each element that has executed will appear with a drop shadow behind it in the diagram.
Setting Parameters
Models are usually stored in a Custom Toolbox that is named the same name as your ArcGIS Pro project. Check the Catalog pane to see where your model is stored. From the Catalog pane, right-click on your model and select Open, and you will see a geoprocessing dialogue box for your new custom tool! Anything you have set as a parameter appears just like a control for any other geoprocessing tool. To set a variable as a parameter, simply right-click on the model element and select Parameter so that it appears with a green checkmark next to it. You will then see a “P” in the top-right corner of this element in your model’s diagram. In my model, the FIPS code and the State variables are set as parameters.
Create Groups
You can chunk off parts of your model into different groups by selecting all the elements you want to group together and then clicking the Group button:

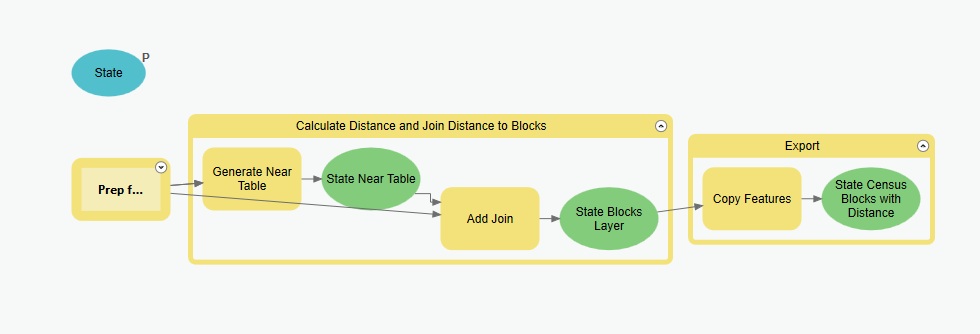
This allows you to give each of your chunks of the model a name. I created three different groups within my model and gave each group a descriptive name: Prep for Generate Near Table, Calculate Distance and Join Distance to Blocks, and Export.
The nice thing about creating groups is that you can collapse or expand the groups so that you can view different chunks of your model separately. For example, I have collapsed the Prep for Generate Near Table group, below:
The Power of Iterators
I want to repeat this process over a list of many states. Why should I waste time manually entering each state and FIPS in my two variable elements when I want it to run for each state? You can set up an iterator if you have a list of values or inputs that you want to use in your model.
There are 12 different types of iterators available:
- For
- While
- Iterate Feature Selection
- Iterate Row Selection
- Iterate Field Values
- Iterate Multivalue
- Iterate Datasets
- Iterate Feature Classes
- Iterate Files
- Iterate Rasters
- Iterate Tables
- Iterate Workspaces.
View examples of using all kinds of iterators in ModelBuilder. Because I need both the state name and FIPS code as input criteria, I’m going to have my model call my handy State & FIPS reference table that I use all the time to serve as the list for this iterator. In fact, I don’t need to run this process for a handful of states that only have one congressional district: Alaska, Delaware, Montana, North Dakota, South Dakota, Vermont, and Wyoming. I also don’t need to run this for DC and Puerto Rico. I can create a simple .txt table of the 43 of the 52 records in this table for which I want to run this model and use the Iterate Row Selection type of iterator. Iterators are displayed in a model as orange hexagons. Then I’ll use the Get Field Value utility to look up the FIPS code for each state from my table. Here’s what my new model looks like:

Note, only one iterator is allowed per model. If you want to do multiple iterators, you can build sub-models, each with their own iterator.
Setting Properties and Documenting Your Model
You can give your model a name and label, and even can make your model password-protected if that’s important to you. From the catalog pane, right click on your model to select Properties. To provide a bit more information to make your model shareable with other analysts, right-click again and select Edit Metadata. In here, you can write a description, provide search tags, a thumbnail, and much more. You can package up your model as a tool in a custom toolbox inside a geodatabase, and share it as part of your entire Pro project.
Some Nice Bells and Whistles for the Diagram’s Appearance
Auto Layout
Auto Layout is very helpful for making your diagram pleasing to the eye. Click Fit to Window and Pro will optimize the size of your diagram for your current view. You can also make the whole diagram flow from top to bottom (instead of left to right) by checking the Flip Orientation box in the Diagram ribbon.
Styling the Diagram
There are so many options to modify the look of your diagram. Just a few of these options include:
- Size of all the elements
- Font options for labels
- Orientation of text
- Shape options for the links/connectors
Other Use-Cases for ModelBuilder
Instead of a long list of states (or counties, or campuses, etc.), maybe you’re running the same multi-step process every month for your city, as you get new building permits data in every month. Store your process by building a model that you can use instead of recreating the wheel every month.
Or, if you’re producing similar layers on a regular basis, take advantage of the If/Then/Else logic to create a “Quality Assurance Checklist” type of model with multiple steps to validate that your data is correct. Perhaps you want to check that multiple conditions are true (e.g., record count is what you expect, means are within a certain range, etc.). Set it up a model with some Boolean logic and you’ve just built a nice QA tool!
My First Impressions
I am used to working with programs that use a command-line interface, so the point-and-click, drag-and-drop nature of ModelBuilder is new to me. I like being able to search for a tool within the diagram canvas (just click inside the diagram and start typing a tool name!), just like the tool search in the geoprocessing side panel. The biggest benefit of ModelBuilder that I see is having a visual representation of a multi-step process. It also makes the automation process less intimidating to those who don’t like to code. With my first project really using and digging in to ModelBuilder in ArcGIS Pro well underway, I’m impressed! I am so pleased that ModelBuilder in ArcGIS Pro makes my project easy, and dare I say, fun!
For more information on ModelBuilder, check out the official documentation, including ModelBuilder vocabulary. If you have any questions, tips, or tricks to share, feel free to post on them in the ModelBuilder community on GeoNet.
Many thanks to Shitij Mehta for her guidance while building this model!
Commenting is not enabled for this article.