According to ATP 3-06 / MCTP 12-10B / (URBAN OPERATIONS) “The effective conduct of urban operations requires a basic understanding of urban environments. Currently, more than 50 percent of the world population lives in urban areas and is likely to increase to 70 percent by 2050, making military operations in cities both inevitable and the norm.”
This increase in urban warfare will make clearing operations more crucial to ensuring the safety of both troops and civilians. The goal of a clearing operation is to remove civilians and bystanders from an area of interest before sending troops in. To support this operation, you need to find roads and pathways around the area of interest that are not visible from a target building. Assuming there is a roaming observer stationed on top of the target building, you’ll use viewshed and visibility tools to determine where troops can safely travel without alerting the observer. ArcGIS Pro and Military Tools for ArcGIS enables the analyst to produce Tactical Decision Aides (TDA) in 3D. Using ArcGIS Pro aids in making complex and rapid decisions that military leaders face in planning all missions.
Step 1: Download necessary data and tools
Military Tools for ArcGIS is an ArcGIS Solution that provides a collection of new, mission-focused enhancements to simplify defense and intelligence workflows.
1. Download and install Military Tools for ArcGIS Pro.
Note: To access the Esri downloads site, you must have Esri access. If you don’t have Esri access, contact your ArcGIS organization’s administrator.
- Go to Military Tools for ArcGIS and click Download.
- Unzip the MilitaryToolsForArcGIS folder to a local drive, like the default ArcGIS folder in Documents.
- Follow the instructions to install the add-in.
2. Install the Military Tools toolbox.
There are several methods of installing the toolbox depending on your needs. The method recommended for the purposes of this blog is to install the toolbox for ArcGIS Pro. You can also choose to install the Python package.
3. Download the ClearingOperations project package.
4. Browse to the downloaded folder and double-click ClearingOperations.ppkx to open the project.
The ClearingOperations project package contains several layers and a custom toolbox. In the Contents pane, you’ll see building footprints, roads, an area of interest, and several 3D products in the form of digital surface models.
Step 2: Create building numbers from building footprints
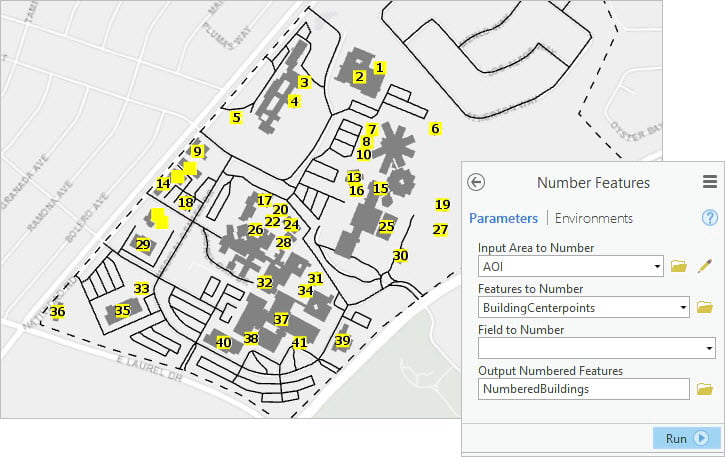
Numbering buildings helps an analyst communicate intel to field officers. Done manually, the process is time consuming, but the Number Features tool included in Military Tools for ArcGIS automates this process with a script tool. You’ll create a number attribute for each building that will be used later for labeling.
1. On the ribbon, click the Analysis tab. In the Geoprocessing group, click Tools.
The Geoprocessing pane opens.
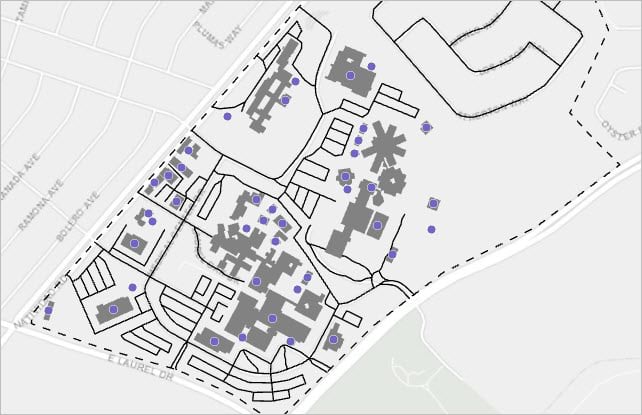
2. Search for and run the Feature to Point tool with the following parameters.
- Input Features: Buildings
- Output Feature Class: BuildingCenterpoints
- Inside: True (checked)
The building centerpoints can now be used to number and label each building.
3. Search for and run the Number Features tool using the following parameters:
- Input Area to Number: AOI
- Features to Number: BuildingCenterpoints
- Output Numbered Features: NumberedBuildings
Note: This tool is included in the Military Tools toolbox that you added to the project earlier.
The output will be stored in the project geodatabase, which can be accessed from the Catalog pane. Leave the Field to Number parameter blank to tell the tool to create a new number field in the attribute table.
4. In the Contents pane, right-click BuildingCenterpoints and choose Remove.
5. Save the project.
Note: The project was created with ArcGIS Pro 1.4 for compatibility. If you get a warning when saving your project because you have a newer version, click OK.
Step 3: Identify target building for threat awareness
You have the coordinates of the target building in the Military Grid Reference System (MGRS). Assuming there will be a roaming observer posted on the roof of this building, you want to discover what roads the observer can or cannot see. To convert the coordinates to a feature class you can use in analysis, you’ll use the Coordinate Conversion tool. This tool, included in the Military Tools add-in, can convert coordinates to and from a range of typical formats, such as decimal degrees and MGRS, and export the results as a feature class. Then, you’ll use the Visibility tool to calculate a radial line of sight from the roof of the target building. This analysis can support planning tactical procedures such as infiltration/exfiltration routes, Tactical Assembly Areas (TAA), Casualty Collection Points (CCP), and Traffic Control Points (TCP).
1. Switch the basemap to Imagery.
- On the ribbon on the Map tab, in the Layer group, click Basemap and choose Imagery.
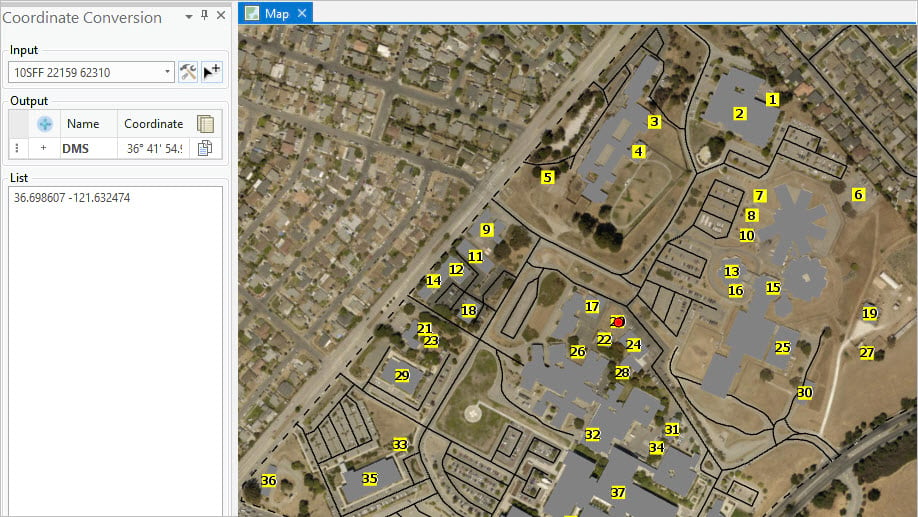
2. Locate the target building using the Coordinate Conversion tool.
- On the ribbon, click the Military Tools tab. In the Military Tools group, click Coordinate Conversion.
- For Input, paste the target location: 10SFF 22159 62310.
- Press Enter.
The location is formatted in MGRS and is added to the list as well as converted to whichever output coordinate systems you selected. A red point is added as the target location.
3. Save the target building as a feature.
- At the bottom of the pane, click Export. In the Select Output window, make sure Feature class is selected and click OK.
- In the second Select Output window, browse to the project geodatabase (Under Project, click Database and choose gdb) and name the output TargetBuilding.
- Click Clear All and close the Coordinate Conversion pane.
Now that you’ve located the target building, you’ll use the Visibility tool to create a reverse visibility product. Typically, a visibility product is created to understand where your troops can see. In this case, you want to understand where the roving observer on the roof of the target building can see to evaluate where your troops can move while remaining concealed.
4. In the Contents pane, uncheck the NumberedBuildings and Buildings layers to turn them off.
5. Right-click the TargetBuilding layer and choose Zoom To Layer.
6. Create a Radial Line of Sight from the target building with the Visibility tool.
- On the ribbon, in the Military Tools group, click Visibility.
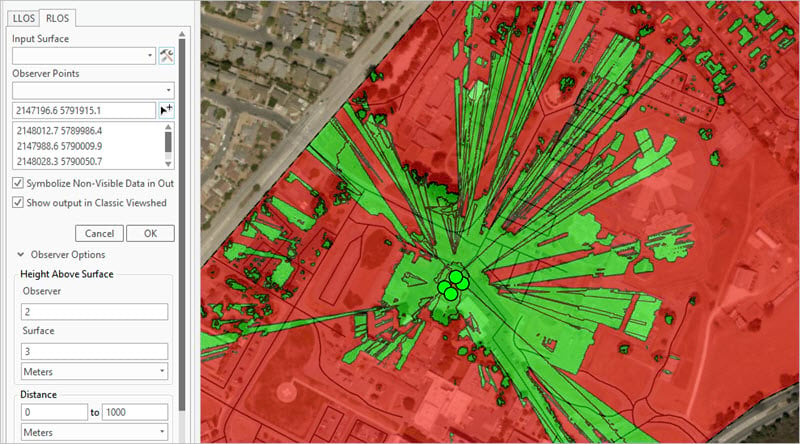
- On the Visibility pane, click the RLOS (radial line of sight) tab.
7. Run the Visibility tool with the following parameters:
- For Input Surface, choose DSM.
- For Observer Points, choose the map point tool and click the four corners of the building to place points.
- Check Symbolize Non-Visible Data in Output and Show Output in Classic Viewshed.
- Expand Observer Options. Leave Observer set to 2 meters and change Surface to 3 meters.
- Accept all other defaults and click OK.
Using multiple points on the target building best represents the possibility of a roving observer.
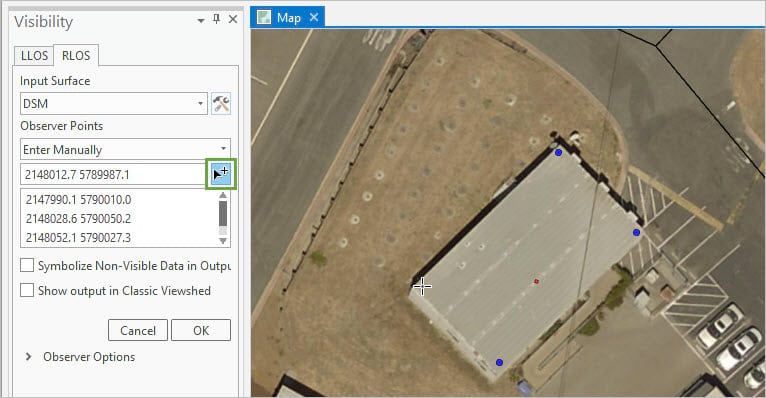
The green represents areas where a three meter tall military vehicle is visible to a roving observer on the target building roof.
8. Close the Visibility pane and save the project.
Now that you’ve mapped the observer’s line of sight visibility, you’ll export it to an information product. To enable troops to efficiently navigate the urban environment, the product should emphasize areas in which can move undetected.
9. Use the FeatureVisibility model in the Clearing Operations toolbox to display road sections that are visible and not visible from a roving guard on the target building roof.
The Clearing Operations toolbox is a custom toolbox that was included with the project. It contains one tool, the FeatureVisibility model.
- Browse to the Catalog pane and expand Toolboxes.
- Expand ClearingOperations.tbx and double-click the Feature Visibility tool.
- For Visibility Layer, choose RLOS\RLOS_Visibility.
- For Area of Interest, choose AOI, and for Road Layer, choose Roads.
- Name the output FeatureVisibility.
- Accept all other defaults and click Run.
- Turn off the RLOS group layer.
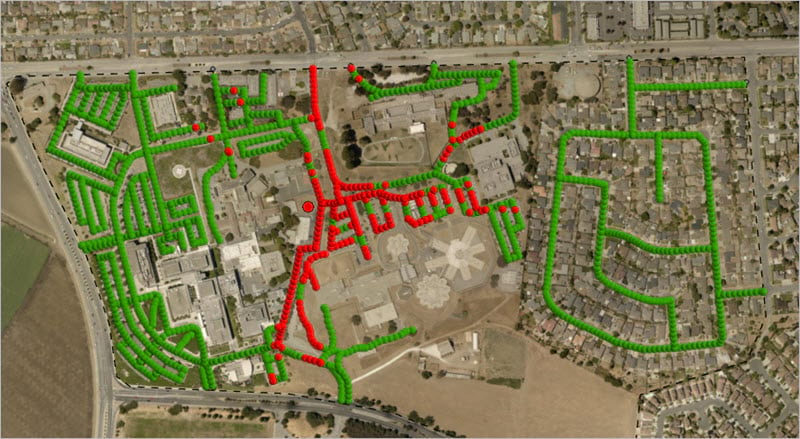
The tool creates a point every 10 meters on the road. At each point, the visibility from the target building is calculated using the viewshed you created earlier.
The output represents areas of the road that can be seen and not seen by a roving observer on the target building.
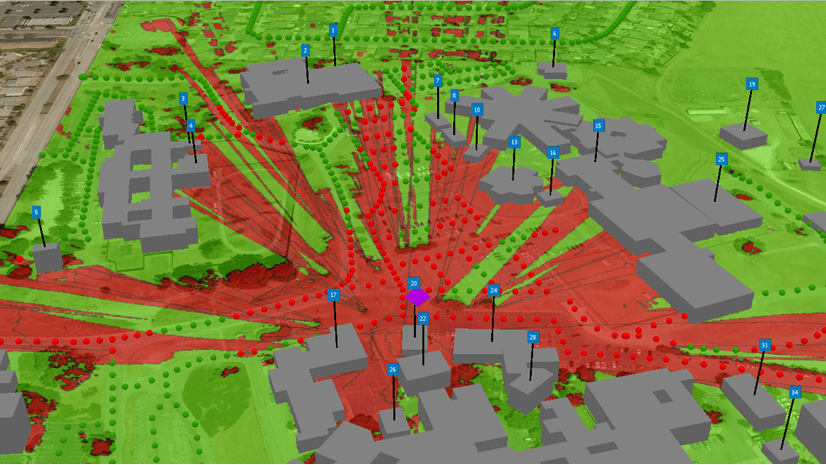
Green represents road sections that are NOT visible by the observer on the target building.
Red represents road sections that ARE visible by the observer on the target building.
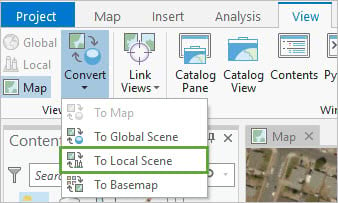
9. On the ribbon, click the View tab. In the View group, click Convert and choose To Local Scene.
10. Save the project.
Step 4: Create basic 3D buildings from an nDSM and building footprints
To better visualize the scene, you’ll use the normalized Digital Surface Model (nDSM) and building footprints to create basic 3D buildings. The nDSM contains building heights, which you’ll extract using the Zonal Statistics tool. The tabular output created by this tool is joined to the building layer, which can then be extruded. You’ll use one of the statistics, MAX, to estimate building heights and render them in 3D.
1. In the Geoprocessing pane, search for and run the Zonal Statistics as Table tool with the following parameters:
- Input raster or feature zone data: Buildings
- Zone field: ORIG_OID
- Input value raster: nDSM
- Output table: BuildingsStats
- Statistics type: Minimum, Maximum, and Mean
2. In the Geoprocessing pane, search for and run the Join Field tool with the following parameters:
- Input Table: Buildings
- Input Join Field: ORIG_OID
- Join Table: BuildingsStats
- Output Join Field: ORIG_OID
- Join Fields: MAX, MEAN, MIN
Hint: Click the drop-down arrow next to Join Fields to choose multiple fields at a time.
3. In the Contents pane, turn off all layers except Buildings and the basemap (World Imagery).
Hint: Press the Ctrl key and click one of the layers to turn them all off or on.
4. Extrude the buildings to their maximum height.
- In the Contents pane, drag the Buildings layer from the 2D Layers group to the top of the 3D Layers.
- Make sure Buildings is selected and click the Appearance tab.
- In the Extrusion group, click Type and choose Min Height.
- For Field, choose MAX.
- For Unit, make sure US Feet is chosen.
The buildings are extruded to the maximum height calculated by Zonal Statistics. Because you’re looking at the scene from directly above, the buildings don’t appear to have changed. You can tilt the scene by pressing the V key and panning the map.
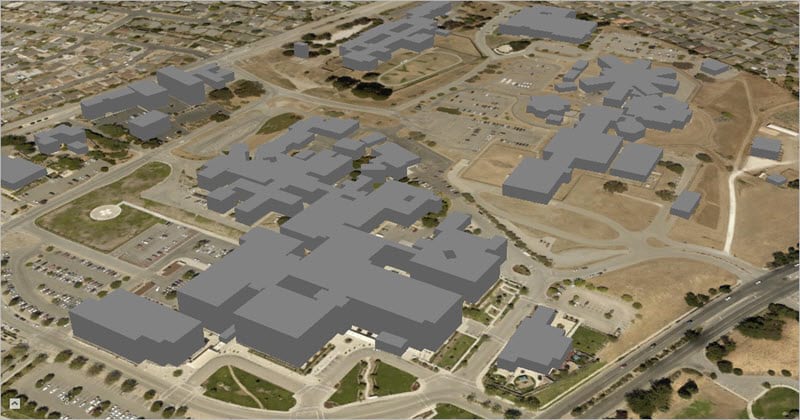
Remember that this is not true 3D data, but a 3D visualization of a 2D layer. To turn these buildings into 3D features, you’ll convert them to multipatch features. A multipatch feature is a GIS object that stores a collection of patches to represent the model of a 3D object as a single row in a database. Because a multipatch is true 3D data, you can apply procedural symbology, edits, and perform 3D analysis (for example, visibility, 3D set operators, skyline, and shadows).
5. In the Geoprocessing pane, search for and run the Layer 3D to Feature Class tool with the following parameters:
- Input Feature Layer: Buildings
- Output Feature Class: Buildings3D
- Accept other defaults
You now have a 3D multipatch building feature class that you can symbolize and perform analysis on.
6. Save the project.
Step 5: Use the building numbers in 3D for labeling
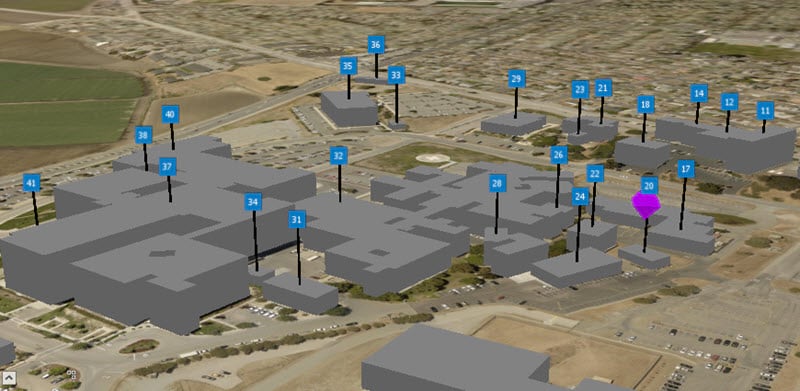
Now that you’ve finished the analysis, you’ll need to clean up the scene before you share the information product with decision makers. First, you’ll annotate each building using the building numbers you created earlier. You’ll also show the visibility layers to evaluate the safest paths.
1. Duplicate the NumberedBuildings and choose Copy.
- In the Contents pane, right-click NumberedBuildings and choose Copy.
- Right-click Map_3D1 and choose Paste to create a duplicate layer in the scene.
You’ll use one layer to label the features and the second to anchor the labels to buildings.
2. Change the names of the two NumberedBuildings
- Click the copy of the layer two times and rename it Anchor Points.
- Click the original layer two times and rename it Labels.
3. Set the anchor point layer height above the building.
- In the Contents pane, turn on the Anchor Points layer and select it, and then click the Appearance tab.
- In the Extrusion group, click Type and choose Absolute Height.
- Next to Field, click the Expression button.
- In the Expression box, type 200.
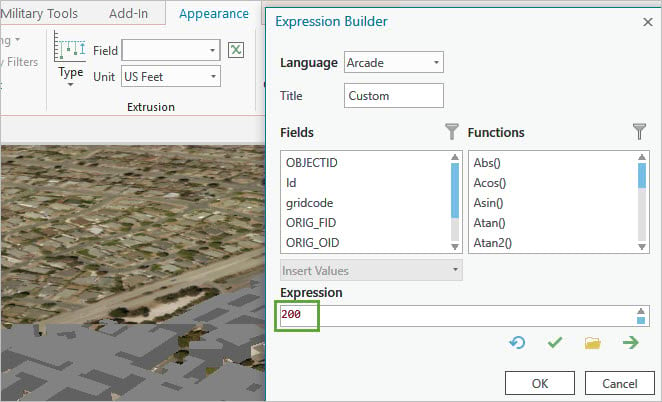
Each point will be symbolized at an absolute height of 200 feet above the ground. You’ll use this height to draw leader lines, which connect the building feature with its label.
4. On the ribbon, click the Labeling tab. In the Layer group, click Label to turn off labeling.
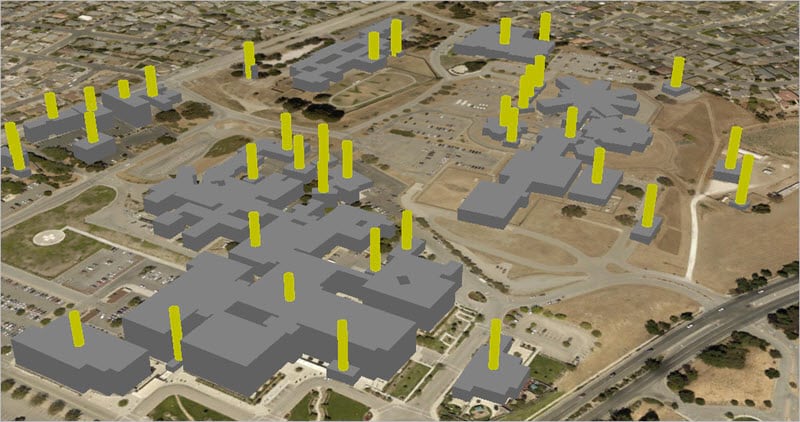
5. Symbolize the leader lines.
- In the Contents pane, right-click Anchor Points and choose Symbology.
- In the Symbology pane, click the yellow symbol icon.
- In the Symbol Gallery, search for and choose the Centered Cylinder symbol (ArcGIS 3D).
- Click the Properties tab. For Color, choose black, and for Size, type 2 pt.
- Click Apply.
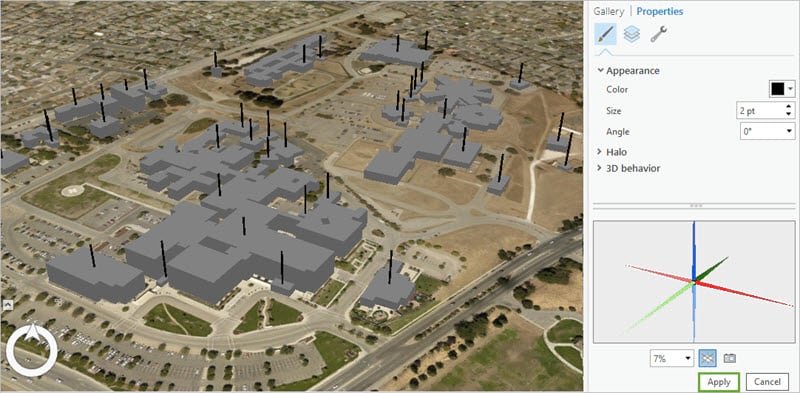
6. Set the labels for each building.
- In the Contents pane, right-click Labels and choose Symbology.
- In the Symbology pane, click the yellow symbol icon.
- Click the Gallery tab and choose Circle 1.
- Click the Properties tab. For Color, choose No Color and click Apply.
- On the ribbon, click the Labeling In the Label Class group, for Field, make sure Number is chosen.
- In the Text Symbols group, expand the selection. In the Shields category, choose the second Road Centerline symbol.

This symbol displays a blue background for the building labels.
7. Set the height of each label to be placed on top of the anchor lines.
- In the Contents pane, double-click the Labels layers.
- In the Layer Properties window, click the Elevation tab.
- For Features are, choose At an absolute height.
- For Additional feature elevation using, choose A field and click the Set an expression button.
- In the Expression box, type 200 and click OK in both windows.
- In the Contents pane, turn on the Labels layer and drag it from 2D Layers to the top of 3D Layers.
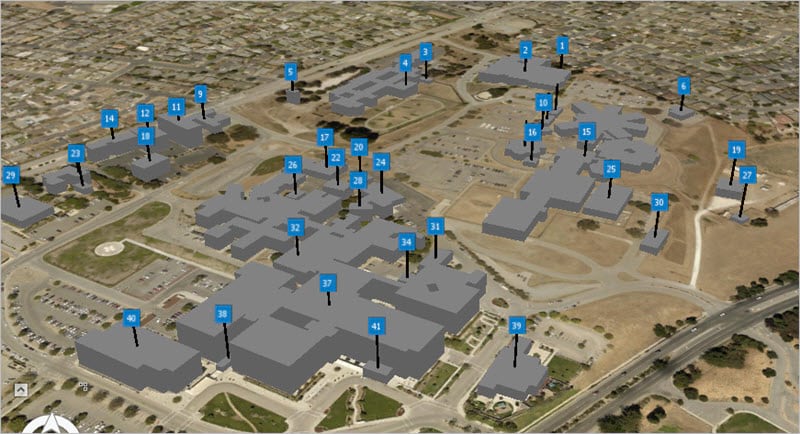
The labels appear on top of the anchor for better viewing in a 3D environment. This prevents any labels from being obscured by 3D features.
8. Set an icon for the target building.
- In the Contents pane, turn on the TargetBuilding layer and drag it to the 3D Layers group.
- Right-click TargetBuilding and choose Symbology.
- Click the symbol icon. In the Gallery, search for and choose Centered Diamond.
- On the Properties tab, for Color choose a bright purple, and for Size, type 30 pt.
- Click Apply and close the Symbology pane.
The purple contrasts with the Imagery basemap to highlight key locations.
9. Extrude the target symbol.
- In the Contents pane, double-click the TargetBuilding layer.
- In the Layer Properties window, click the Elevation tab.
- For Features are, choose At an absolute height, and for A field, set the expression to 175.
- Click OK in both windows.
Step 6: Create the final information product
Once you’ve finished symbolizing the data, you’ll export it to share with others. The most common way to do this is to export a PDF of the map. You can also publish a web scene to your ArcGIS Online or ArcGIS Enterprise portal.
1. Symbolize the viewshed layer to match the FeatureVisibility
- In the Contents pane, turn on the RLOS group layer (under 2D Layers).
- If necessary, expand the RLOS_Visibility
- Right-click the green symbol for Visible and choose a bright red color from the color selector.
- Right-click the red symbol for Not Visible and choose a bright green color.
Note: Traditionally, green represents seen and red represents unseen. However, once the colors are changed to match the FeatureVisibility layer, red represents an area of danger where movement won’t be concealed from a roving guard on the roof of the target building.
2. Turn on the FeatureVisibility layer.
3. Pan, zoom, and tilt the map until you can see the target building and the majority of the viewshed.
4. Save the map.
5. Share the map.
- On the ribbon, click the Share tab.
- In the Export group, click Map.
- In the Export Map window, name the PDF Target Building Visibility and choose the location where you want to save the file.
- For Save as type, choose PDF and click Export.
You have successfully created a 3D PDF to assist field officers with planning tactical urban missions. The 3D map allows officers to comprehend a mission scenario better than a 2D map because they can visualize how line of sight analysis permits them to move throughout the area.
ATTP 3-06.11 (Combined Arms Operations in Urban Terrain) states, “Understanding the physical characteristics of urban terrain requires a multidimensional approach.” Being able to visualize the urban terrain in 2D and 3D is paramount in the decision-making process of commands and staffs. ArcGIS Pro and Military Tools for ArcGIS enable analysts to produce Tactical Decision Aides in 3D. Using ArcGIS Pro aids in making complex and rapid decisions that military leaders face in planning all missions.

Commenting is not enabled for this article.