In a customer-driven retail environment today, understanding the competitive landscape around your existing or prospective stores helps up your game. Retail businesses need intelligence on where their competition is and whether they can capture more market share or they have already saturated the market in an area. ArcGIS Business Analyst helps analyze your competitors and enables you to stay ahead.
Explore What’s Nearby
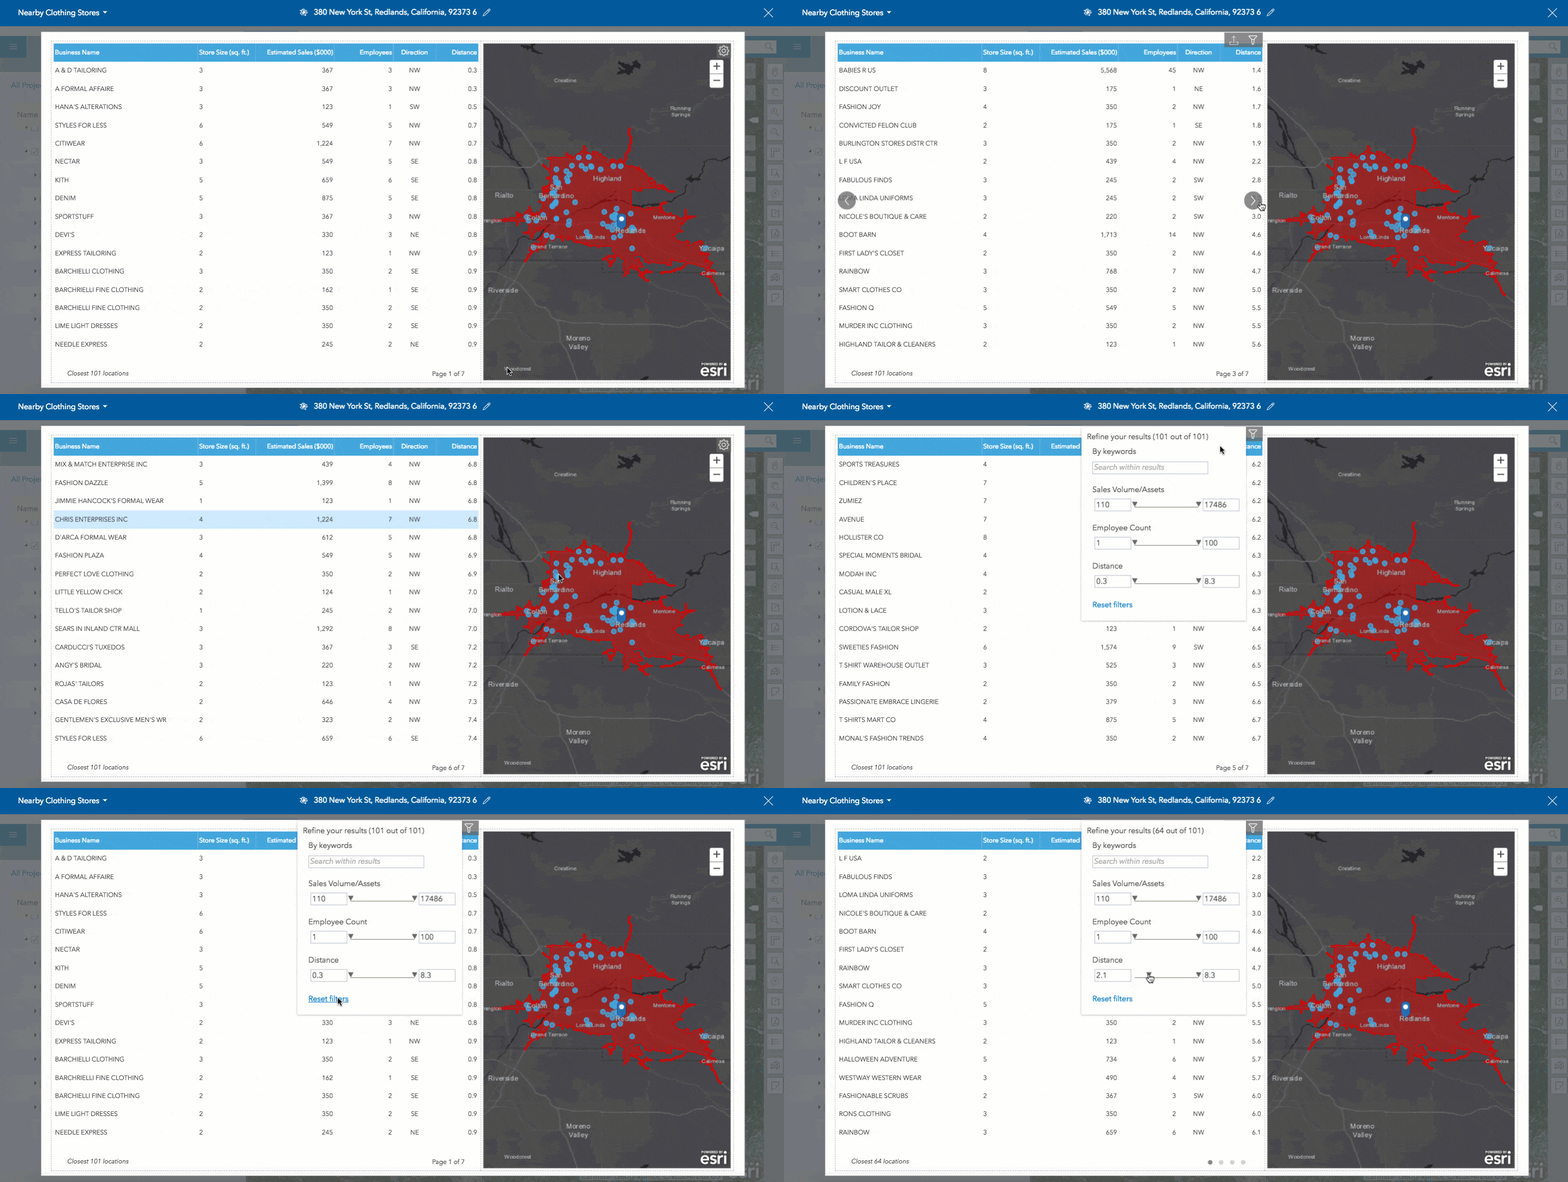
The first step in understanding competition is having a summary of competitive businesses around a location. For example, the interactive visualization below shows the clothing stores that are within the 15 minutes drive time from a new strip mall location. It provides a summary of stores including their count, distance and direction from the mall, store size, estimated sales volume, and employees. It allows to easily filter out smaller clothing businesses and focus on competitors with higher sales volume and employees – helping you be better informed about your competitor locations and their business sizes.

You can do such competitive analysis in just a few clicks using Business Analyst. The visualization above was created using the included Infogroup business data as part of Nearby infographic panels. Simply choose the businesses data option, select the competitor attributes you want to summarize (e.g. sales, employees, store size), define your competitor criteria (e.g. clothing stores), and save this setup as an infographic template. You can then run the infographic template for any location and easily get a competitive summary visualization.
Bring in More Data with Field Research
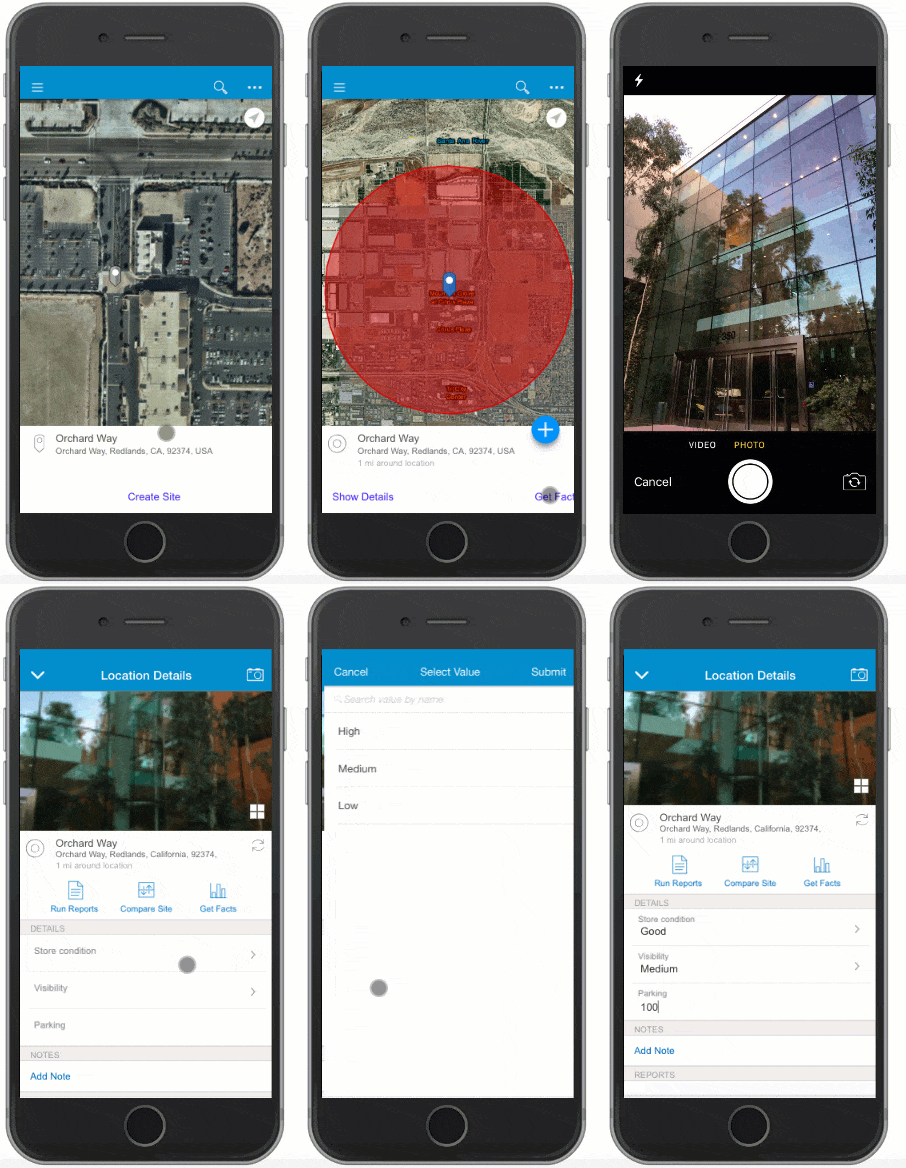
While the included businesses data provides a good baseline competitive summary, you can get more detailed and customized analytics by incorporating field research. You can have your field crew visiting businesses around your location and gathering information using the Business Analyst Mobile App. For example, collect information on parking spaces, store condition, and visibility of competing stores.

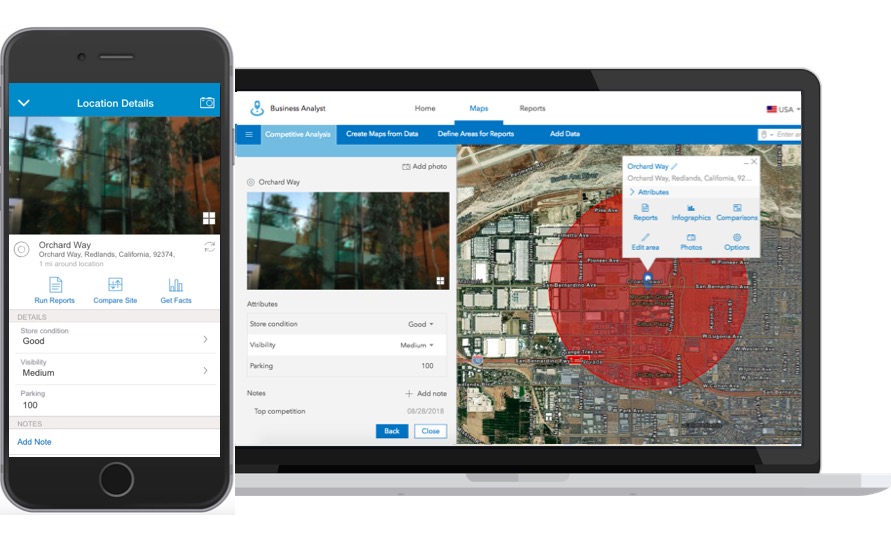
Business Analyst Mobile App allows to use custom attributes and take site pictures. It seamlessly syncs the gathered information to the Business Analyst Web App which can then be used in the Nearby analysis.
Summarize Field Observations
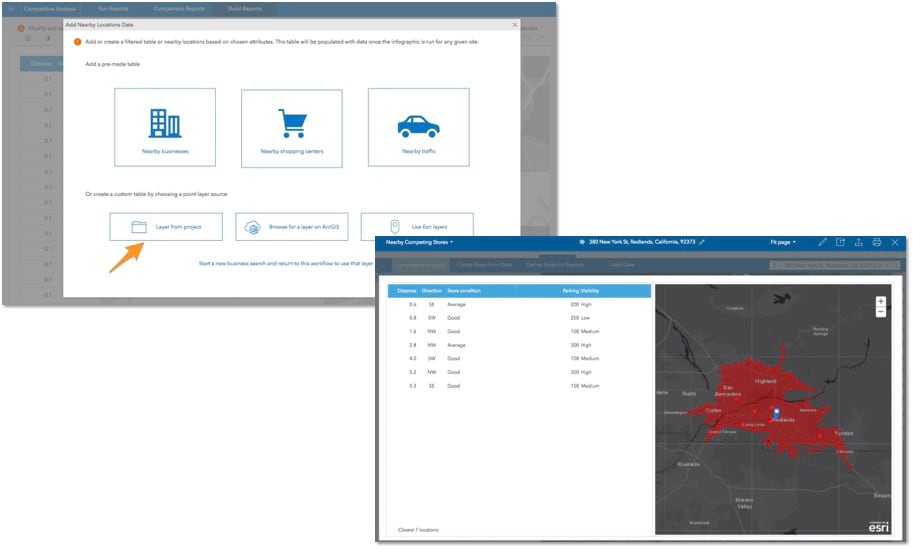
Create a Nearby summary in the Business Analyst Web App using the competing stores information gathered using the Business Analyst Mobile App.

Simply use the Layer from project option, select the competitor locations layer that contains information gathered using the Business Analyst Mobile App, select the additional attributes you want to summarize (e.g. parking spaces, visibility), and save this setup as an infographic template so you can run them for the locations around which you gathered competitive information.

Though minimizing competition is rarely possible, knowing their location, number, and business size helps determine make informed decisions about your existing or prospective stores.
Learn more about Business Analyst.

Commenting is not enabled for this article.