Planners are often met with questions related to quantifying their urban planning proposals, such as:
- Will there be enough green space for residents?
- How will this design affect the local economy?
- What kind of jobs will the development create?
- Which scenario best addresses environmental impact, like stormwater runoff?

Whether you’ve been on the receiving end of these questions as a planner or you’re the one asking them at a local town hall meeting, good questions can create meaningful dialogue and help projects move forward thoughtfully.
For planners, however, having answers to all of these questions isn’t always straightforward—especially in an early planning phase. Calculating the impacts of a design is usually a complex process that requires detailed site plans, specialized engineering software, and manual data entry in spreadsheets.
What if there was a simpler, more accessible way to calculate metrics?
ArcGIS Urban is designed to help planners not only visualize how their city will look as it develops, but also easily manage and understand metrics. It’s like combining the spreadsheets you typically use to analyze site designs with a 3D model of the proposed development—eliminating the hassle of constantly switching between regulatory documents like zoning codes, site plans, and complex spreadsheets.
Metrics are a core functionality in ArcGIS Urban since the very beginning, and planners could already answer some of the questions above in the past. However, questions that involved more complex calculations, such as the example of the green space per residents or stormwater runoff simulations, could not be answered using ArcGIS Urban—until today.
In this release, we’re introducing the new metrics—a novel approach for calculating the impacts of your plans. Complete with a revamped experience supporting more enhanced calculations, you can now configure your metrics more quickly and with greater flexibility. Keep reading to learn more and see what else is included in this release.
A new way to measure impact
The new metrics come with a number of novelties. With this release, we have added the following enhancements:
New metrics graph authoring experience
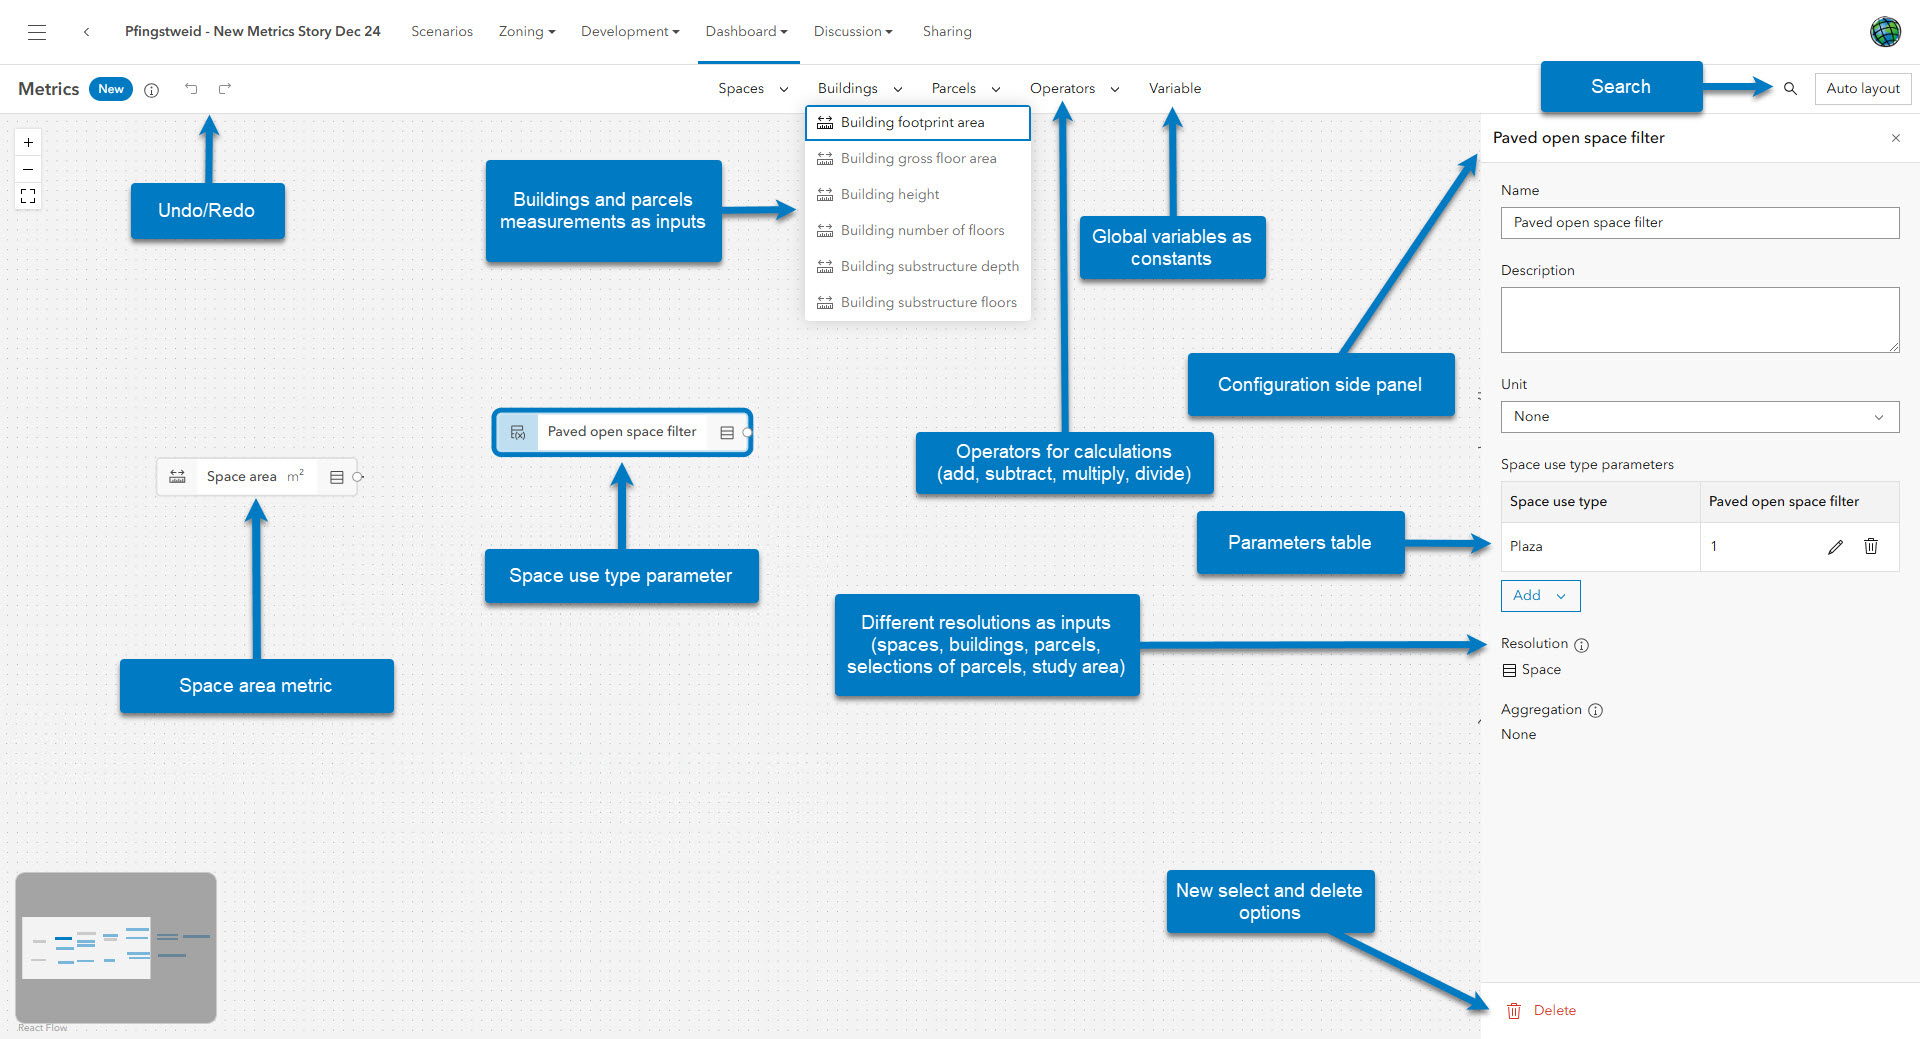
You can now use an enhanced graph authoring experience to manage and configure metrics faster, including undo and redo and a convenient search bar. Besides the visual graph editing, the new side panel provides a comprehensive editing experience for different types of metrics.
In the side panel, you can also set space use type parameters for a metric by entering values in a structured table, eliminating the need to navigate elsewhere in the plan’s settings to do so.

Flexible calculation with additional operators and inputs
There is a range of new operators to calculate metrics, including subtraction, division, rounding & variables, and you can now also base the metric calculation on building and parcel measurements, such as building footprint area, gross floor area, building height, or parcel area. Metrics that you previously configured are converted automatically so that you can extend your existing graph with new calculation methods right away.
And one more thing: besides calculation and units, you can also specify the resolution of the result for each metric which unlocks greater flexibility for in your calculations. The resolution can be set to the level of spaces, parcels, buildings or study area/selection.
Get to know the power of metrics
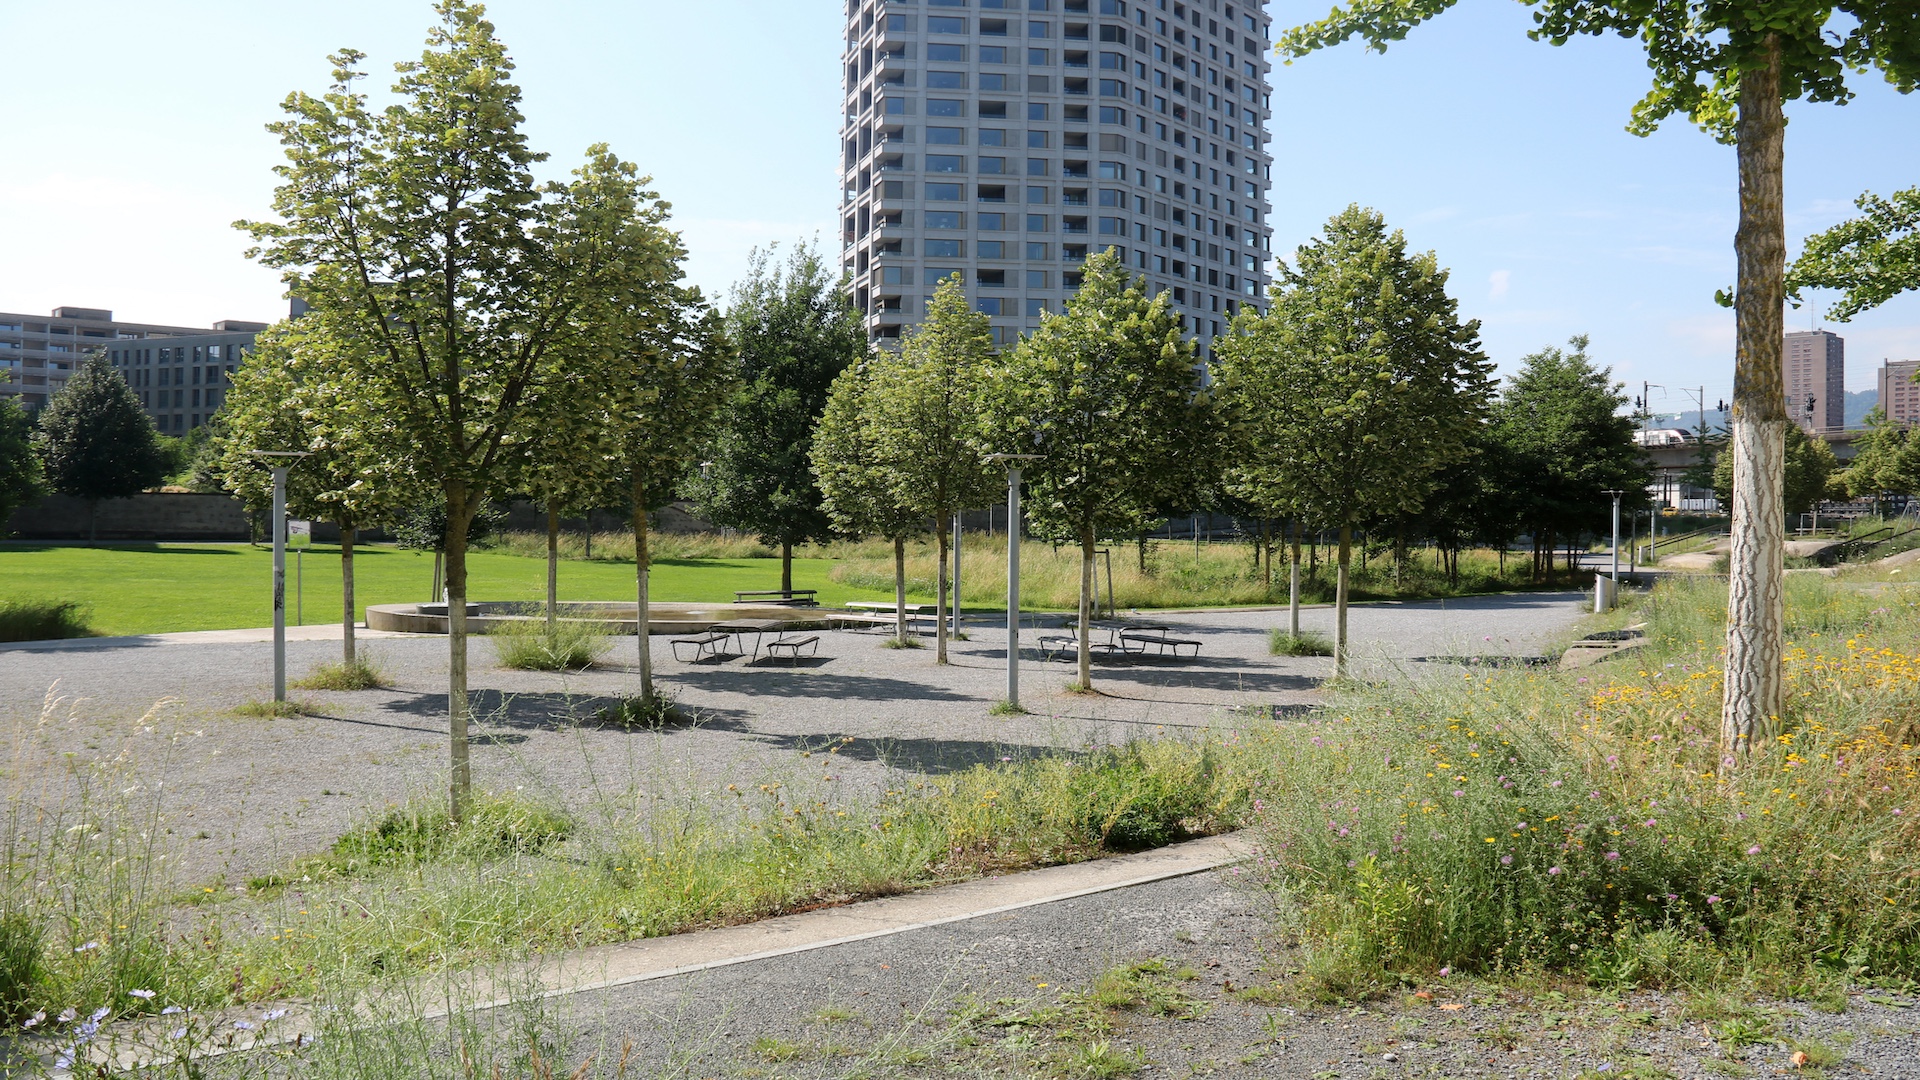
In June, we explored Pfingstweid Park in Zurich, Switzerland, using ArcGIS Urban to add ground cover and analyze green space areas. We’ve built on this example to demonstrate how the new metrics can be used to assess whether the scenarios meet the World Health Organization’s recommendations for open space per resident, and if the drainage capacity can be improved by adding more pervious areas to account for heavy rain events.
To learn more, check out our blog post for a detailed walkthrough on the new metrics experience.

Convert to new metrics
If you’re already using metrics in your plans, you can continue to work with the same editing experience you’re familiar with—for now. We highly recommend converting to the new metrics, as we will continue to add more functionality there in the future.
If you’d like to try the new metrics, you can either start from scratch or convert your metrics and simply enable them in the dashboard. To learn more about the differences, and for a smooth transition converting to the new metrics, follow the instructions in the blog.
What else is new
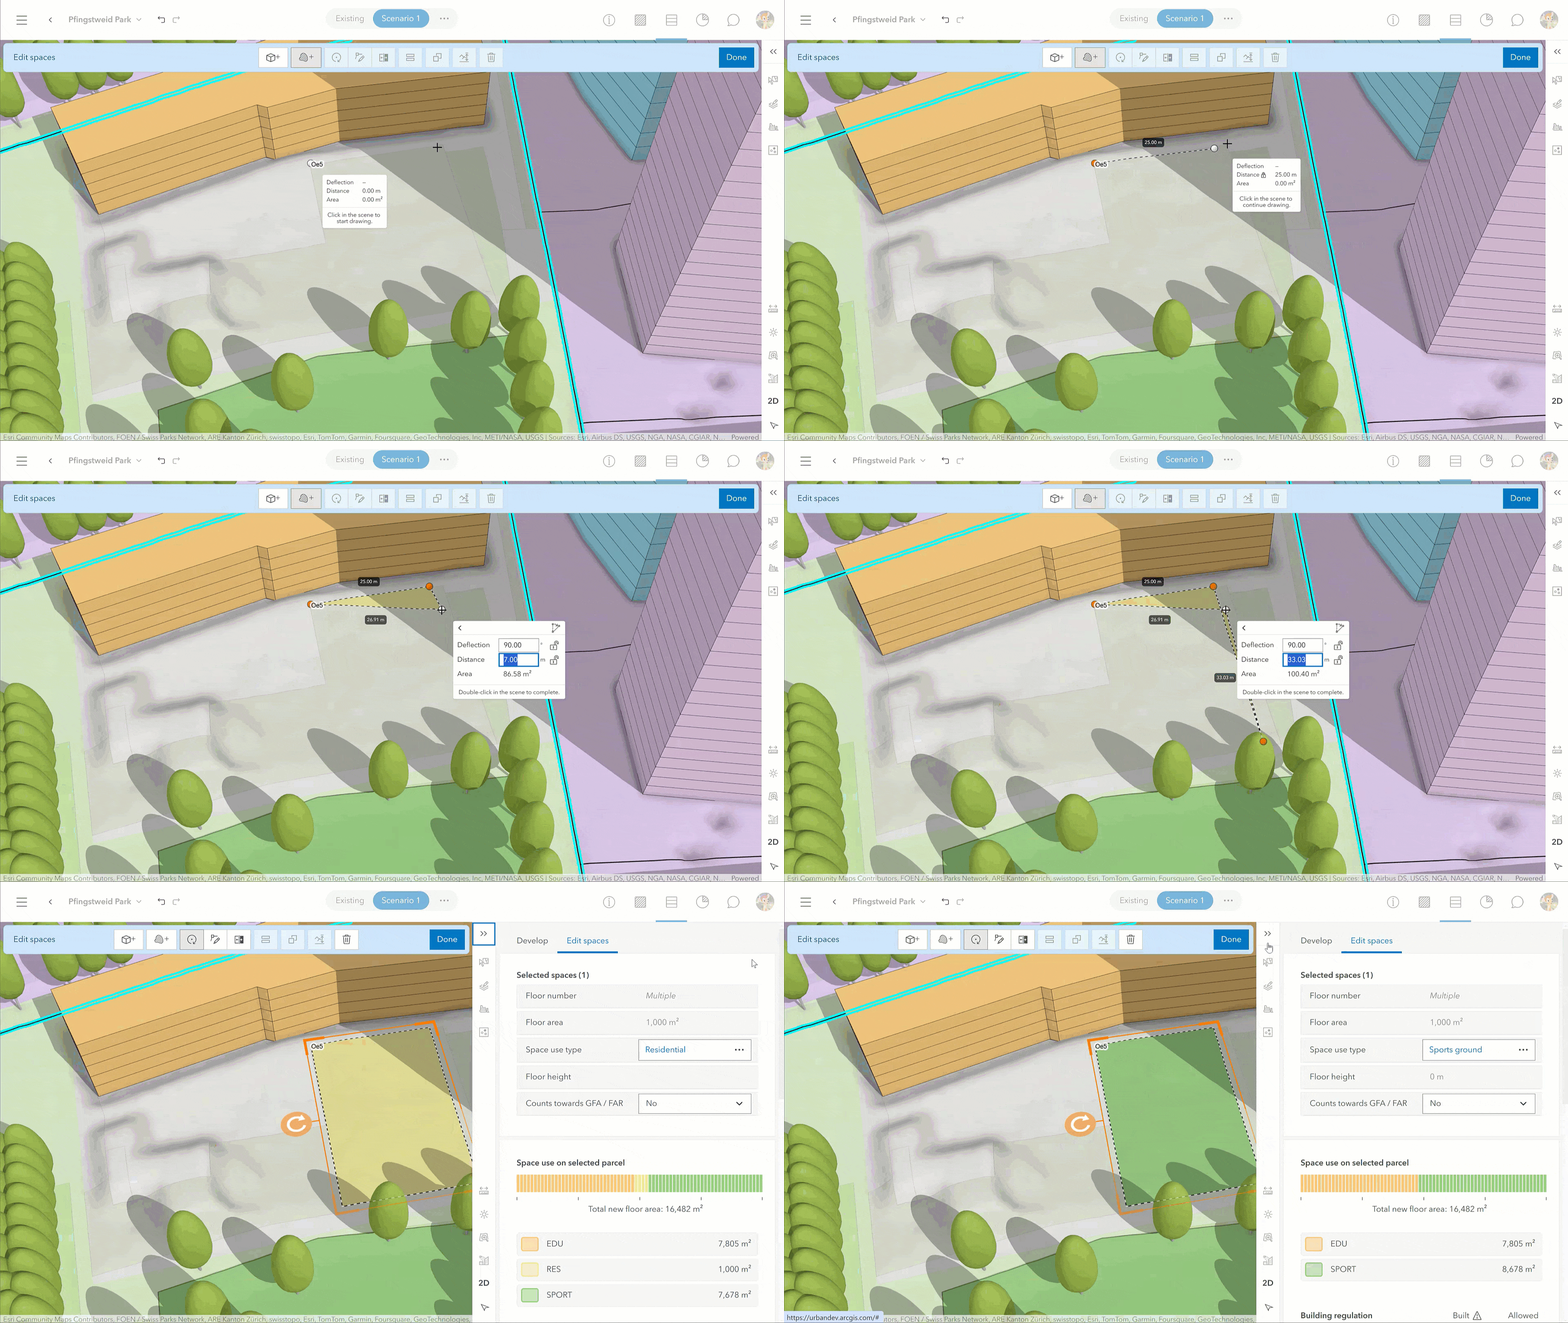
Next to the new metrics, we have a few more highlights in this release that we wanted to share with you. The new viewshed tool lets you explore potential impacts to visibility, identifying blocked view or opportunities to optimize a buildings design or orientation. And support for editing constraints has been extended, allowing you to use numerical inputs not only when creating, but also when editing geometries.
Projects can now be uploaded from point feature layers, to streamline data pipelines. And thumbnails can now be uploaded from different tile formats, including png, jpeg, and jpg.
For the full list of new features and enhancements, check out the release notes.
Additional news and updates
That’s not all! While this release included several new ways to improve how you analyze and manage your designs, here are a few other updates you won’t want to miss:
ArcGIS Urban XR
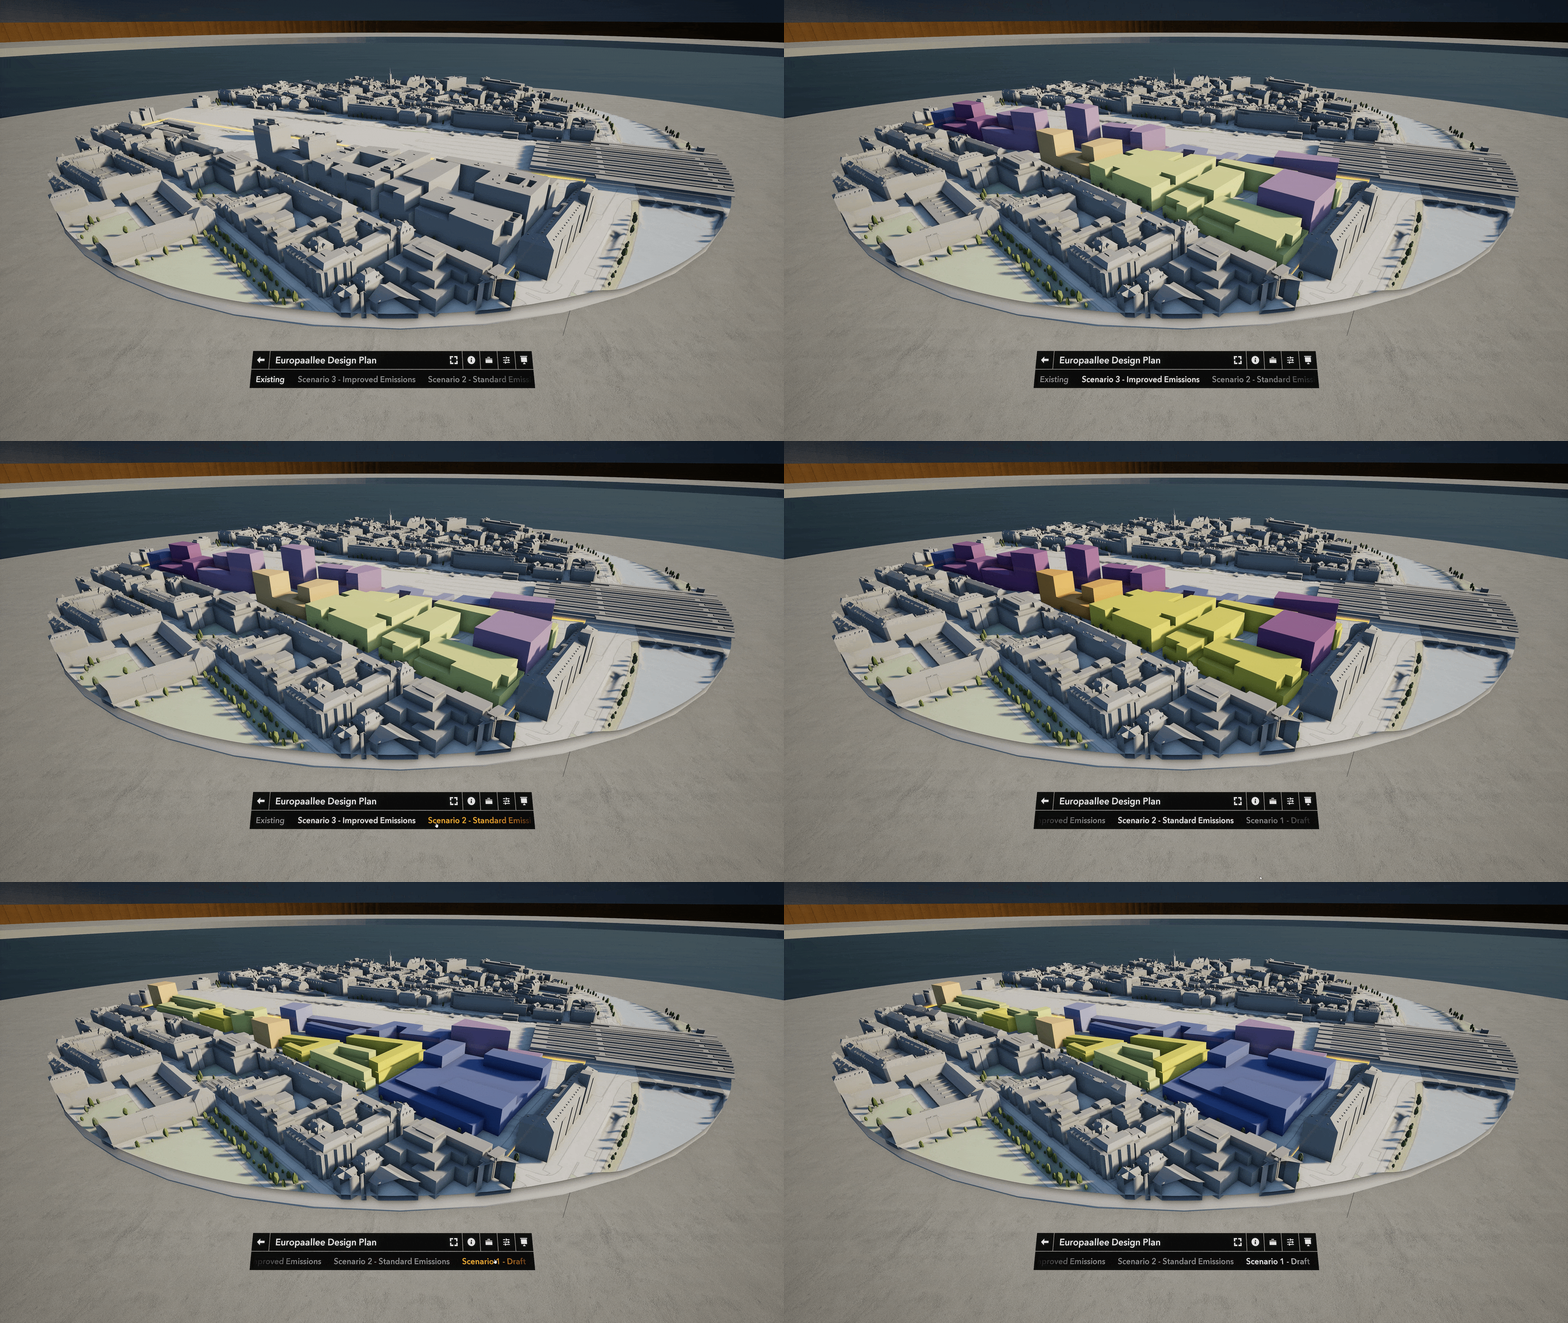
Want to experience your urban models at a true-to-life scale with a VR headset? With the upcoming ArcGIS Urban – Urban XR add-on, you’ll be able to place yourself right into the heart of your project with a desktop or VR headset for a new way to share ideas and conduct virtual site reviews. To learn more about ArcGIS Urban – Urban XR, check out our storymap and sign up to receive free access to the early adopter program, open to existing ArcGIS Urban customers. If you have already signed up through the survey, you will receive an email with the invite to the early adopter program soon.

ArcGIS Urban on ArcGIS Enterprise 11.4
In case you missed it, ArcGIS Urban is now available on ArcGIS Enterprise 11.3 and now on 11.4! In the latest release of ArcGIS Urban Enterprise, you can now copy plans and projects for sharing or version tracking. You can also map surfaces for spaces like parks, plazas, and green space with custom space-use types, and define these surfaces with precise dimensions that match blueprints and architectural renderings.
For a complete look at this release and to learn more about ArcGIS Enterprise, check out the release blog.

ArcGIS Urban API
The Urban API gives planning departments the option to manage their urban models with endpoints and functions that streamline workflows, enhance data interoperability, and support the creation of custom applications tailored to their needs.
In this release, the Urban API provides access to configure the new metrics as detailed above, enabling automation and extension of metric workflows. Additionally, the spatial attribute field now includes a new `alternativeWkids` field which returns all spatial references to efficiently manage data reprojection, particularly when working with various products.
Watch the video
Check out this short 2-minute video to see these new updates in action.
As always, let us know if you have any feedback or questions by connecting with us on the ArcGIS Urban Esri Community page.


Article Discussion: