By carefully designing the space between the buildings, urban planners can significantly contribute to livable and resilient future developments. Specifically, green space and other pervious surfaces deserve special attention. Easy access to green space for relaxation, exercise, and social interaction is important for the well-being of individuals. At the same time, green space and other pervious surfaces can absorb rainwater, reduce runoff and the strain on the drainage system, and minimize the risk of flooding during heavy rain events.
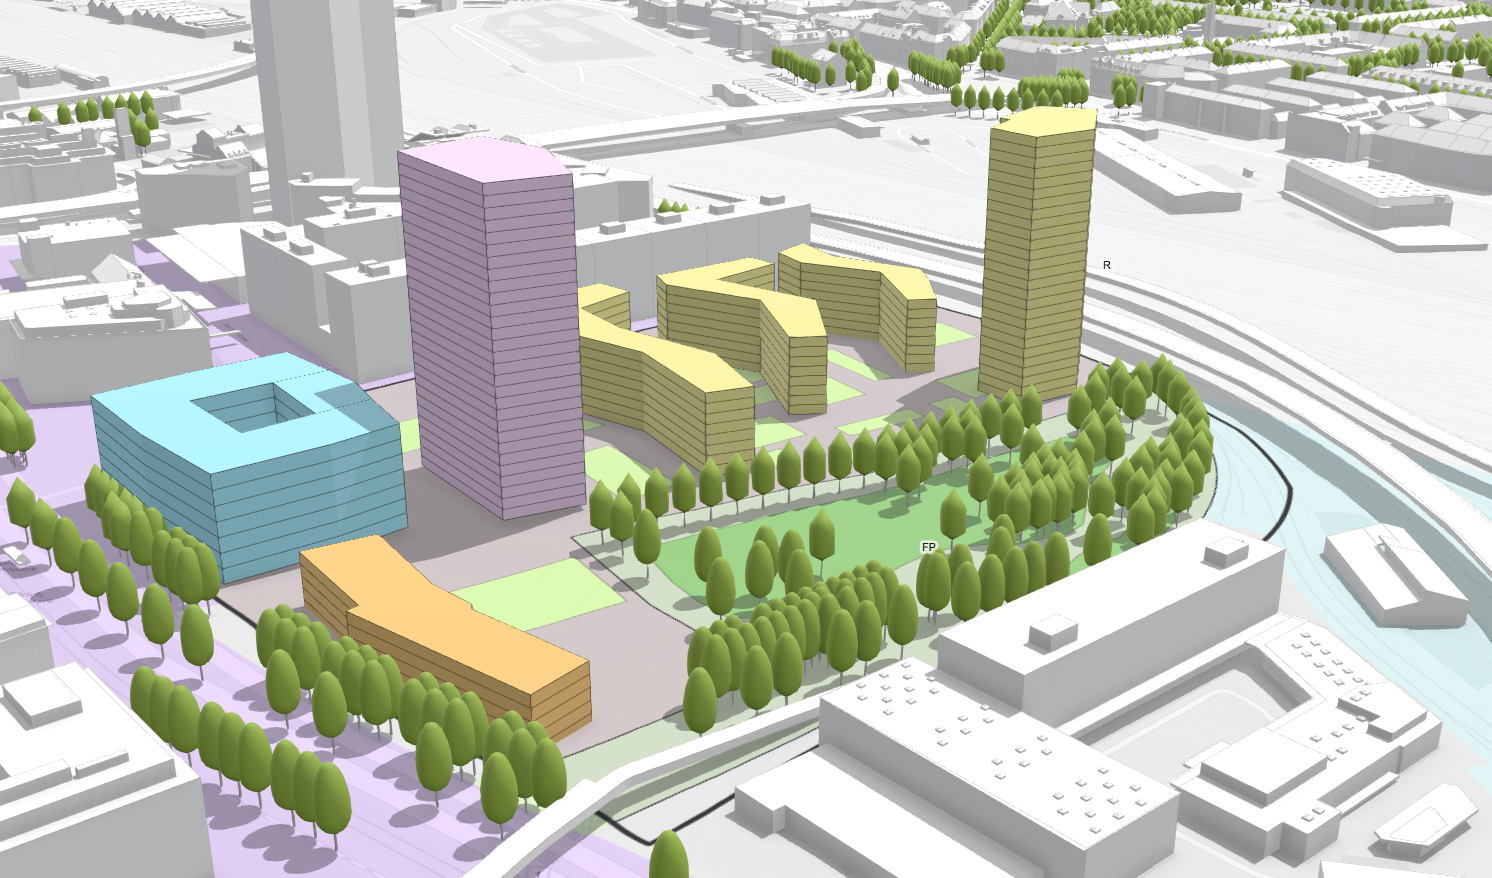
In this blog post, you’ll learn how ArcGIS Urban’s new metrics allow you to quantify your proposed developments in terms of green space and pervious surfaces and how they contribute to increased flooding resilience. The Pfingstweid Park in Zurich, Switzerland, will be our example to show you the power of the new metrics. You probably know the Pfingstweid Park from one of our earlier blog posts.
Verify greenspace requirements
Imagine yourself as an urban planner for the City of Zurich. Your task is to ensure that every new development meets two requirements related to green space:
- The development provides at least 9m2 of green space per person.
- The runoff of a heavy rain event does not exceed the drainage capacity.
Today, you’re verifying these conditions for the Pfingstweid Park.
Assess green space per resident in Pfingstweid Park
Calculate the number of residents
Let’s start by calculating the number of residents in Pfingstweid Park. We divide the net area of all residential spaces by the area each person uses on average for living. The net area is the area of a building floor available for its assigned purpose. It excludes walls and staircases. The new space-use types table allows us to easily configure different living space consumption values depending on each residential space-use type.
With the new metrics you can now also configure the resolution of a metric result. Think of the resolution as the metric calculation granularity. Ranging from high granularity to low granularity, you can control whether a metric is calculated per space, per parcel, or for a selection of parcels. Metrics calculated at a high granularity can be aggregated to a lower granularity. In the first step, we calculate the number of residents per space.
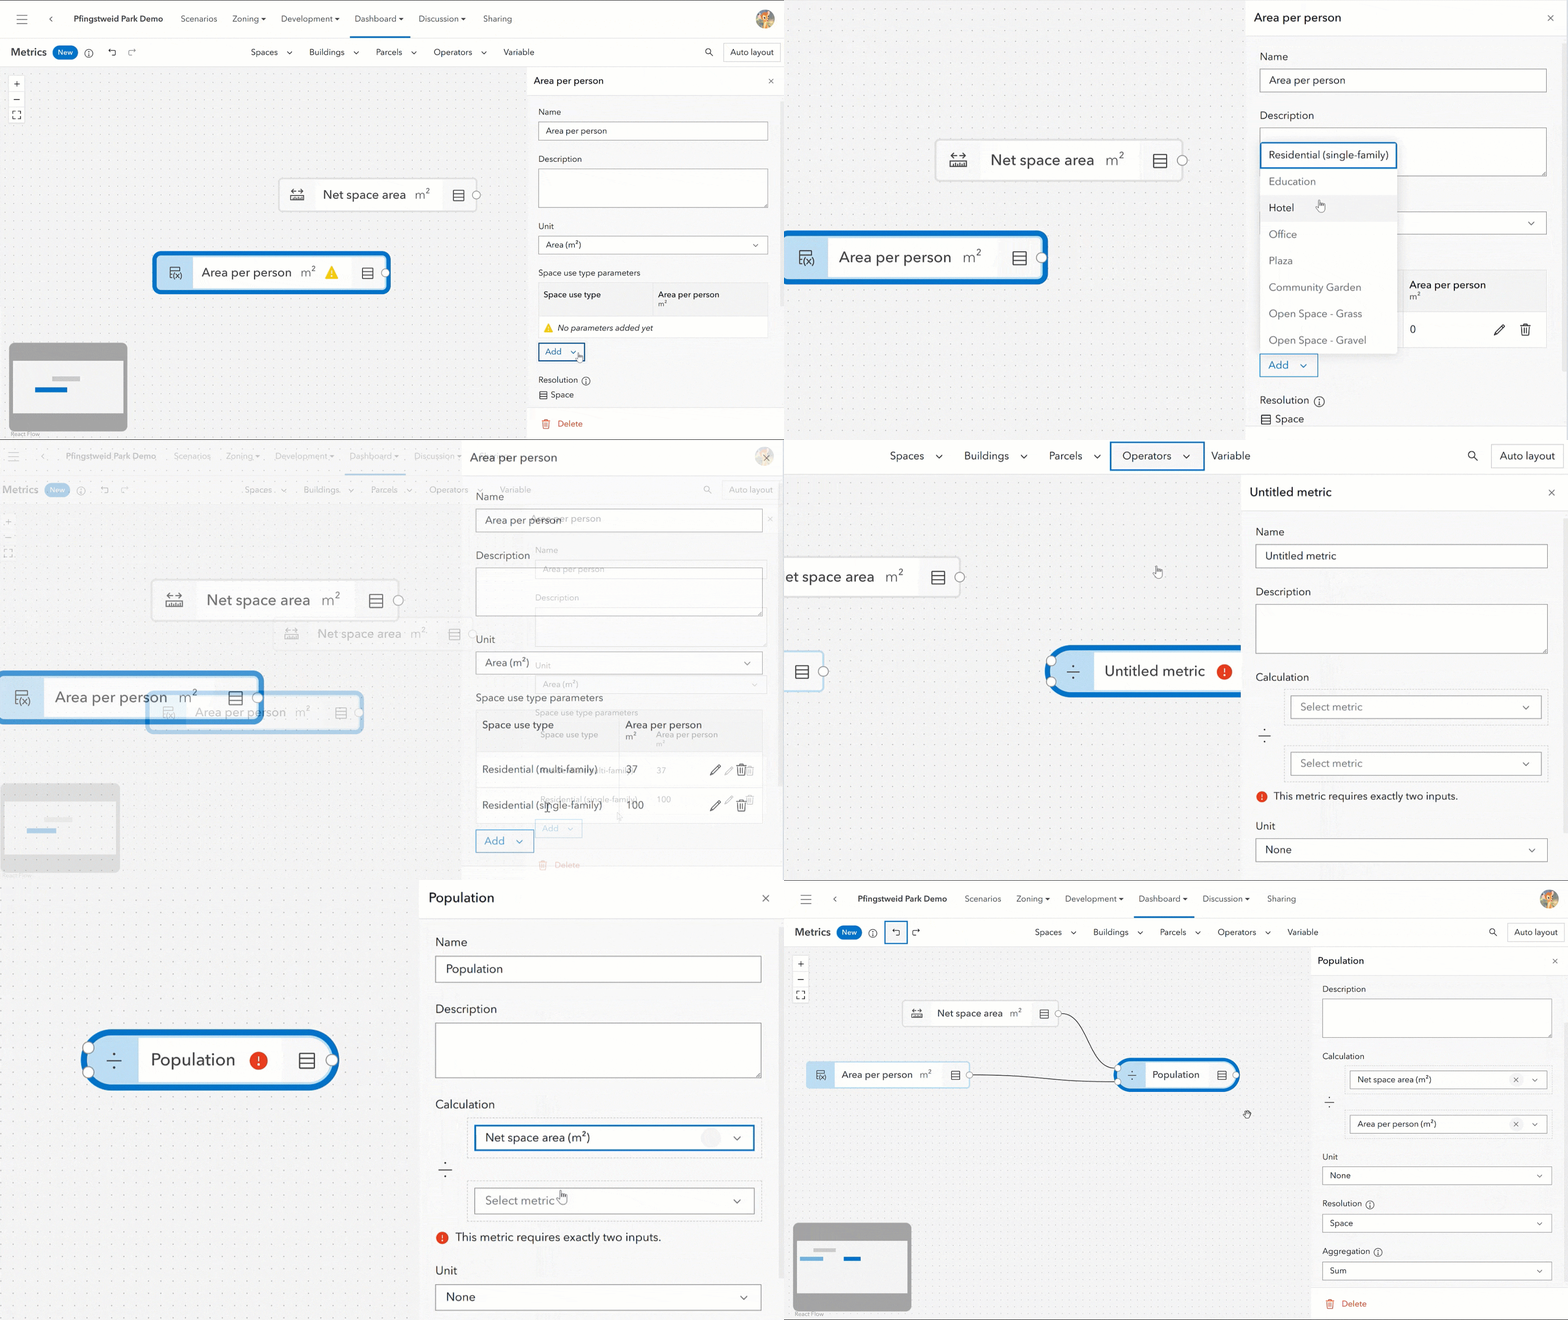
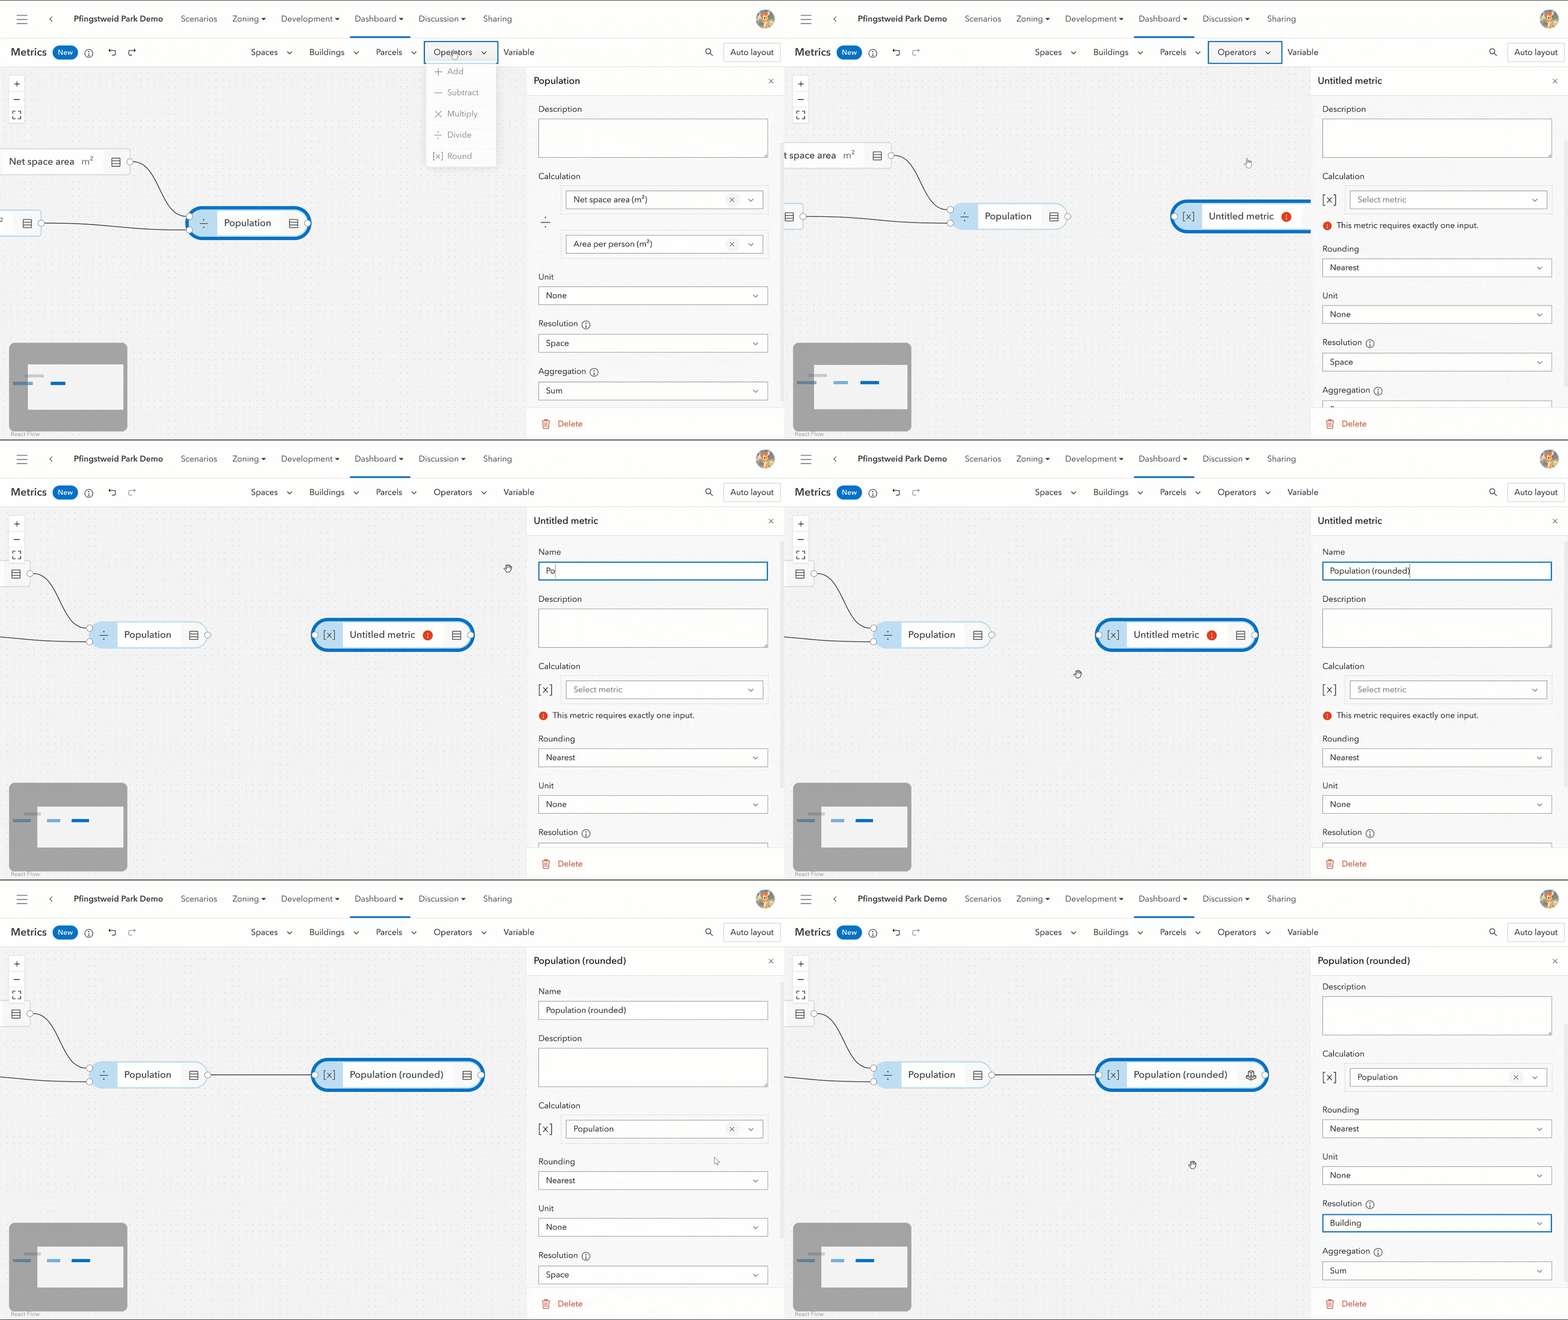
In the next step, we want to report the number of residents as a whole number per building. The new metrics allow us to configure this using the rounding operator and selecting the building resolution.
Green space per person
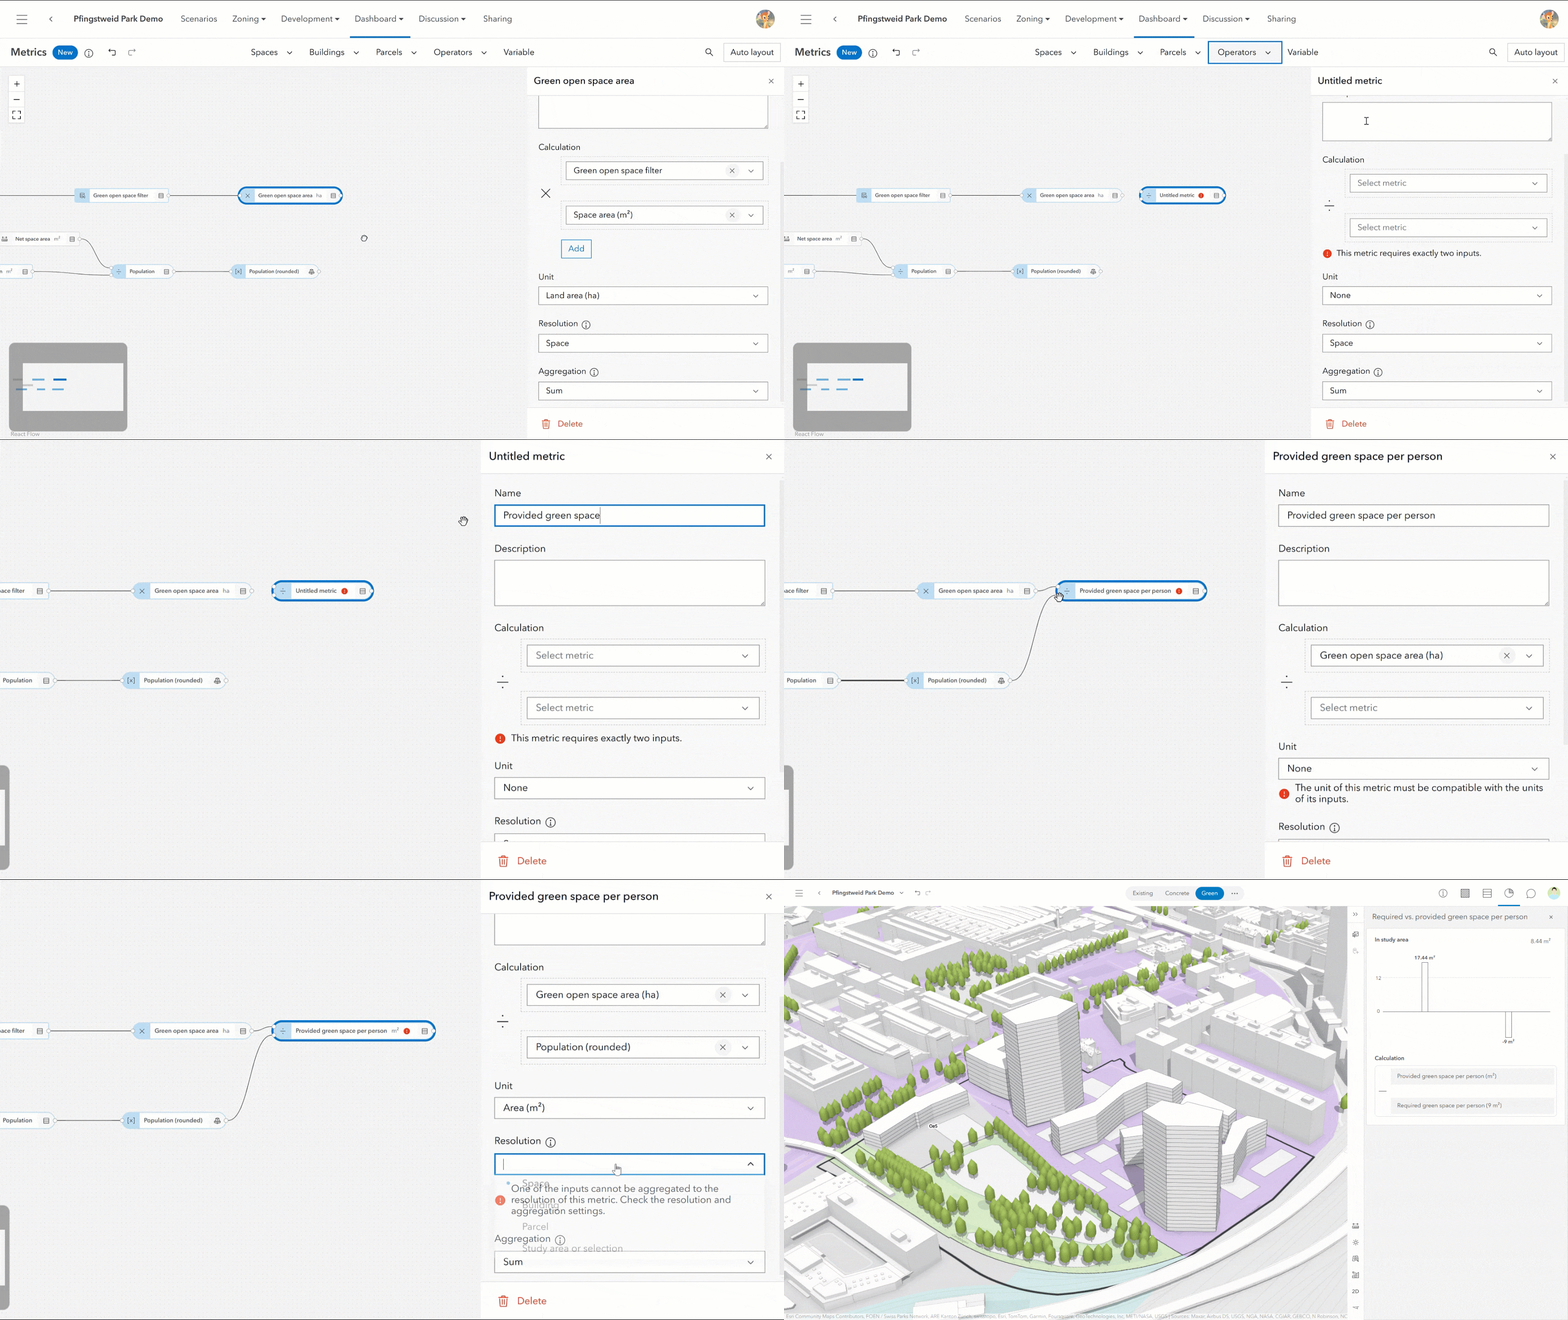
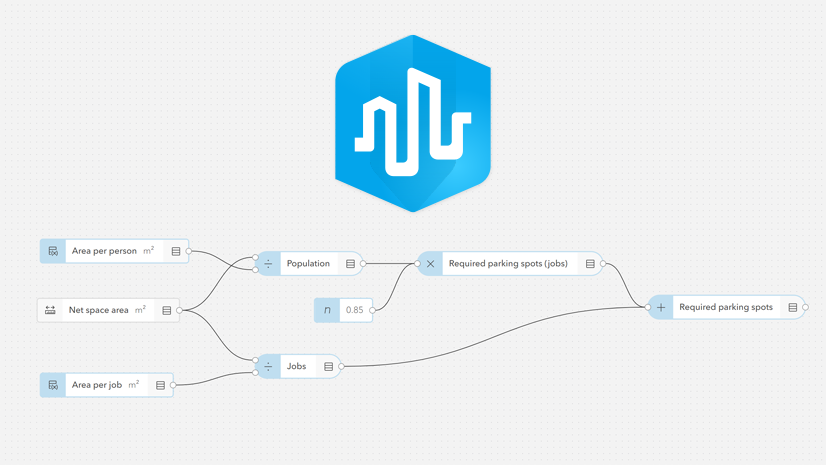
The new metrics also allow you to divide one metric by another. This comes in handy for assessing the available green space per person. We already know the number of residents in Pfingstweid Park. Now, we also need to know the total green open space in the study area. We can achieve this in two steps:
- First, we configure a space-use type parameter of “1” for all space-use types pervious to water. It lets us distinguish pervious from impervious space-use types.
- Then, we multiply this space-use type parameter with the new built-in space area metric.

After configuring the metric that sums up the green open space area over the whole study area, we can now divide that metric by the population metric. We can use the resulting “Provided green space per person” metric to report on the green space area per person for the entire study area or just for a subset of selected parcels.
We can see in the plan dashboard that Pfingstweid Park is fully compliant with the 9m2 green space per person requirement.
Compare heavy rain event runoff against drainage capacity
The new metrics also allow you to include building or parcel measurements in the metric calculation. Examples of building measurements include the number of floors or the building footprint area. Examples of parcel measurements include the parcel area. Additionally, you can now also use variable values as metric calculation inputs. We will use these new capabilities to verify if the runoff of a heavy rain event doesn’t exceed the drainage capacity of Pfingstweid Park.
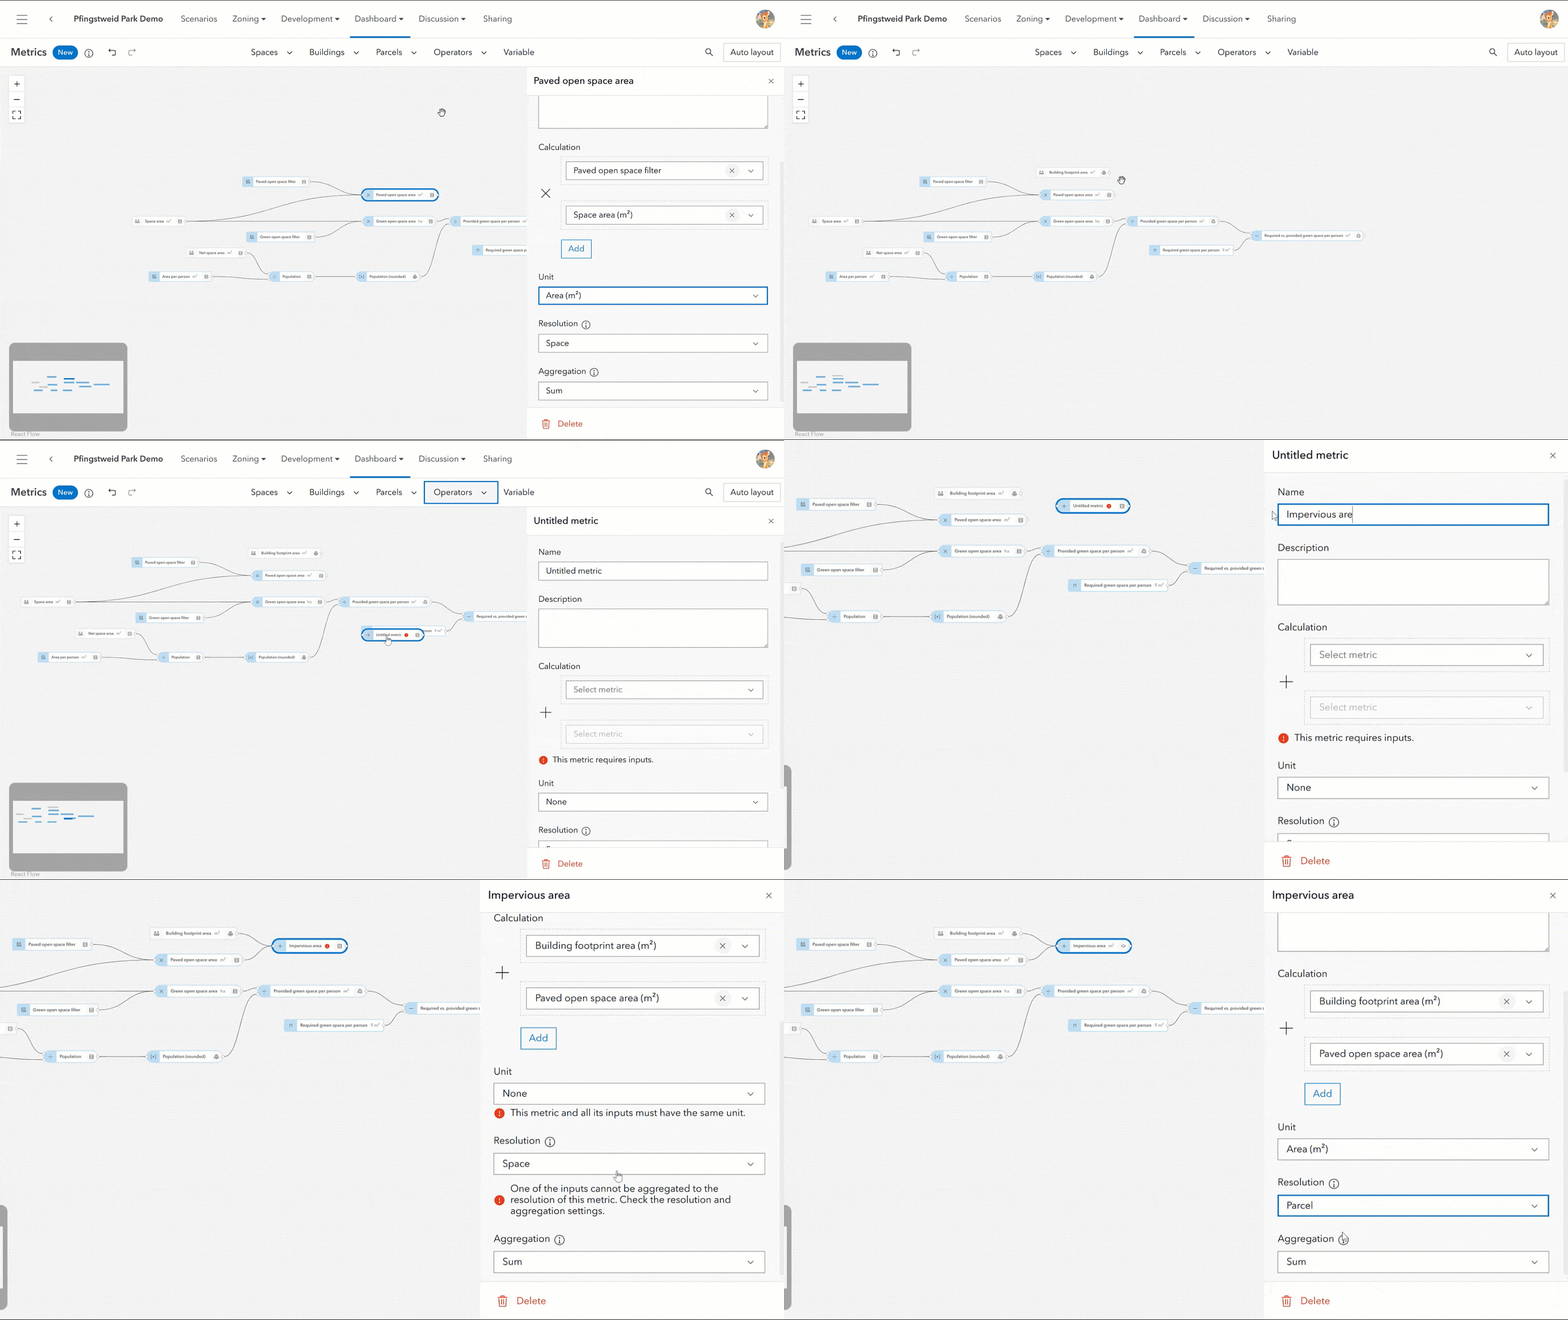
Determine impervious area
First, we need to know the total amount of impervious surfaces in Pfingstweid Park. Impervious surfaces are the sum of sealed open space such as concrete pathways and all the building footprints. For the sealed open space area, we can configure a metric similar to the earlier green space metric. The built-in building footprint area metric provides the total area the buildings cover.
Calculate heavy rain event runoff
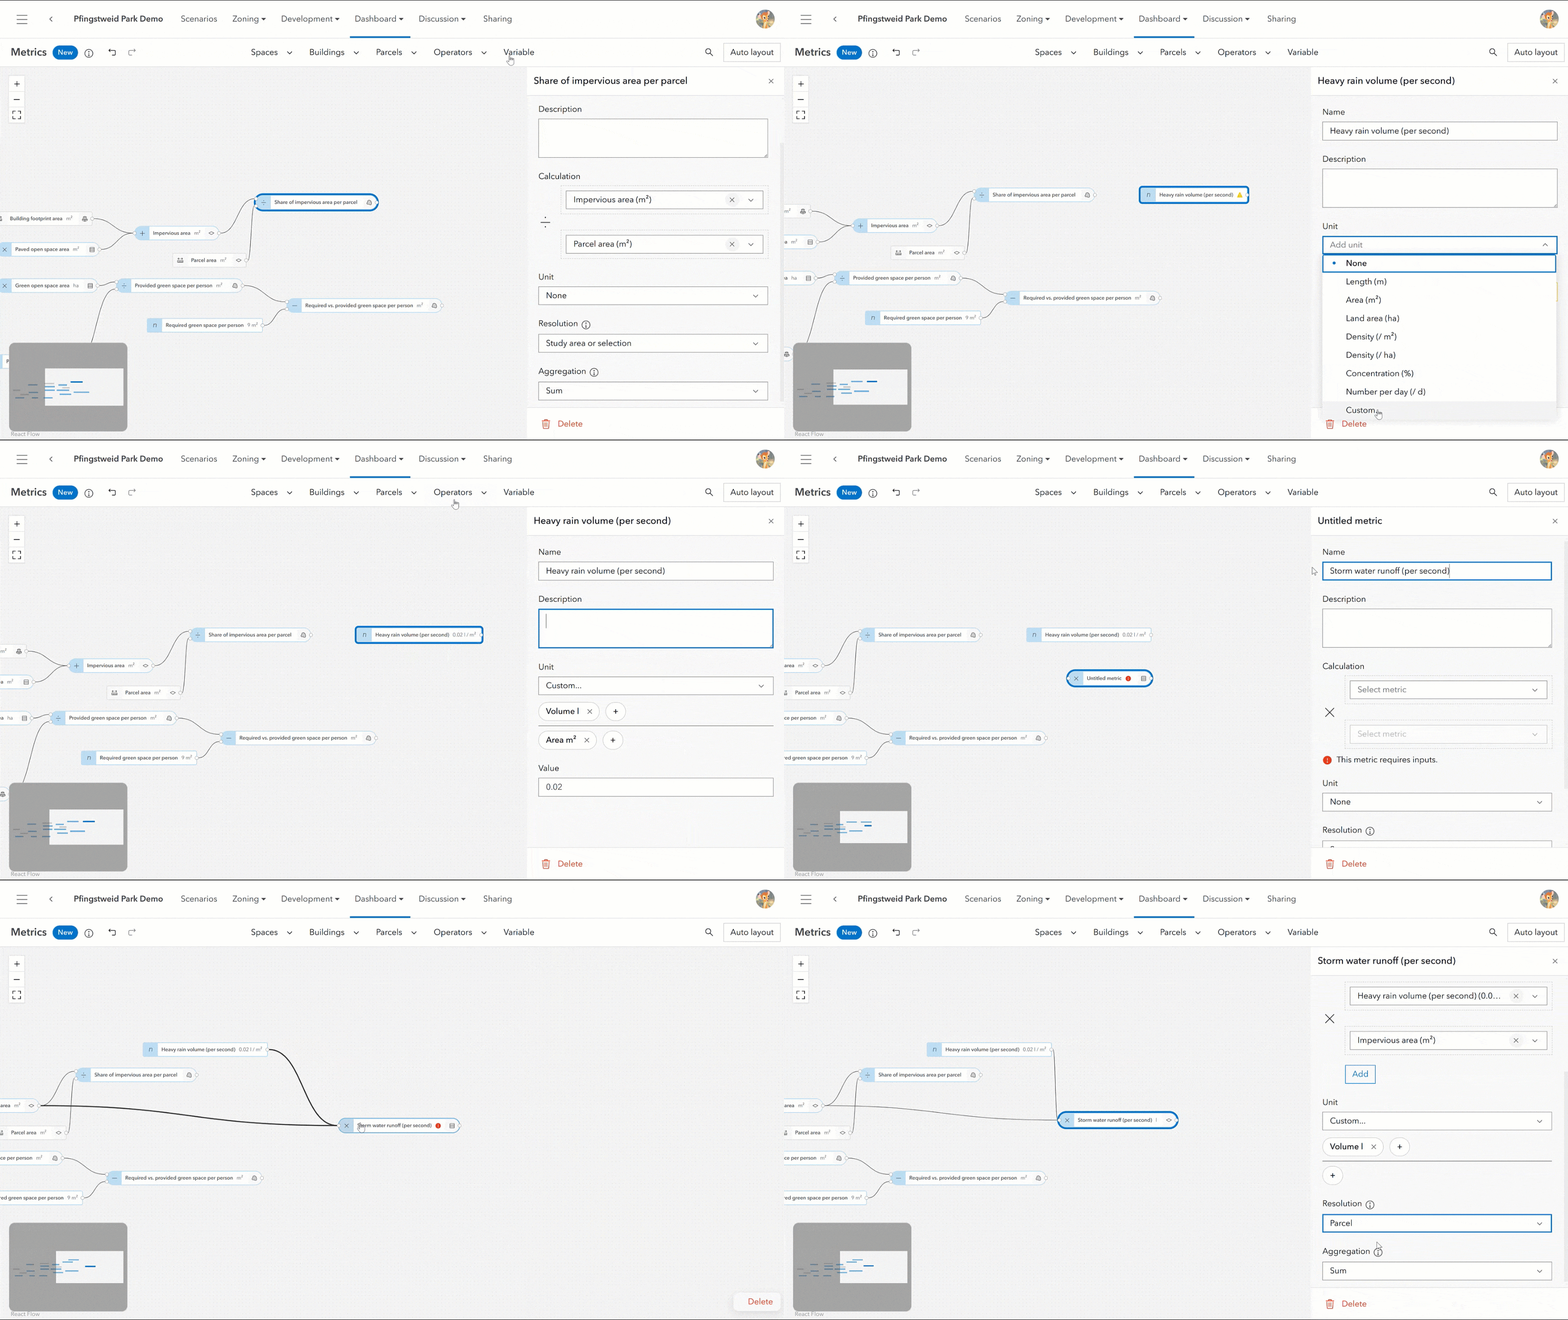
We define a precipitation volume of 0.02l/m2 per second as a heavy rain event. The new metrics allow us to configure this value as a metric variable and use it in further metric calculations. By multiplying it with the total amount of impervious surfaces, we get to the stormwater runoff per second.
Compare runoff with drainage capacity
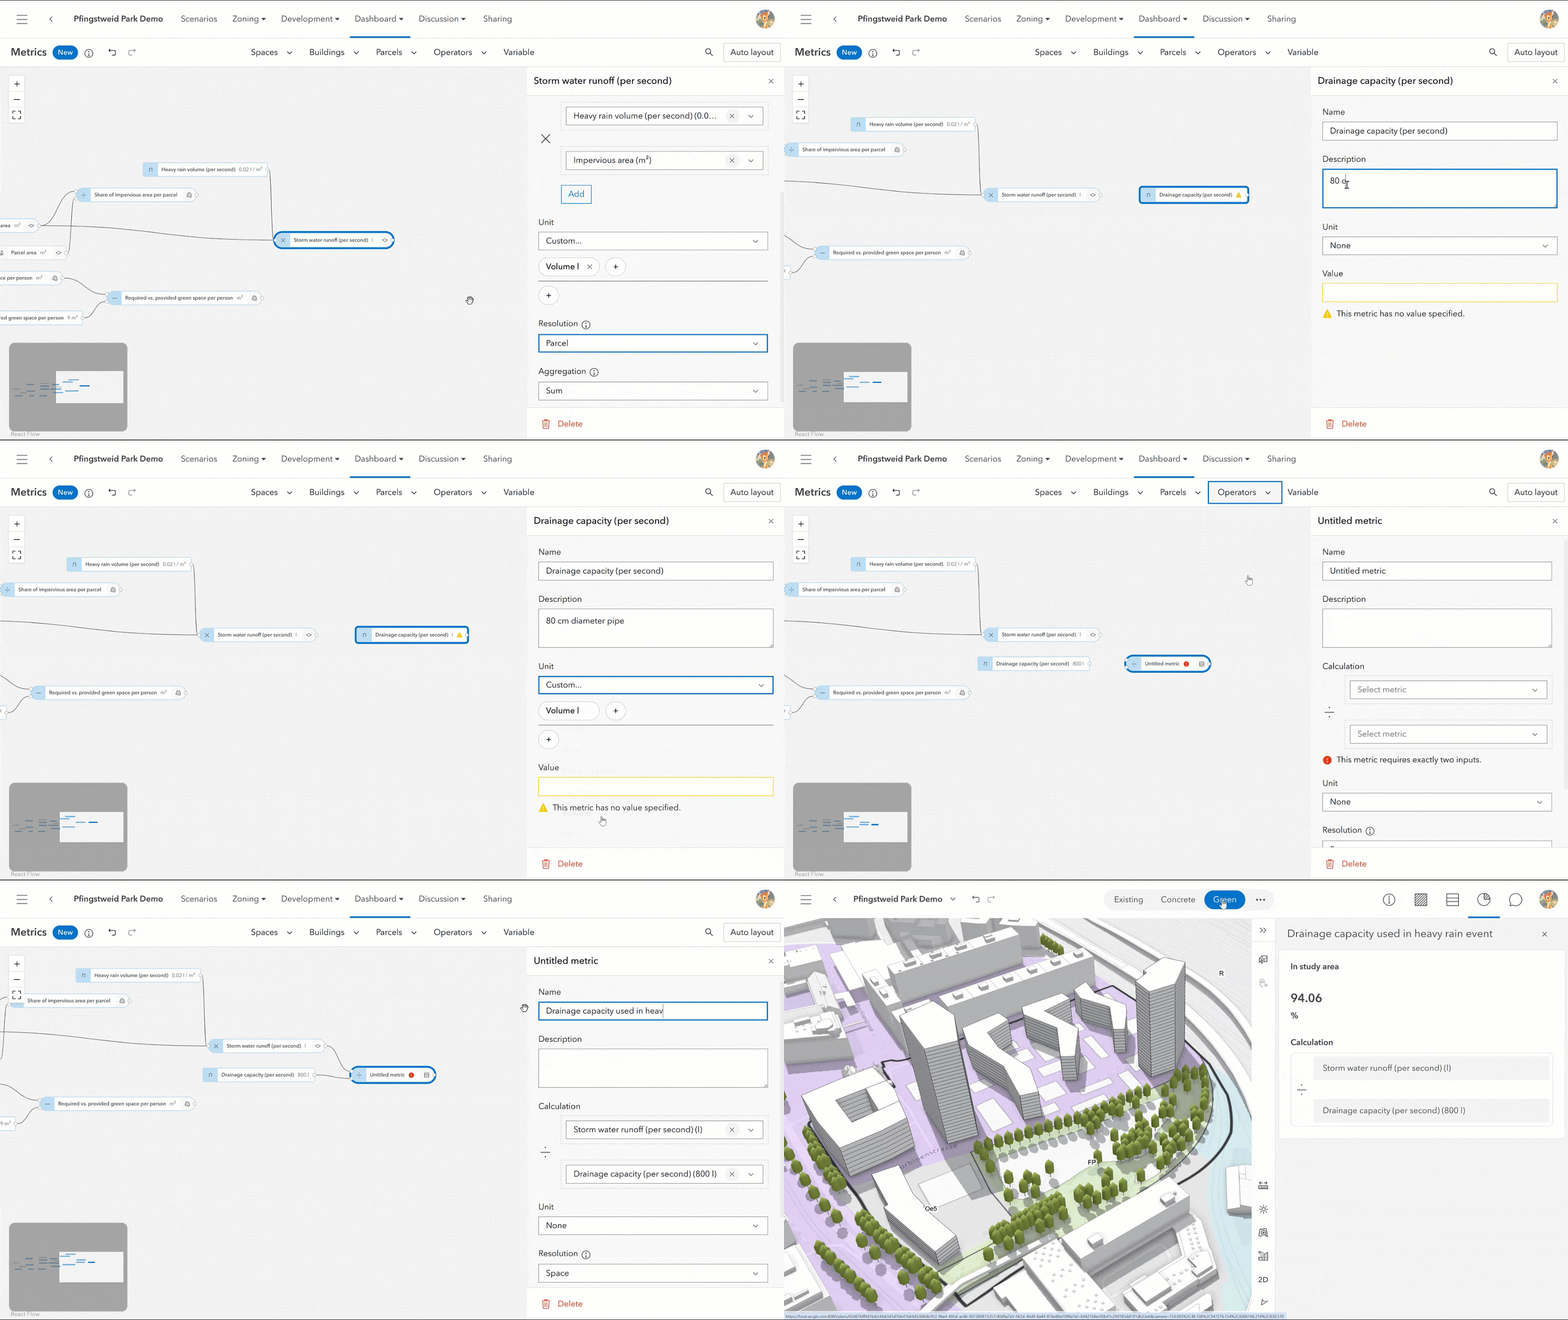
We know from our colleagues in the waste management department that the current sewage capacity for Pfingstweid Park is 800l per second. We can configure this value as a variable and compare it with the previously calculated stormwater runoff metric. This allows us to assess whether or not Pfingstweid Park’s heavy rain event runoff exceeds the current drainage capacity.
As we can see in the plan dashboard, the heavy rain event runoff does not exceed Pfingstweid Park’s drainage capacity. This is also thanks to the significant amount of pervious surfaces.
Metric graph editing made easy
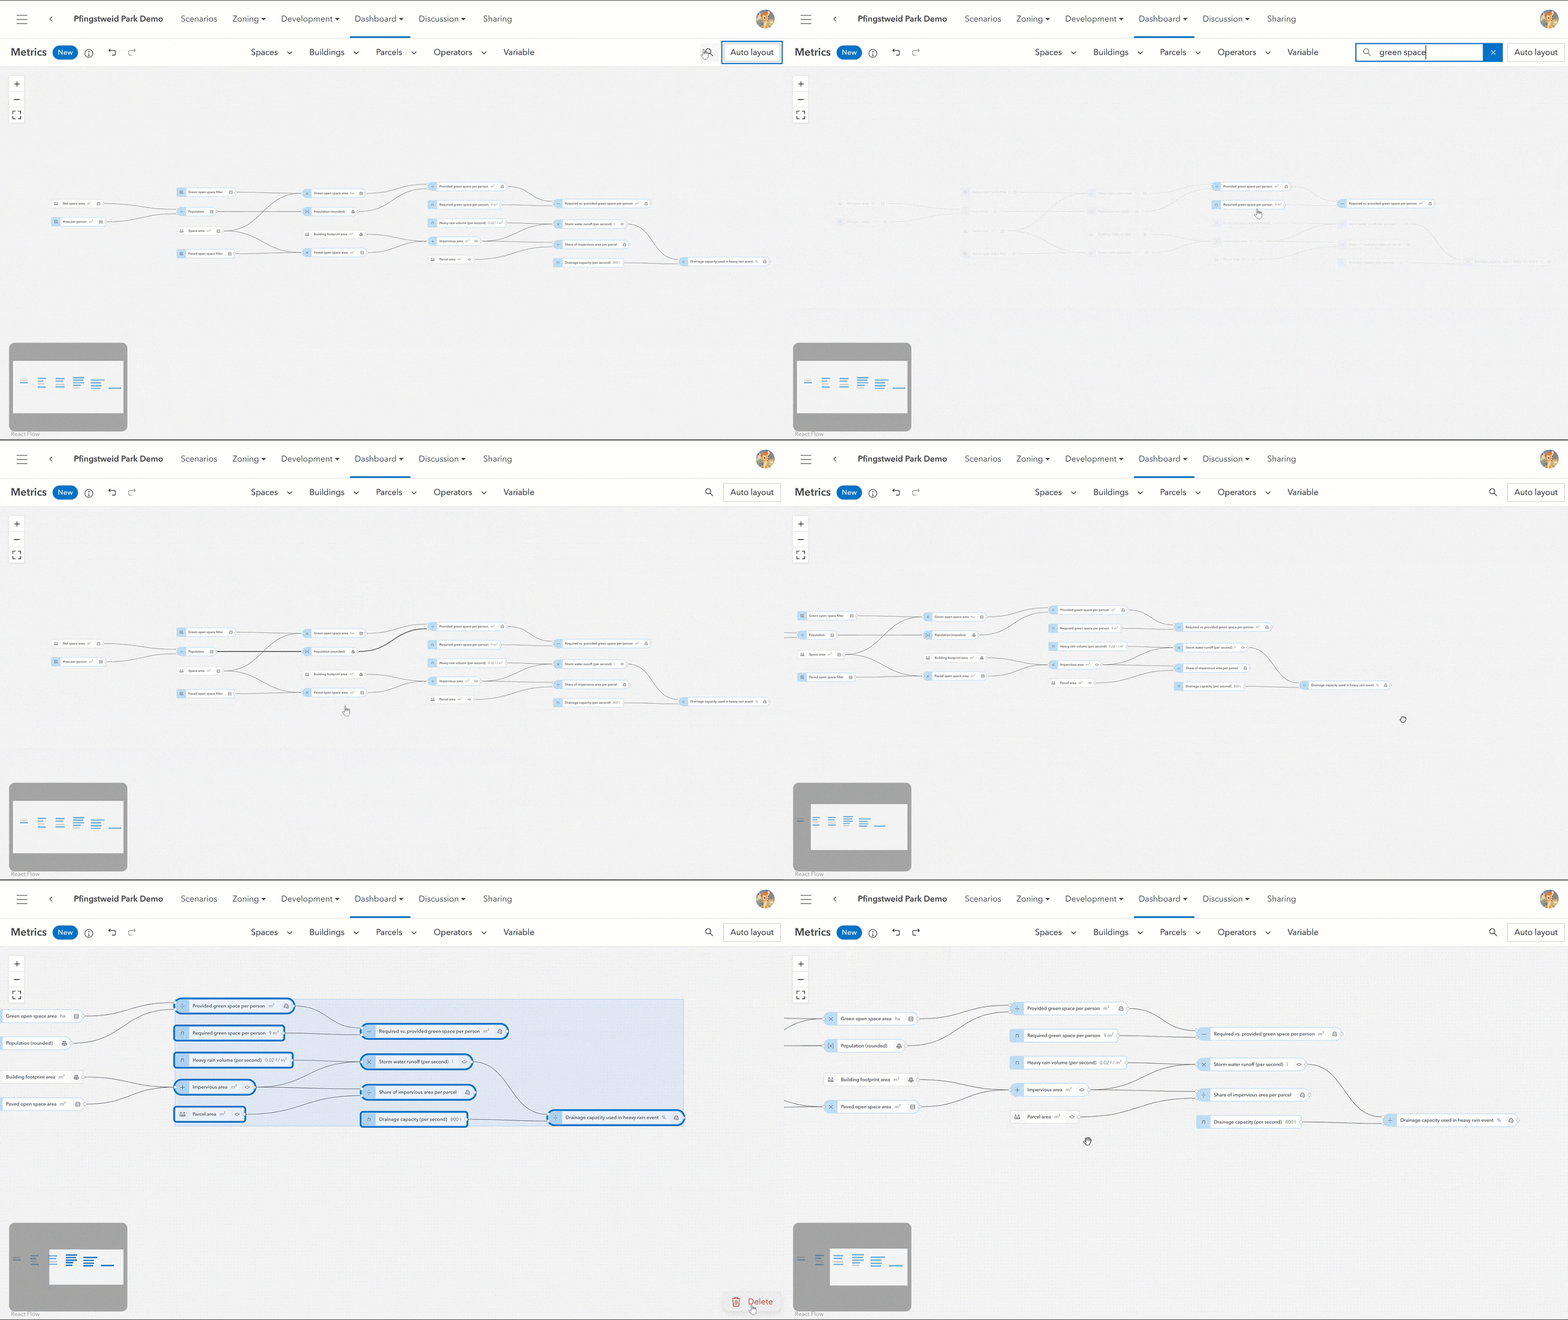
As you’ve seen above, the new metrics graph comes with an intuitive side panel that allows detailed configuration of different metrics, as an alternative to the visual graph editing. And that’s not all. The new metrics graph experience also comes with undo/redo. This allows you to undo and redo any unintended edits to your metrics easily.
Thanks to the new and improved search functionality, it’s also easy to keep an overview of the metrics in your graph. This is especially important for navigating large graphs with complex calculations.
Key takeaways
The new metrics in Urban come with a simplified user experience. New operators and built-in metrics unlock additional calculation possibilities. Unintended edits to the graph can be undone easily. A new search functionality helps you not lose track of all the metrics in the graph.



Article Discussion: