The Streamflow Viewer Instant app template allows app viewers fast visualization to explore streamflow forecasts. This new app incorporates two streamflow services: the GEOGLOWS Streamflow forecast service, a 10-day river forecast from the European Centre for Medium-range Weather Forecasting (ECMWF), or the United States National Water Model, a 10-day river forecast from the National Weather Service. These services are updated daily. The app includes an interactive graph showing streamflow forecasts through time. The app automatically incorporates the streamflow forecast service, making it simple for anyone with an ArcGIS Online map to publish a web application with an integrated streamflow layer and forecast hydrograph.

Setup the app
In Streamflow Viewer, you can add any map to the application. There are no data requirements for the app. You do not need to add either streamflow forecast to your webmap; it will be added automatically when you create the app. The app can be created from the Instant Apps home page, the Create app option in the Map Viewer, or the Create web app option from the item details page of a web map.
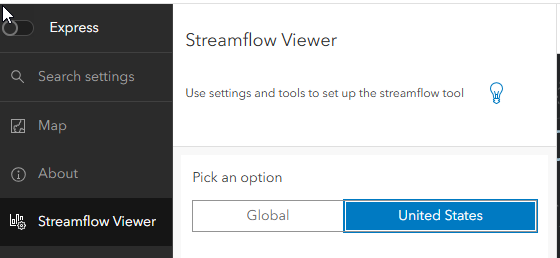
Once your map is added to the app, you can choose between the Global or United States models. The global model provides a daily 51-member ensemble streamflow forecast for around 7 million reaches across the globe. The US National Water Model covers the contiguous United States.

You can begin configuring the other available setting
- Header —Choose to include or not include a header in the app.
- Basemap toggle – Choose a basemap to switch to
- Theme settings—Change the app’s appearance by applying dark or light mode, adding a logo to the header, and using custom or predefined colors to style specific elements.
- Basic map navigation tools —Include Home, Zoom tools, Legend, or Search in the map.
- Sharing—Add options for app users to share the app. If a stream’s popup and chart are open, the app will be shared with that specific stream. Optionally, include embed and social sharing.
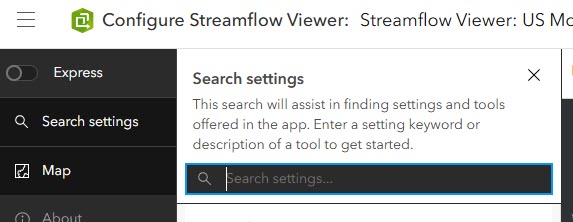
This is not a complete list of available options. Disable express mode and/or use the search settings option to find additional options.

Interact with the graph and time slider.
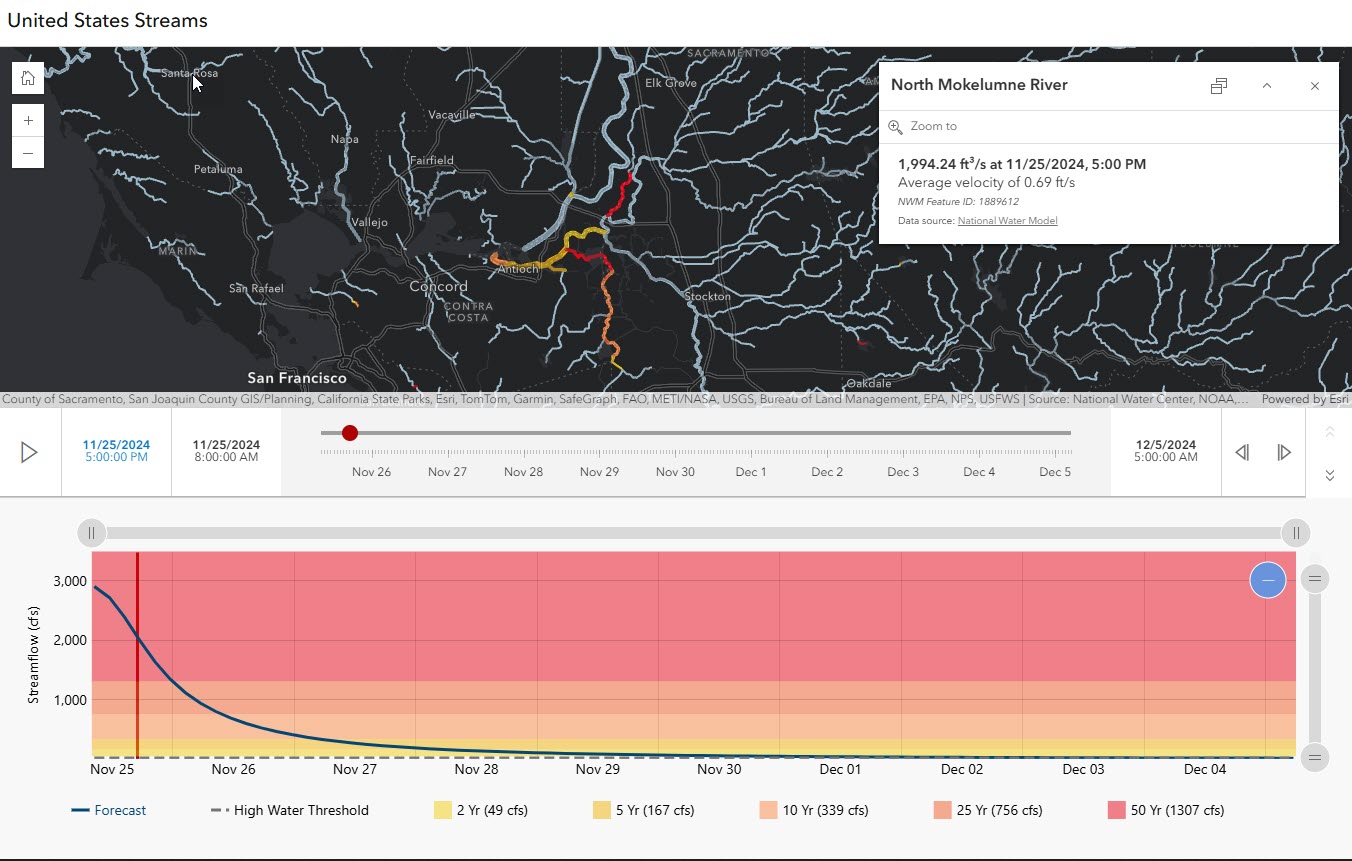
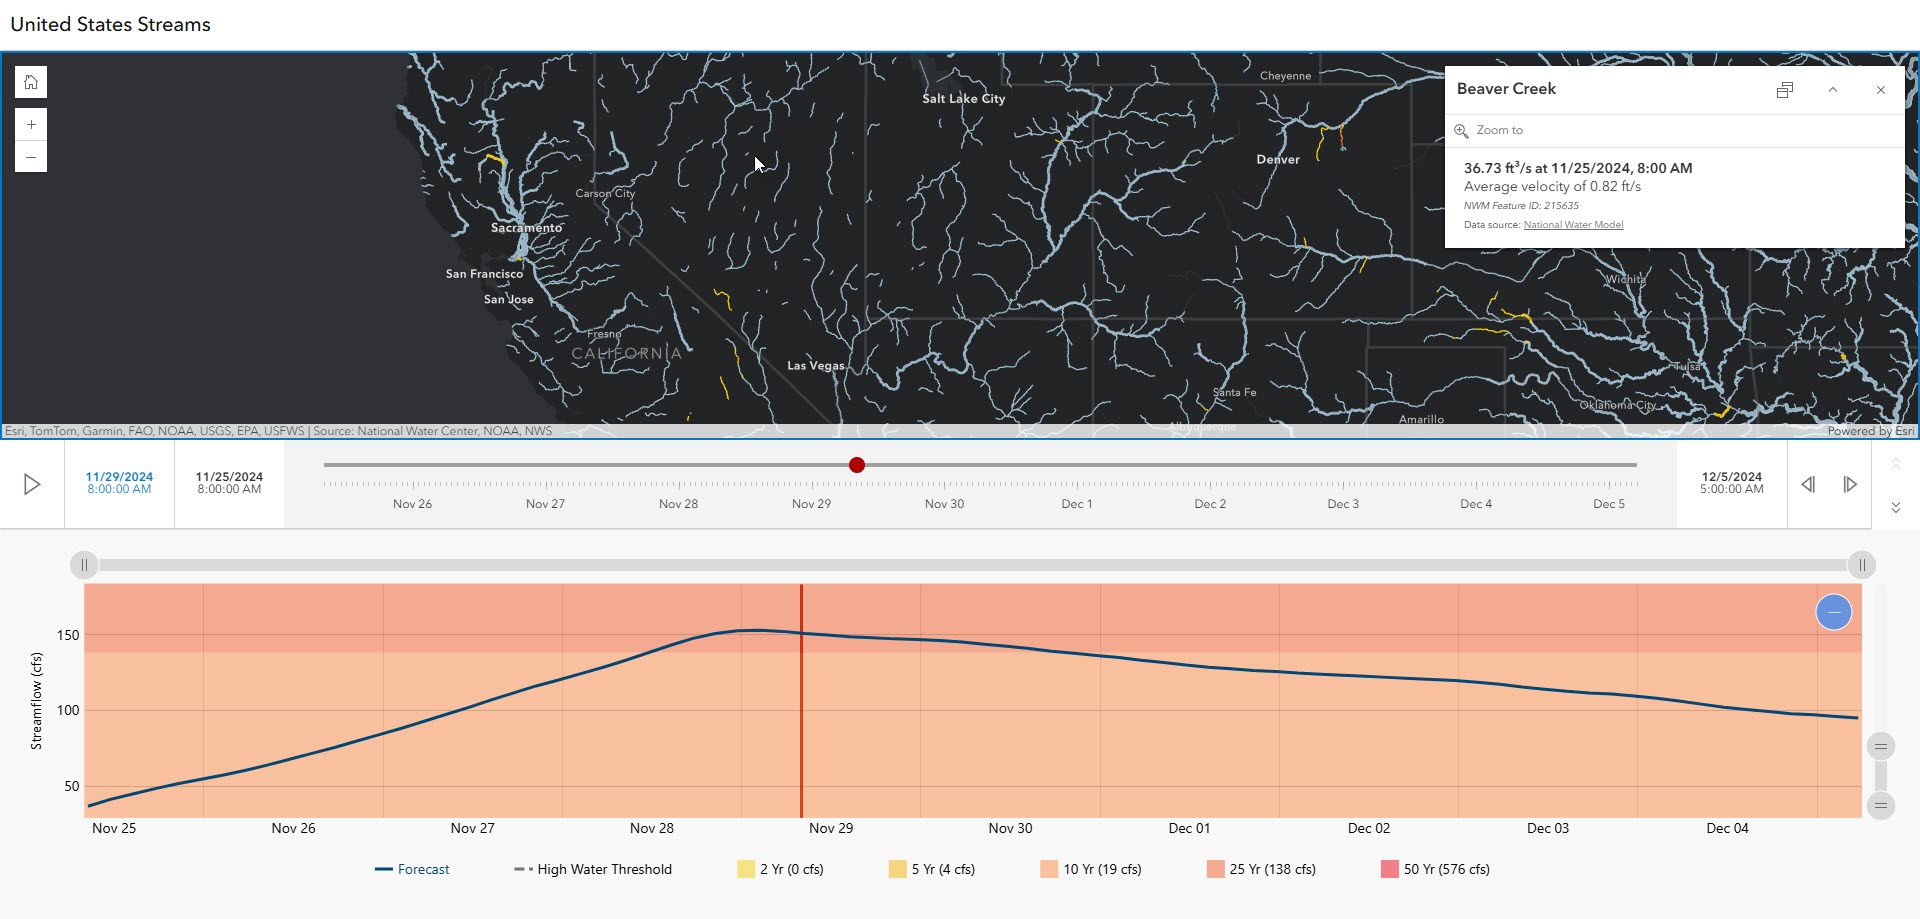
Clicking on a stream segment will generate a graph of the segment. The graph uses the same 10-day forecast at 3-hour intervals described above for the map. The mean value of the forecast is shown in blue, and a probability range is shown in grey. The range is the 25% to 75% values of the 51 ensemble members. The return period colors and values from the streamflow service are also shown as the corresponding background color of the graph.
Use the time slider to animate the forecast on the map and the graph. The streamflow forecast service will update as the slider plays.
Streamflow Viewer examples
In the Streamflow Viewer situational blog there are live examples available to view. In addition, expolore an app with the US model featured by clicking on the image below.


Article Discussion: