ArcGIS Pro 3.4 has an important new tool: Assess Sensitivity to Attribute Uncertainty. This tool helps you evaluate how analysis results can change when there is uncertainty in the data.

To help us wrap our minds around these concepts, let’s consider a map of poverty in the Los Angeles region.

The poverty data from the U.S. Census Bureau is hosted in the Living Atlas. It and hundreds of similar layers are important data sources for spatial workflows. Let’s focus on Hot Spot Analysis as an example.

The Census Bureau provides an estimate of the poverty in each census tract. It is an estimate because the data are collected using a survey, meaning they don’t ask everyone in the census tract about their income. They ask a sample of the population and use those numbers to estimate the value for the entire tract. This results in some uncertainty in the estimates and is inherent in any survey, not just those conducted by the Census Bureau.
Typically, the estimates (sometimes called point estimates) provided by the Census Bureau are treated as if they are 100% accurate. When, in fact, the number could be higher or lower than the point estimate. But how much higher or lower? This is where the margin of error (MOE) comes in. The MOE measures how certain the Census Bureau is of the point estimate. It helps answer the question, “How much higher or lower is the ‘true’ value than the point estimate?” The Census Bureau (and the Living Atlas) provide a field for the MOE. Each census tract (or county or state) has a MOE. The point estimate represents the best estimate for the variable, say poverty, in each census tract, and the MOE tells us the potential range in which the true poverty level lies.

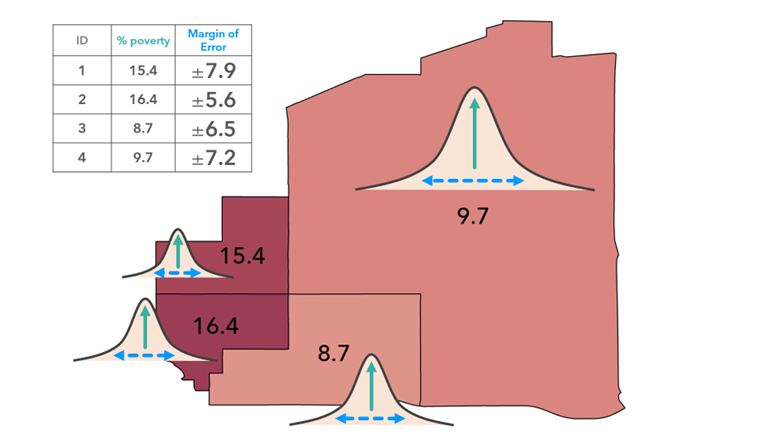
Note: A margin of error constructed at the 90% confidence level indicates that we are 90% confident the true population value lies within the range defined by adding and subtracting the margin of error from the point estimate.
Why does this matter?
Margins of error can vary greatly, and so can the analytical results!
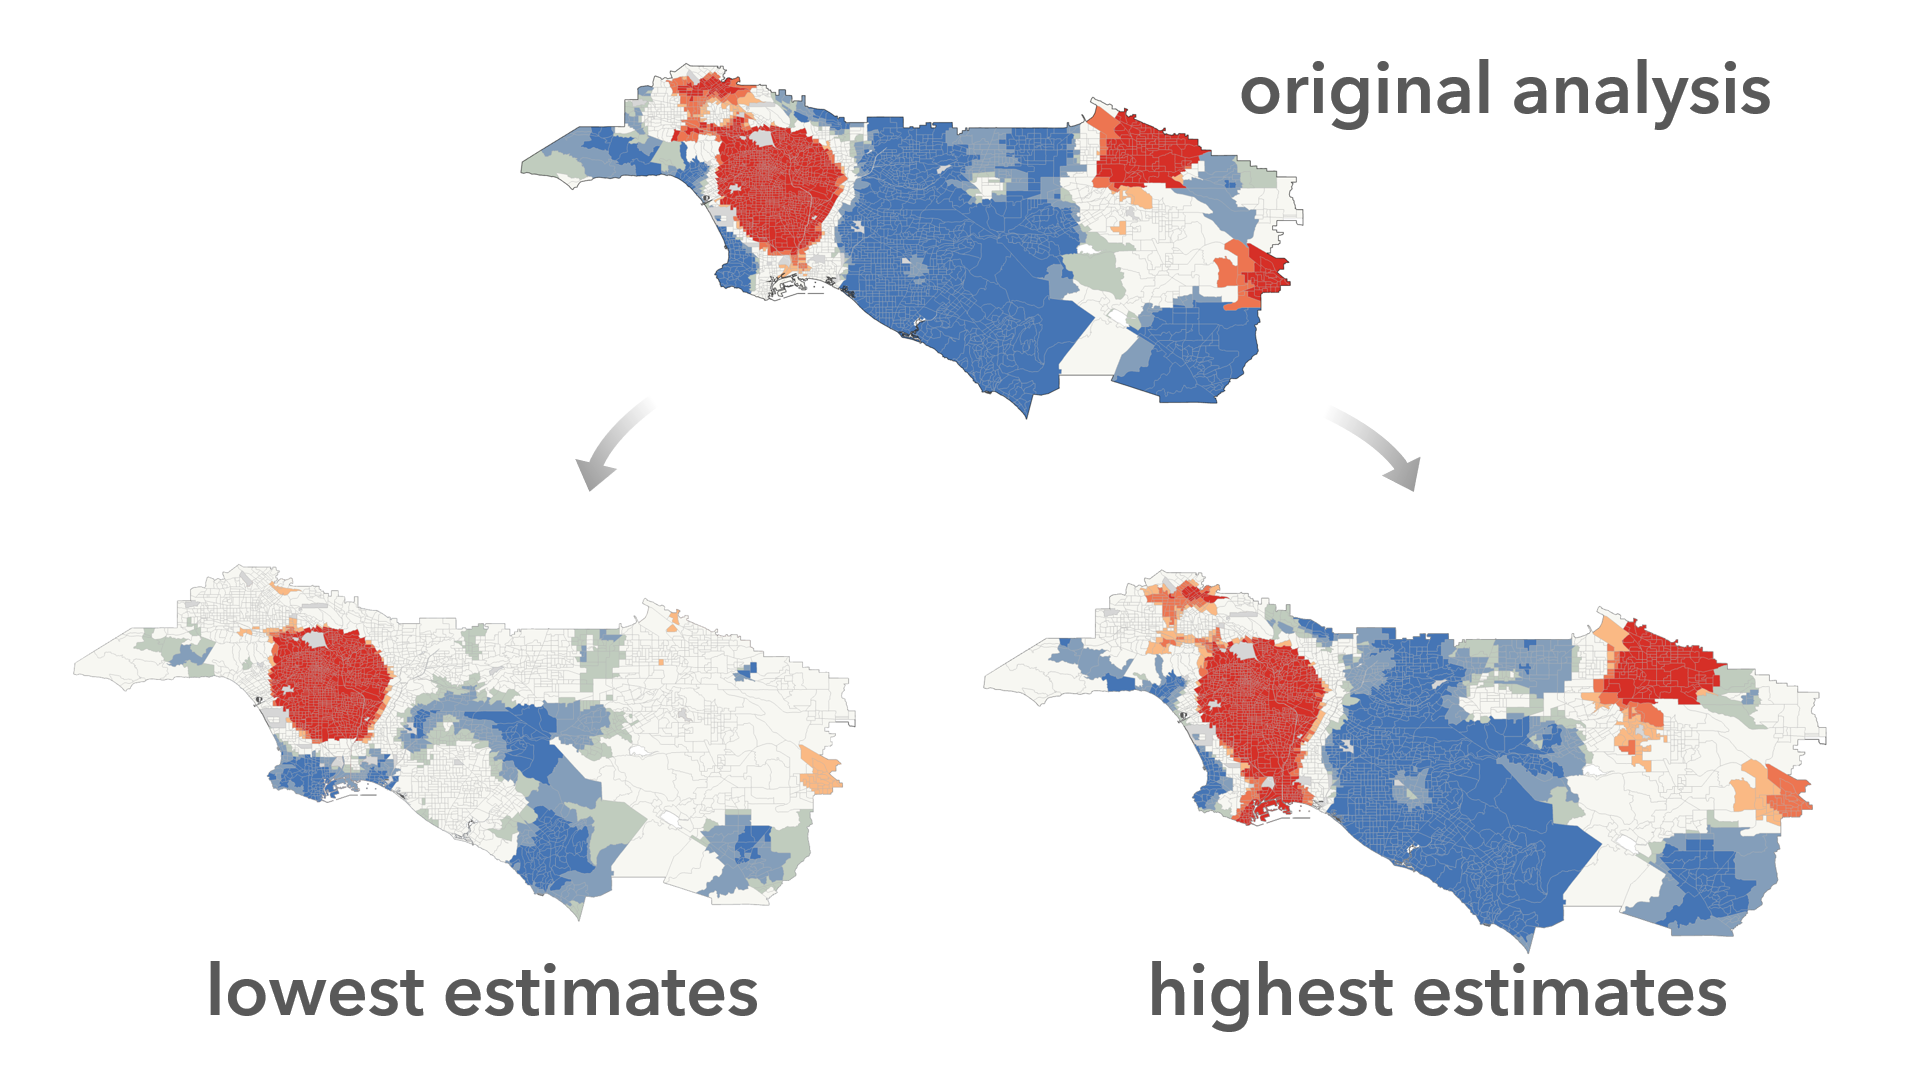
A best practice is to always report the uncertainty level of the data used in your analysis. But you can go one step further. With the new Assess Sensitivity to Attribute Uncertainty tool, you can use these uncertainty measures to see how the uncertainty impacts your analytical results. Here’s how it works:
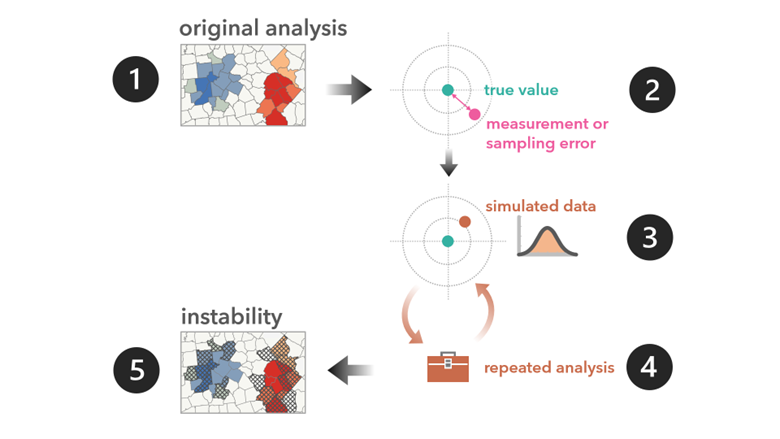
#1: You must have an analysis result, such as a hot spot analysis. This output feature class is generated when you run the Hot Spot Analysis tool (or other supported tools).
#2: You also need a way to represent attribute uncertainty. The margin of error is a common way to do this, but other data providers represent the uncertainty with an upper and lower bound or as a percentage above and below the point estimate.
#3: The tool then creates simulated versions of your data (increasing the values sometimes and decreasing them other times.)
#4: The tool repeats the original analysis with the simulated data.
#5: After several repetitions, the results are collected and summarized. Any location that differs substantially from the original analysis is deemed “unstable.”
The Assess Sensitivity tool summarizes the stability of the analysis across all of the simulated datasets as a hatched layer atop the original analysis result. Here’s an example:
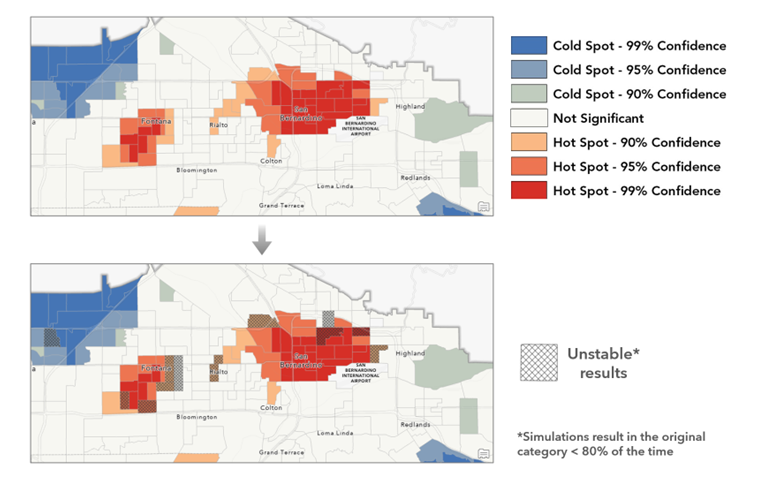
You can also click a location to see the categories that resulted across simulations. This is most helpful when evaluating the results for an unstable location:
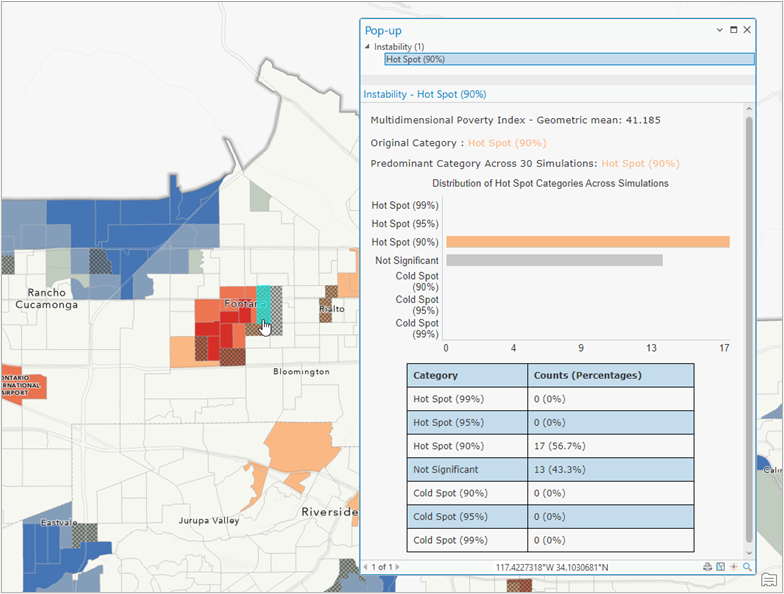
In this example, the hot spot location clicked resulted in a “Not Significant” result in 43% of the simulations.
As GIS professionals, our work is impactful; critical decisions are made with the maps we create. For this reason, we need to be transparent about any uncertainty in the analysis and move “from aversion [to uncertainty] to acceptance to integration” (Wechsler & Li, 2019). The Assess Sensitivity to Attribute Uncertainty tool is the first of a family of tools dedicated to evaluating, understanding, and communicating the sensitivity of our analyses to various forms of uncertainty.
Wechsler, S. P., Ban, H., & Li, L. (2019). The pervasive challenge of error and uncertainty in geospatial data. Geospatial challenges in the 21st Century, 315-332.

Article Discussion: