In defense and intelligence, swift and accurate data interpretation is vital. Effective data management turns raw information into actionable intelligence, which is crucial for high-stakes decisions. This blog explores how to automate analytics workflows in real-time for more informed and timely actions in critical missions.
In case you missed it, check out Part 1 of this blog for a deep dive into how to leverage data management with ArcGIS Web Apps in intelligence workflows.
Maintain situational awareness with real-time data
This process of automated data ingestion can be applied to data feeds from a variety of sources and sensors, including real-time datasets. Analysts can be alerted of events as they happen, supporting more immediate and informed action by decision-makers.
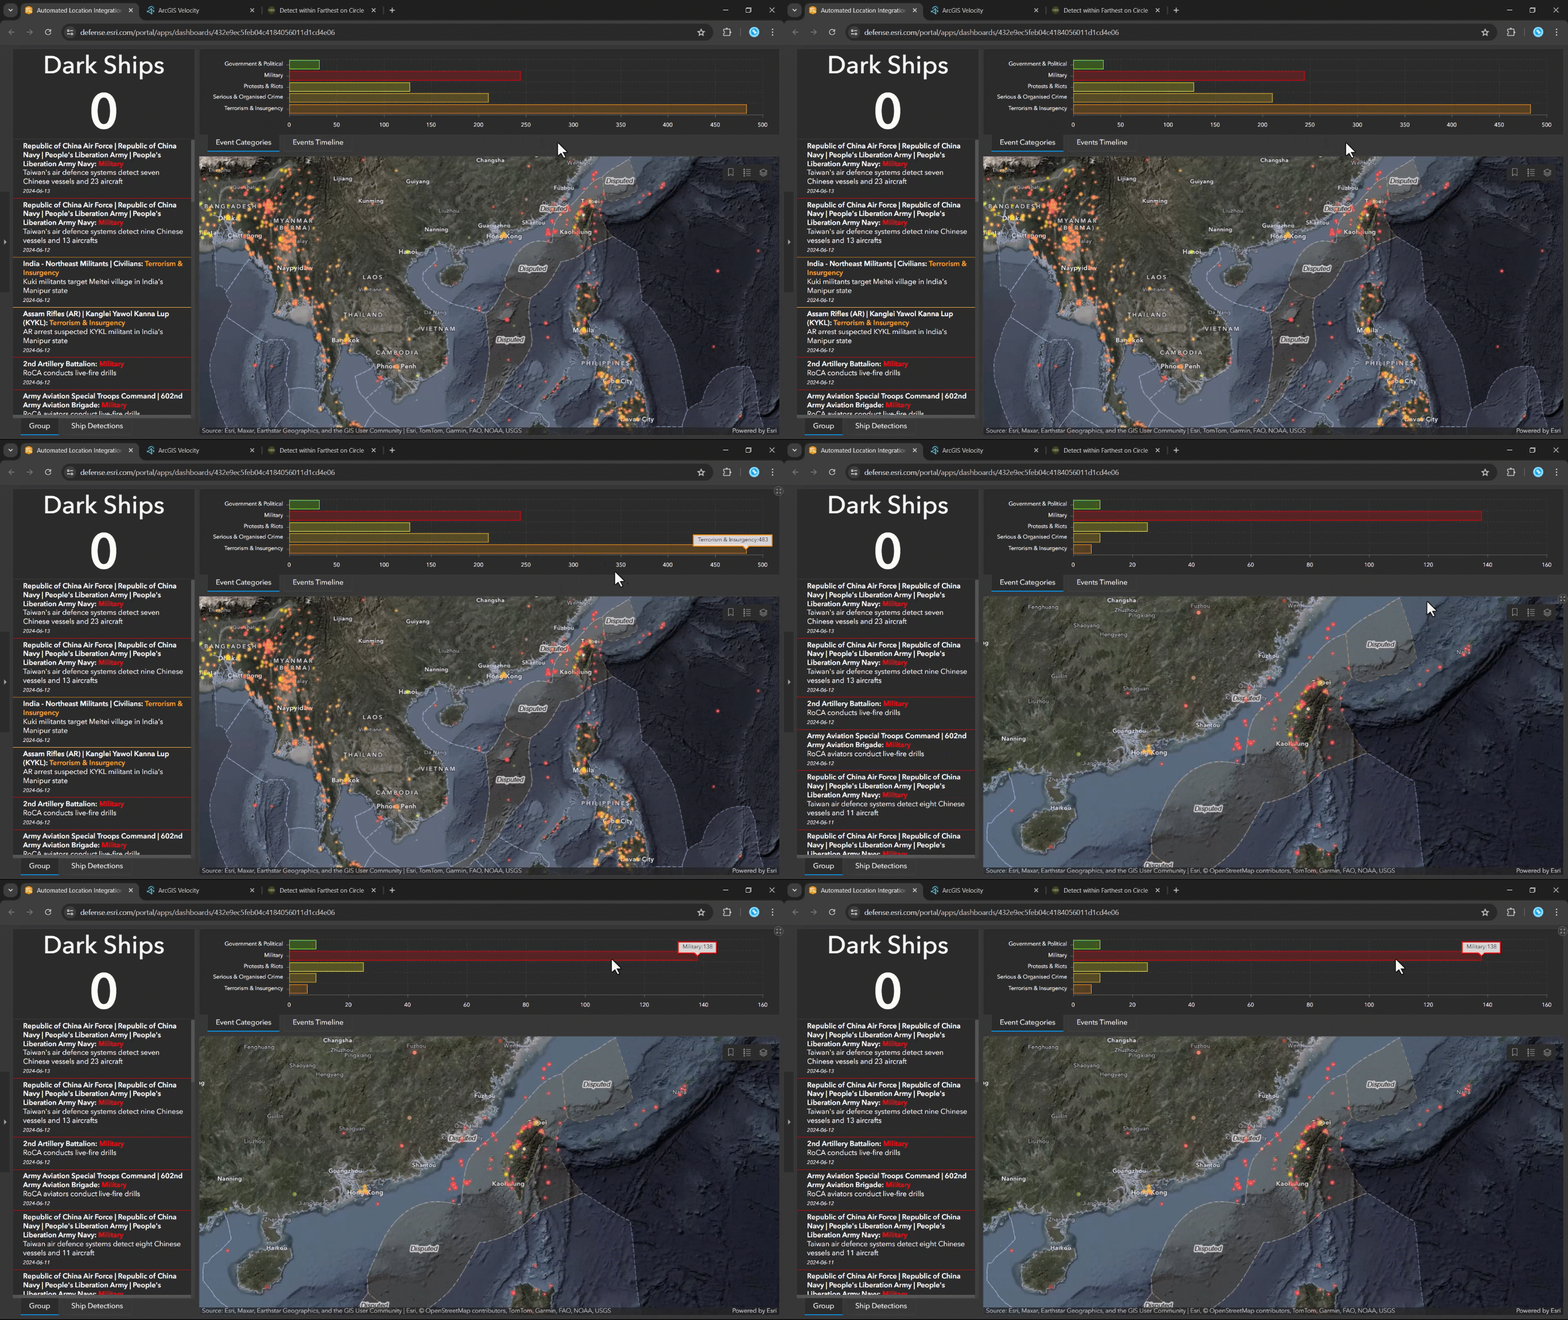
Using authoritative datasets that have been conditioned and made available throughout our ArcGIS Organization, we built a dashboard and configured it to monitor the tense maritime situation in the South China Sea.
Focusing on our primary area of interest, the Janes Global Event data displayed in the dashboard elements reveals that military tensions between China and Taiwan dominate this subregion. The majority of significant events occur in the Taiwan Strait, a highly contested area marked by disputed territories on our map. Given the close physical proximity of these feuding governments, it is imperative to maintain persistent awarenessof maritime activities in the area, particularly for suspicious shipping movements.
Automate filtering for focused analysis
ArcGIS enables seamless integration with external systems and data sources, such as Spire’s real-time Automatic Identification System (AIS) ship tracking API, which allows us to monitor global maritime activity, apply real-time analytics, and filter data relevant to our mission.
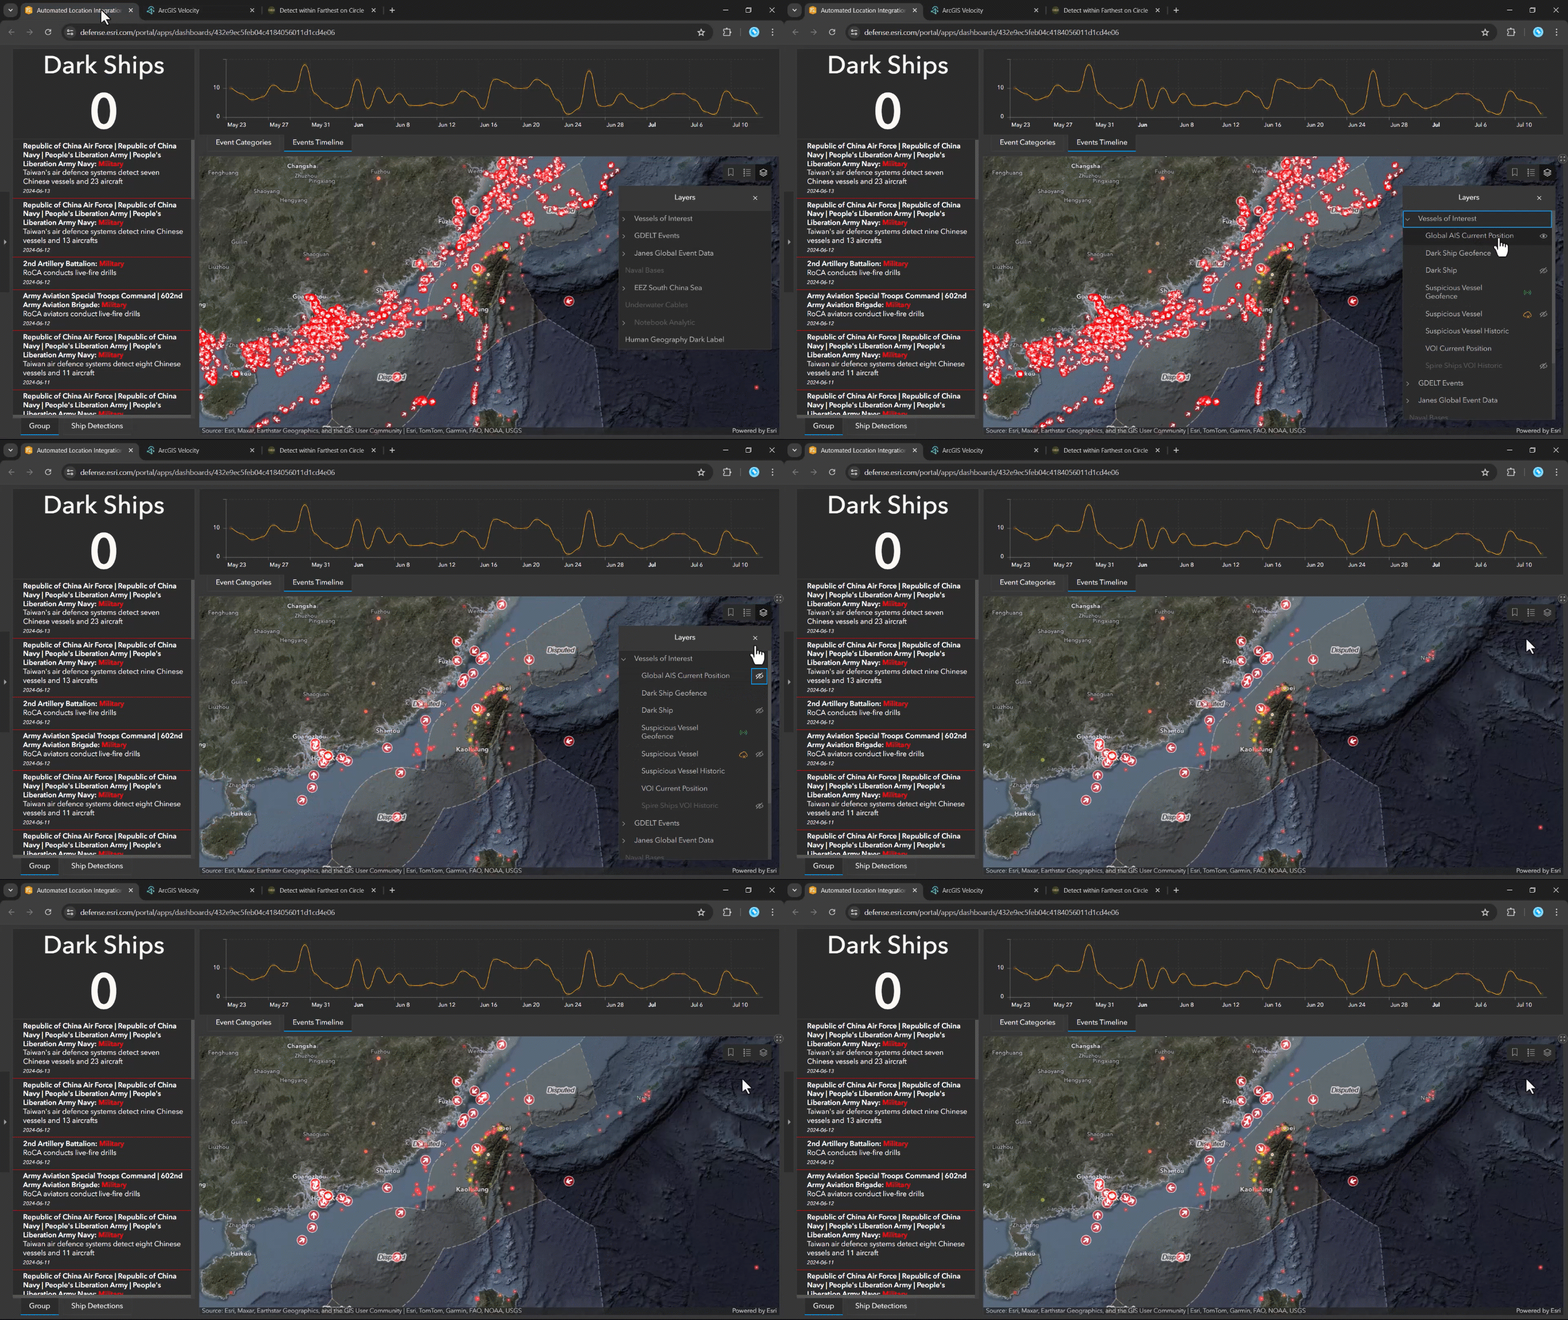
Connecting to Spire’s maritime API with ArcGIS Velocity, we used filters to focus on vessels that have been associated with illicit activities, such as fishing vessels potentially linked to China’s Dark Fleet. This targeted approach declutters our operating picture, allowing us to concentrate analytic efforts on the most pertinent information.
On our dashboard, we visualized this real-time shipping data filtered to display only vessels of interest. This streamlined view allows users to quickly assess the maritime landscape and respond to emerging threats.
Inform response workflows with alert-based analytics
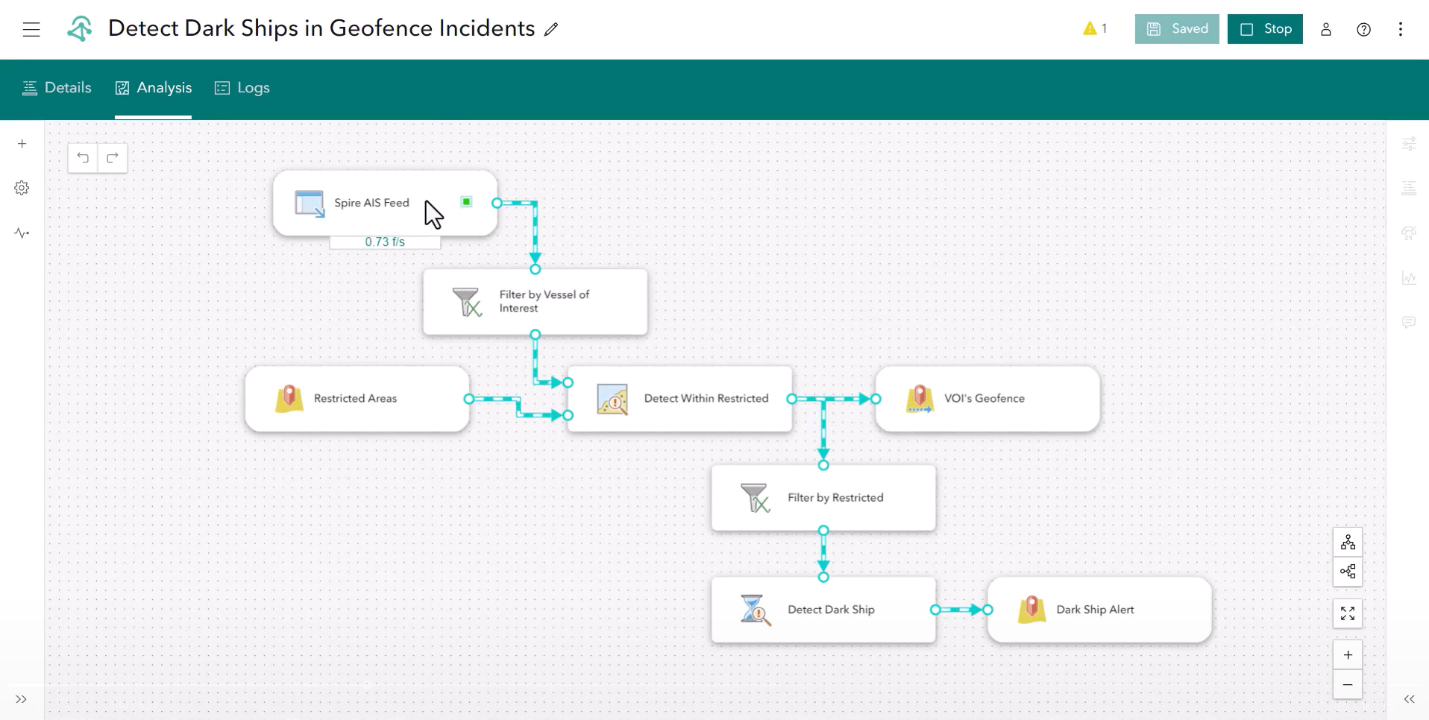
To enhance our monitoring capabilities, we configured a real-time analytic in ArcGIS Velocity that sends an alert to notify analysts when a Chinese-flagged vessel enters restricted waters and, crucially, when it stops transmitting its location. Because AIS is a safety-of-life-at-sea (SOLAS) signal, a vessel going dark can be an indicator of potential illicit activity.
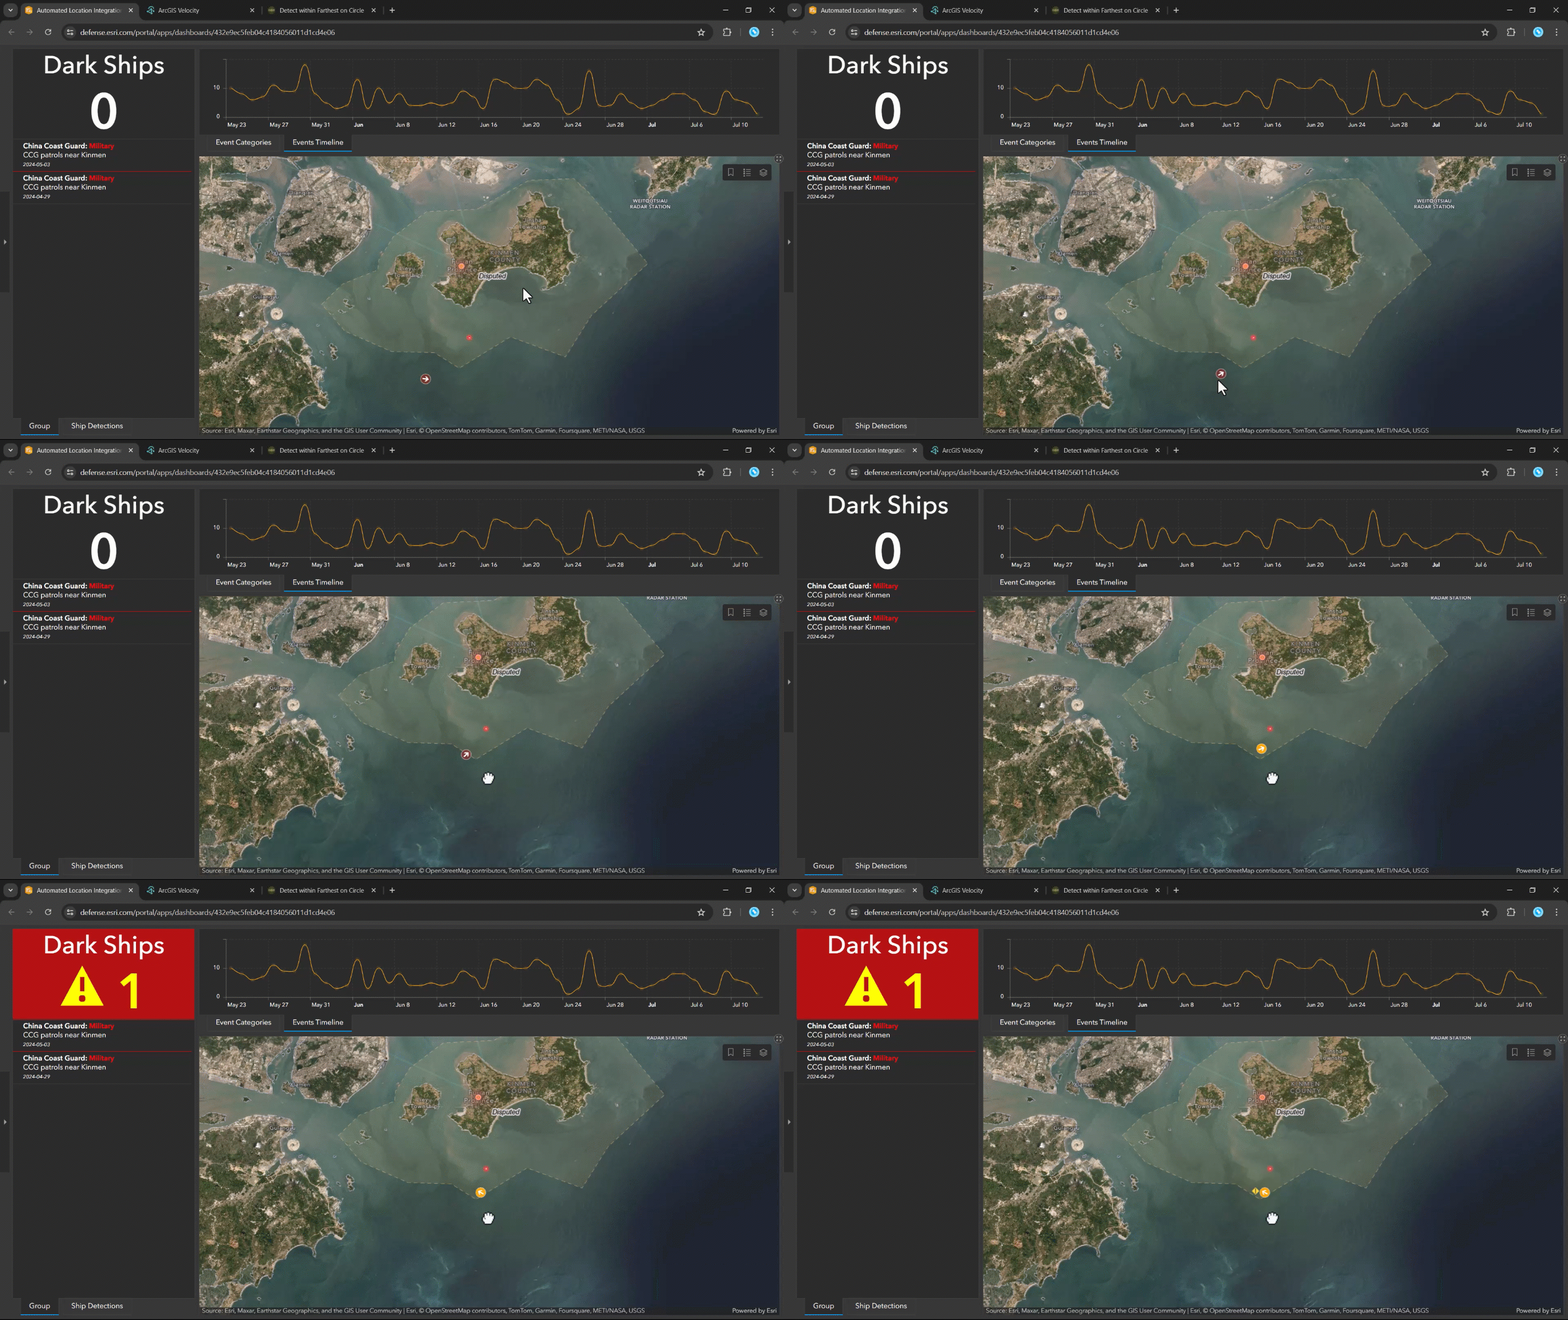
We can see the analytic in action around Kinmen County, a series of islands off the coast of China that are owned and operated by Taiwan. Here, a simulated vessel meeting our criteria moves eastward toward a disputed area. As the vessel approaches the restricted zone, its status changes, triggering an alert via the ArcGIS Velocity analytic. Upon entering the restricted area, the vessel slows down and eventually stops transmitting its location. This event activates a visual notification on our dashboard, indicating that the vessel has gone dark.
Streamline intelligence workflows with human-machine teaming
Traditionally, responding to such alerts would involve a complex series of workflows requiring significant time and coordination among multiple analysts. For instance, an analyst might need to conduct a Farthest on Circle analysis to predict the vessel’s potential movement patterns, search through an image catalog for recent imagery, and analyze that imagery to identify the vessel.
We’ve automated the entire response process using various elements of the ArcGIS system. When the vessel goes dark, it triggers a webhook that initiates a Notebook to take the last known location, perform a Farthest on Circle analysis, retrieve the most recent Synthetic Aperture Radar (SAR) imagery, and detect ships within that imagery.
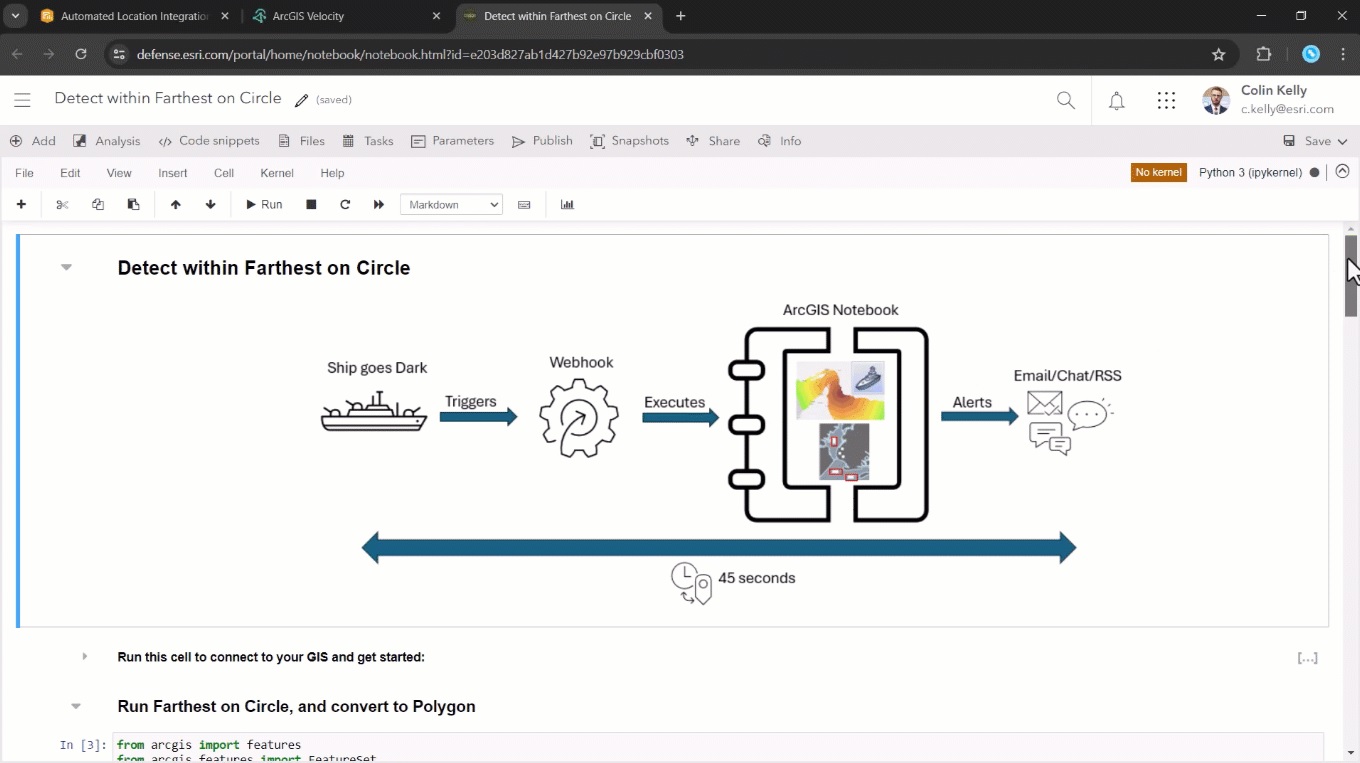
The resulting details are compiled and sent via email to decision-makers and imagery analysts, including a link to ready-to-verify results. Analysts can then focus on validating the results in ArcGIS Excalibur, streamlining the process from receiving an alert to confirming vessel locations.
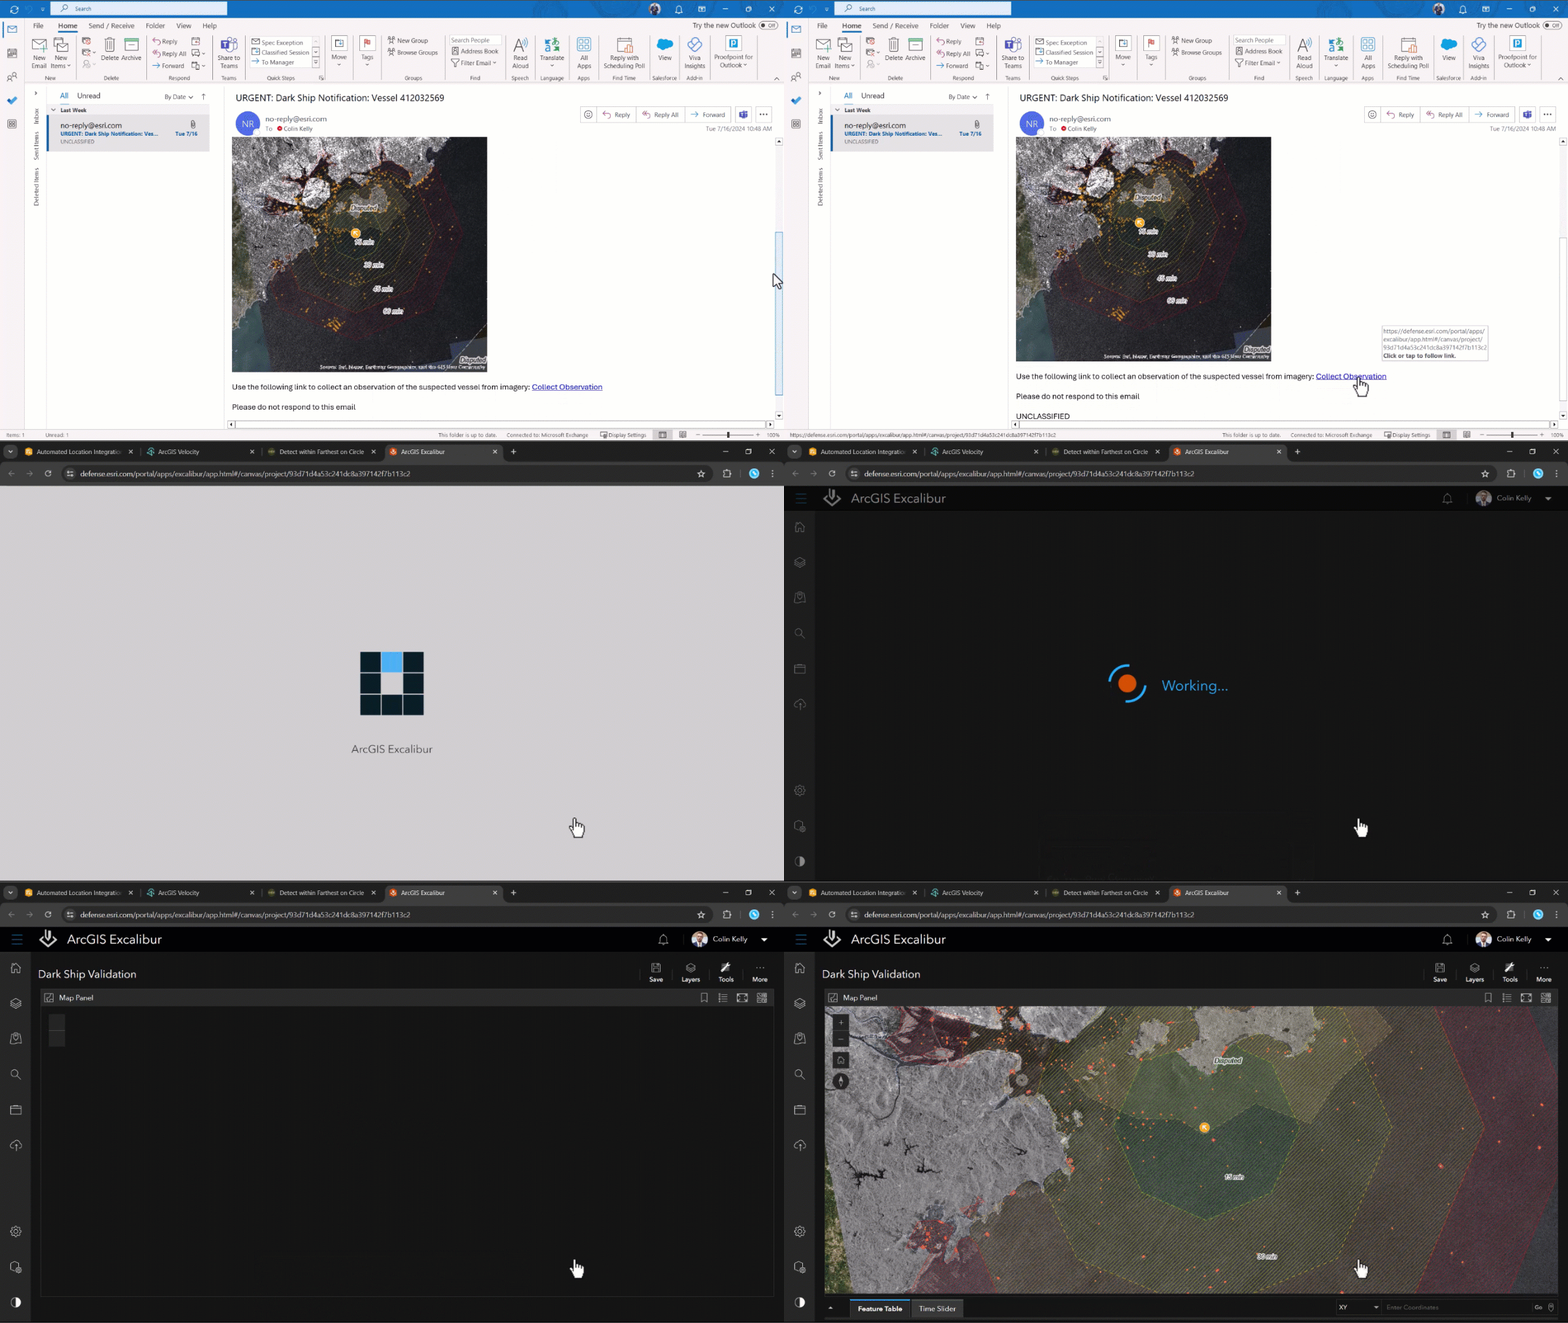
While this doesn’t yet confirm that these detected vessels are definitively our dark ship, our dashboard updates automatically to reflect the verification status of results, minimizing the latency of information being pushed back to decision makers and providing an up-to-date picture of the situation.
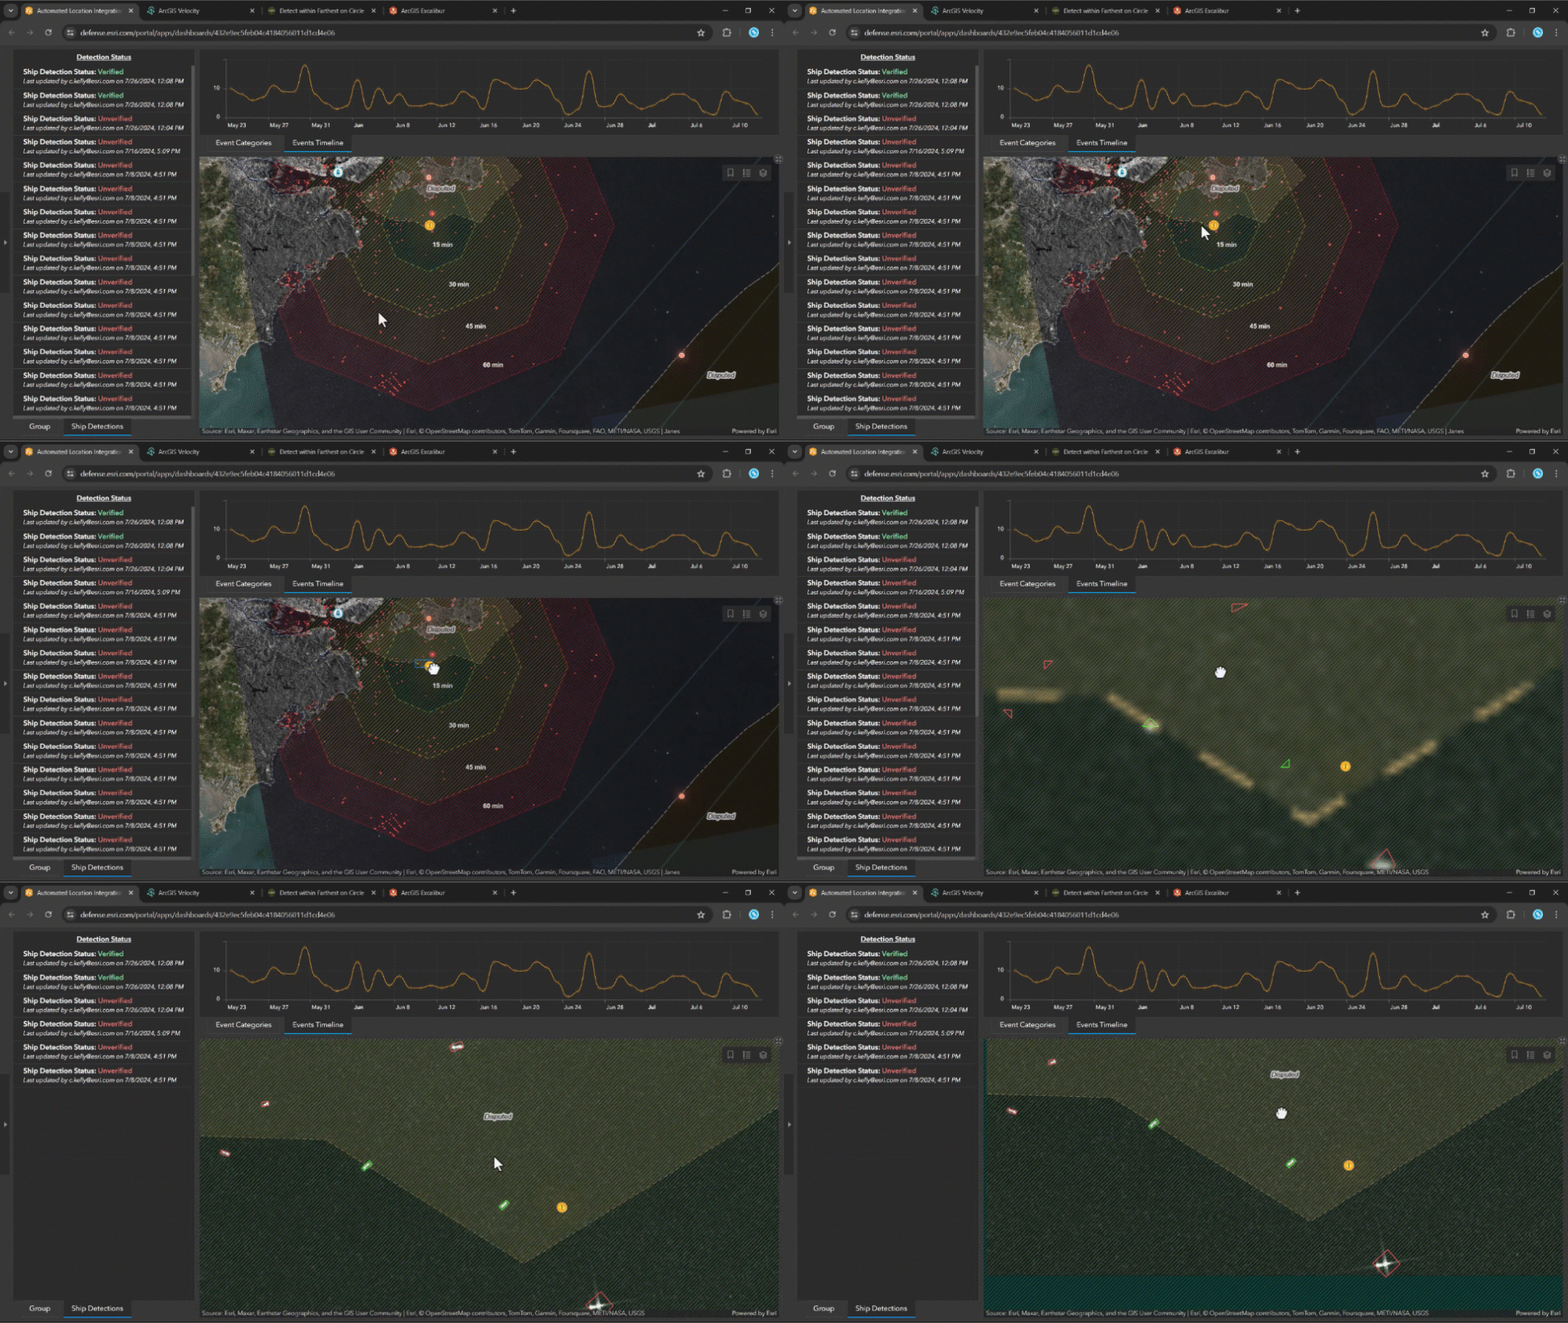
This integration of automation and real-time analytics significantly reduces the cognitive load on analysts while ensuring that they can track objects of interest.
Stay at the “Tip of the Spear”
The ArcGIS System allows analysts and decision-makers to operate with greater efficiency and accuracy. Simplifying data access through data management web apps, generative AI, and automated data integration enhances an organization’s ability to handle complex datasets and make them available as analysis-ready information. Employing real-time analytics, human-machine teaming, and automated workflows drives heightened situational awareness and more effective responses to emerging threats. Leveraging these ArcGIS capabilities in defense and intelligence operations strengthens a nation’s ability to respond to emerging challenges by supporting informed decision-making in complex environments.
Article Discussion: