In the dynamic realm of defense and intelligence, the ability to swiftly and accurately interpret data is paramount. Effective data management enables the transformation of raw information into actionable intelligence, which is crucial for making informed decisions in high-stakes environments.
This blog explores how using data management with ArcGIS Web Apps can transform intelligence operations. Leveraging advanced tools and methodologies streamlines data access, enhances collaboration, and supports automated analysis—ultimately leading to more informed and timely actions in critical missions.
Part 1 of this blog covers data management with ArcGIS System. Be sure to check out Part 2 to learn about Automating Workflows in Real-Time.
Simplify data access and sharing
Using ArcGIS Experience Builder, we created a configured landing page where analysts tracking regional stability in the Indo-Pacific Theater can easily find the relevant data, tools, and products aligned with their mission. The landing page provides access to a regional data viewer where users can interact with different datasets in a web map.
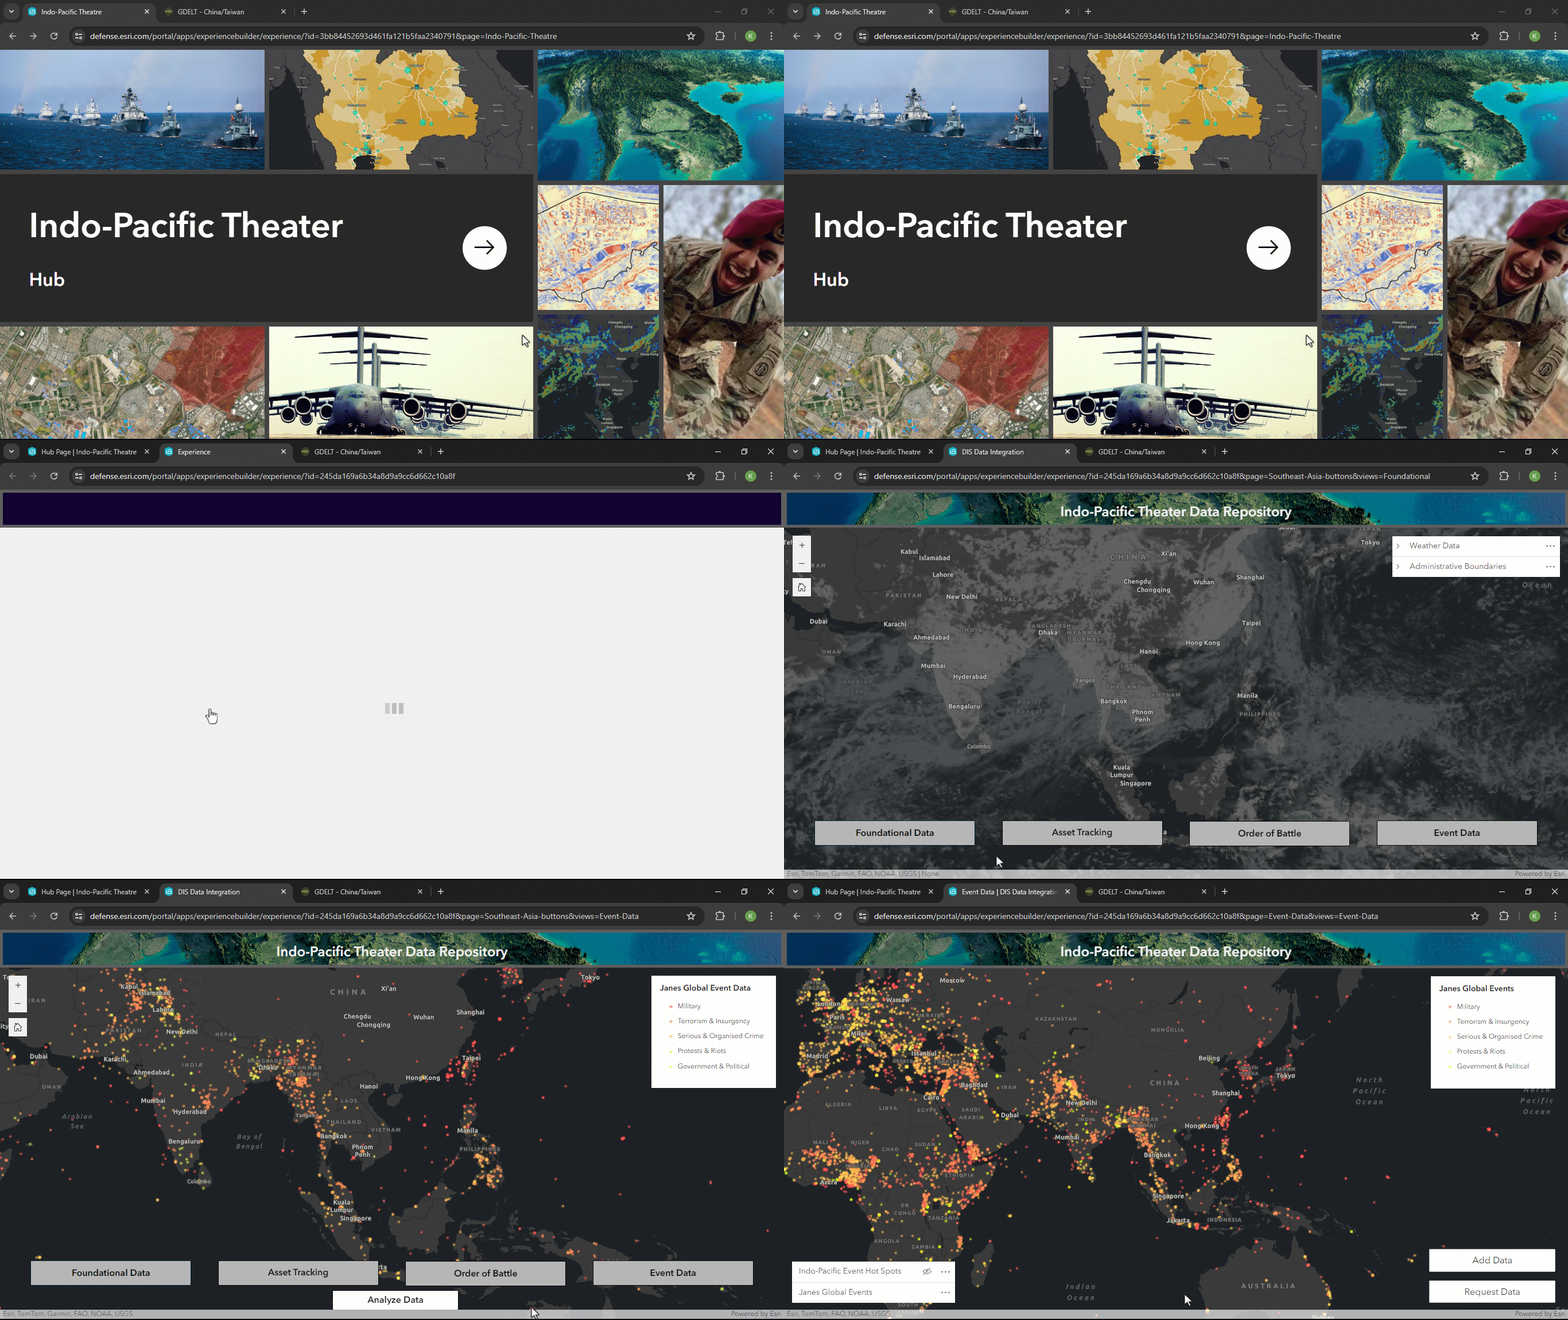
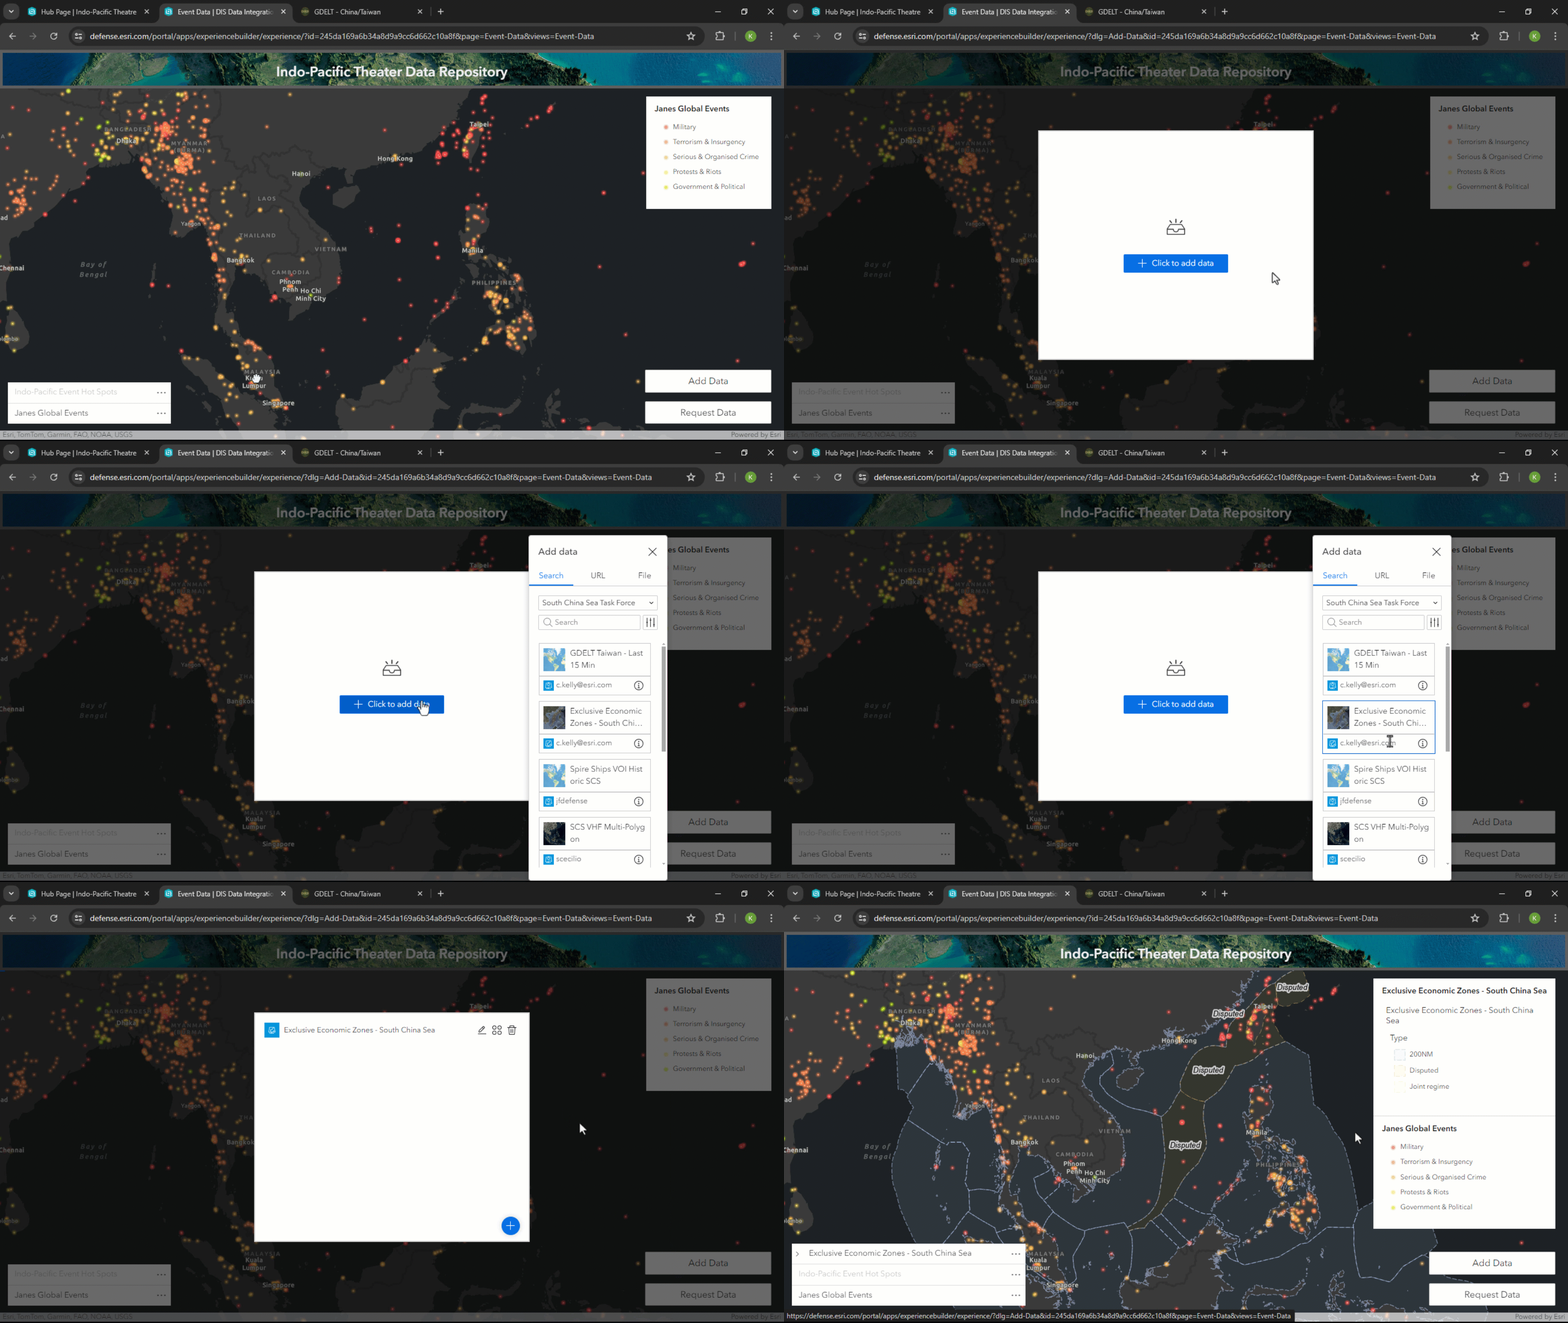
Leveraging ArcGIS as a data management system, users can explore and derive insights from categorized data within their area of interest (AOI). To understand what data our organization has access to, the Add Data widget in Experience Builder connects to collaborative groups in Portal for ArcGIS, where others focused on this AOI have published data relevant to Indo-Pacific missions. Through the widget, users can pull different types of spatial information into the data viewer to build out their understanding of the operating environment, beginning the process of creating actionable intelligence.
Construct a survey with Generative AI
As we move into more analytical workflows, sometimes we need to request additional data to fill gaps in information.
We chose to enable team members to request missing data by creating a survey using Survey123 and its new generative AI capabilities. By inputting specifications for the information we wanted to capture, the AI, using large language models, provided a draft survey in seconds.
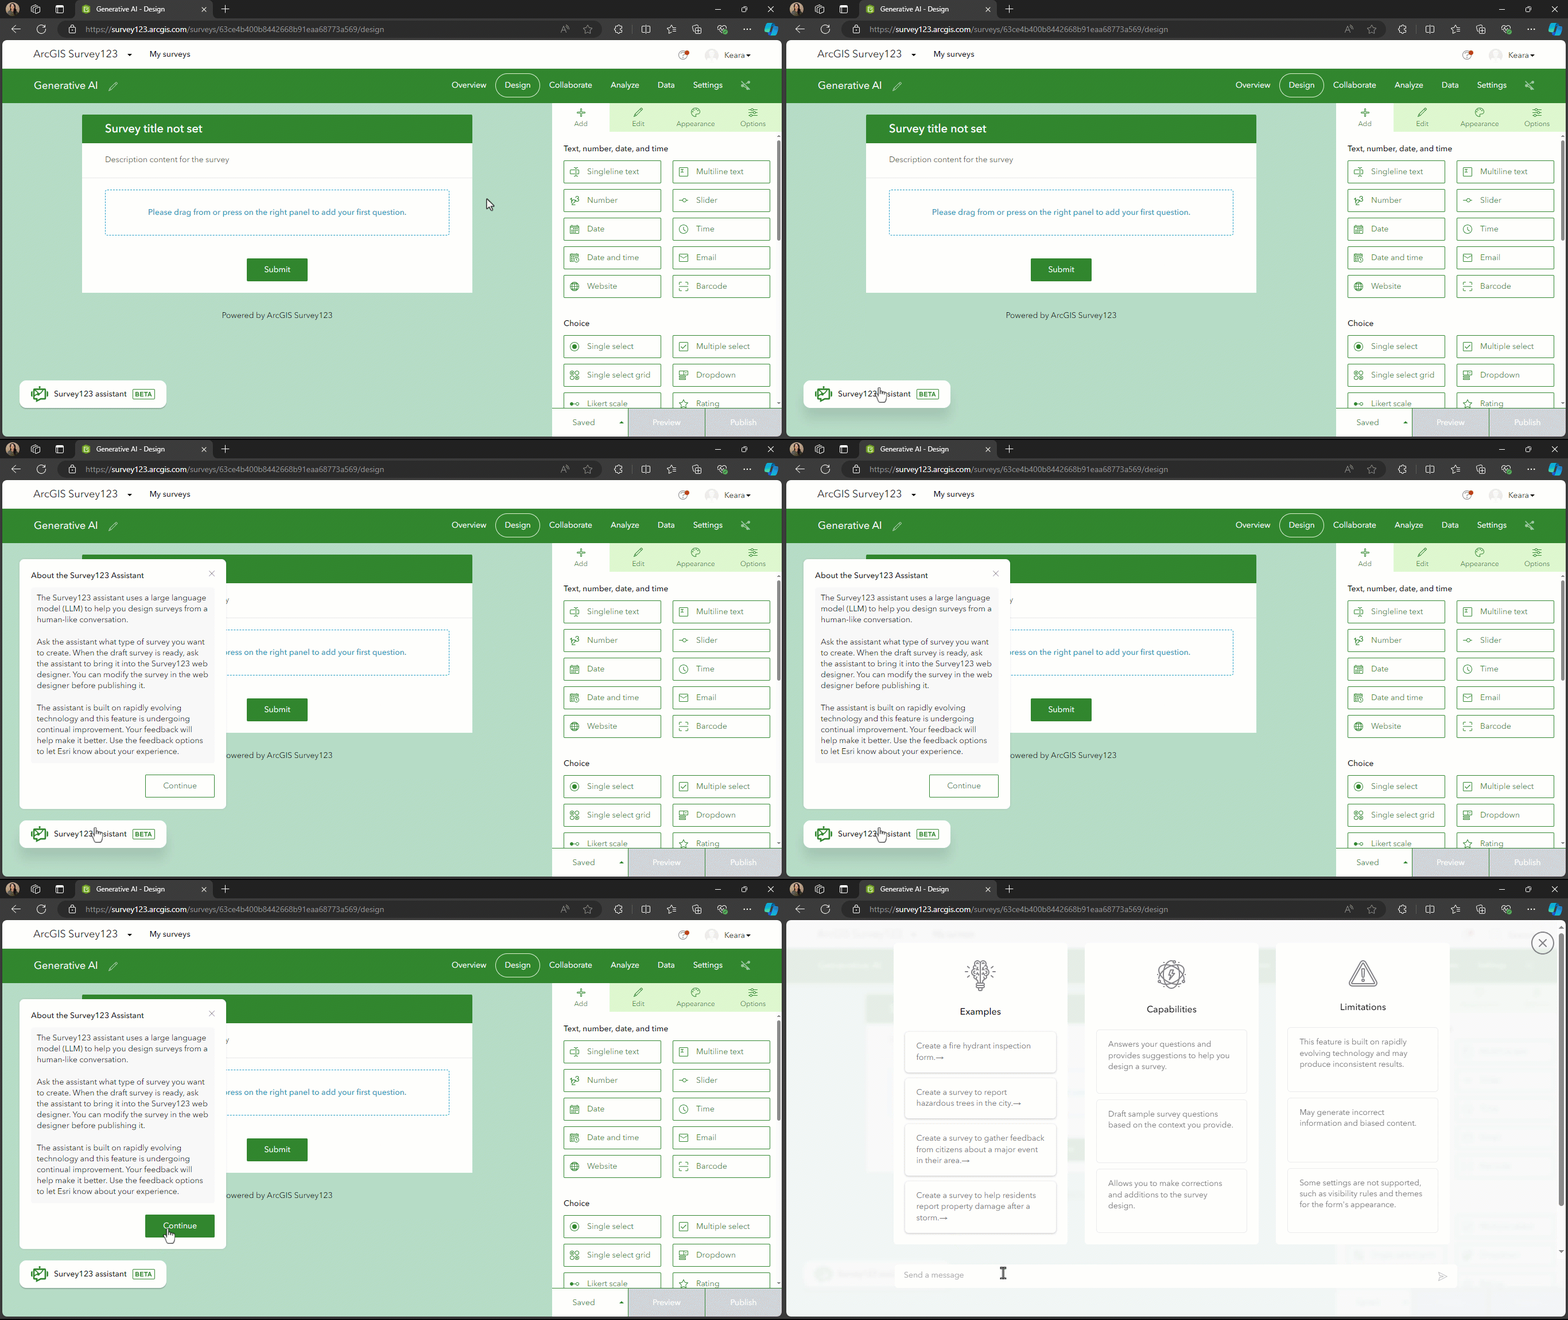
We asked Survey123 to create a survey that allows respondents to:
- Describe data they are looking for
- Define potential sources of that information
- Identify an area of interest on a map
- Indicate the urgency of their request
After reviewing the initial draft, we prompted the AI Assistant to make some adjustments, such as marking certain questions as “required.”
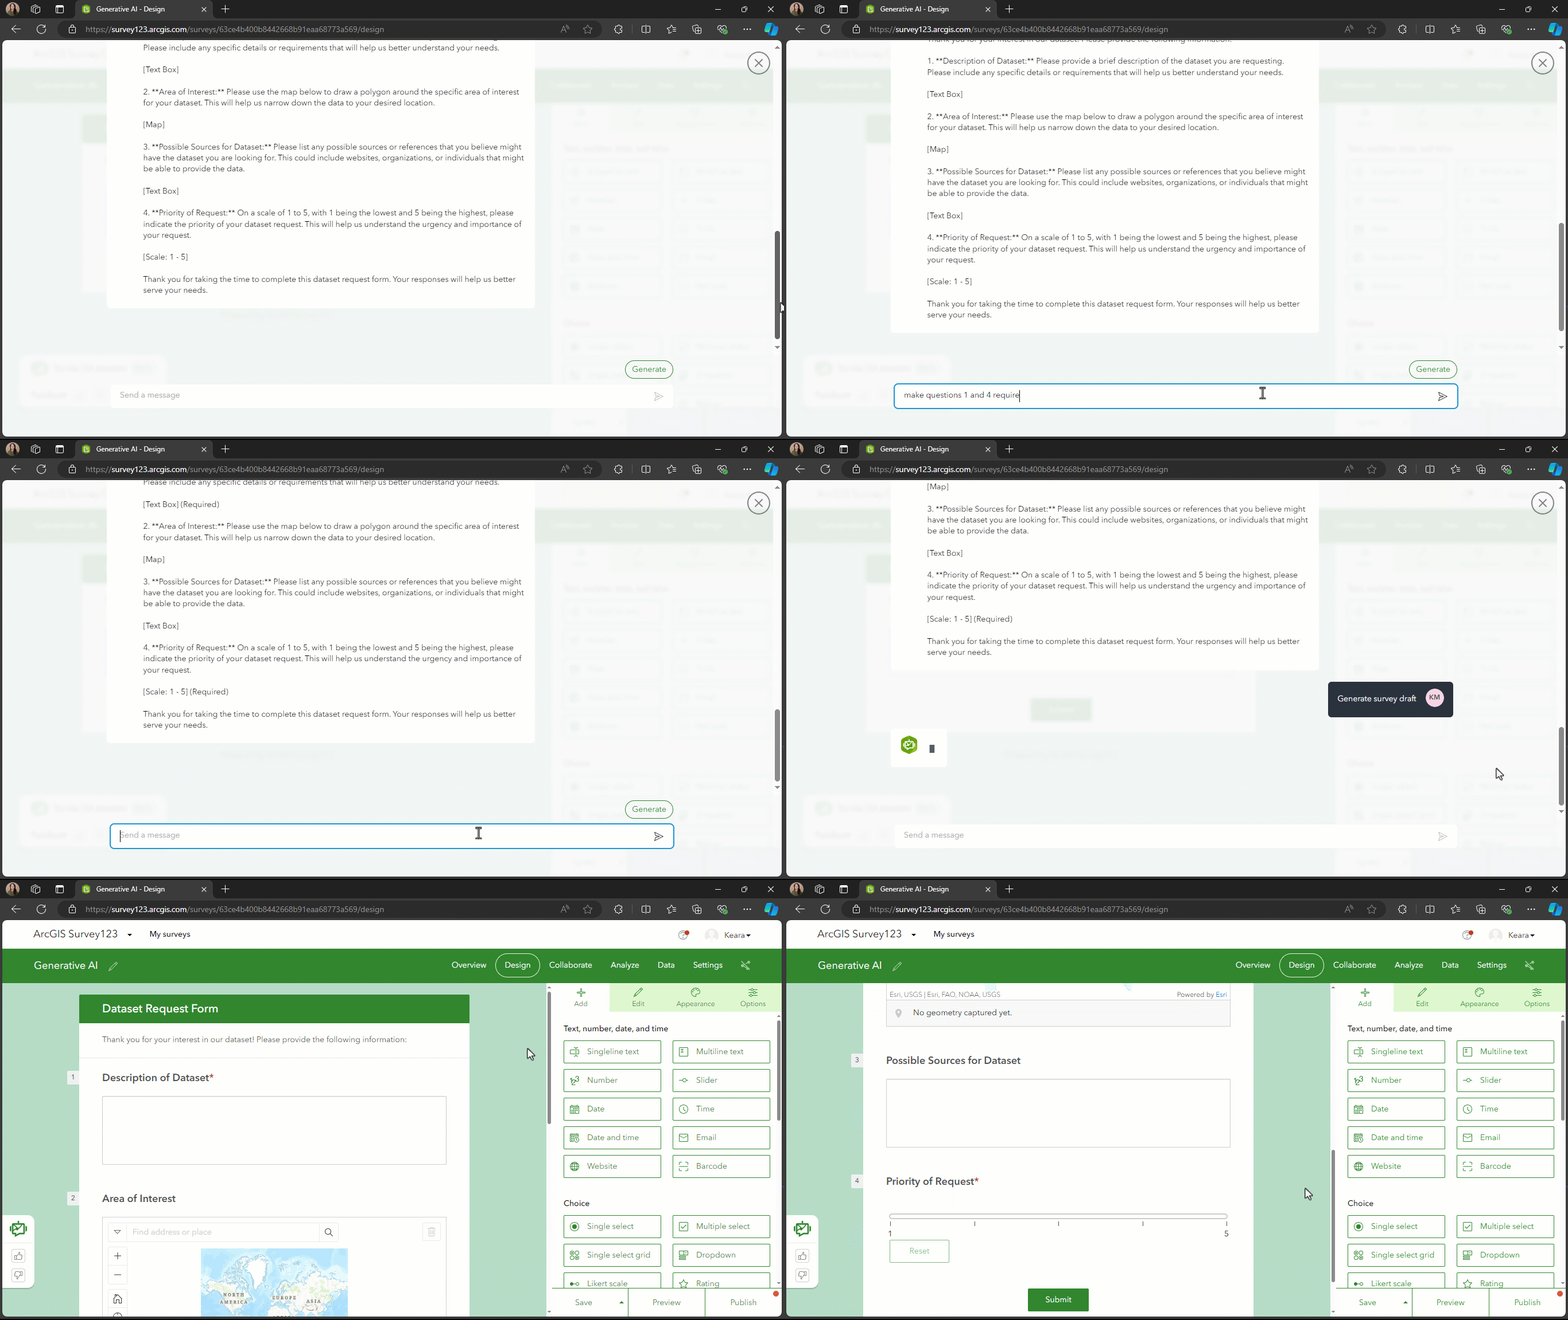
The finalized, published survey was integrated directly into our web map interface, allowing analysts on the Indo-Pacific monitoring team to submit new requests seamlessly. The submitted requests are sent to our organization’s data steward, who integrates the requested data into our shared content using group sharing capabilities in ArcGIS.
Integrate external data sources automatically
Once gaps in data have been identified and new information requested to fill them, we can automate the task of pulling data from external souces using ArcGIS Notebooks and ArcGIS API for Python.
The open source GDELT (Global Database of Events, Language, and Tone) event data captures events by monitoring news media across a variety of platforms. We queried GDELT’s API and created a feature layer in our portal from the response. GDELT updates this data on a 15-minute interval, so we scheduled a Notebook task to run every 15 minutes, updating the associated feature layer with the most recent GDELT reporting. The feature layer is then shared to a group, making the dynamic, conditioned dataset available at a programmatic level—all automatically.
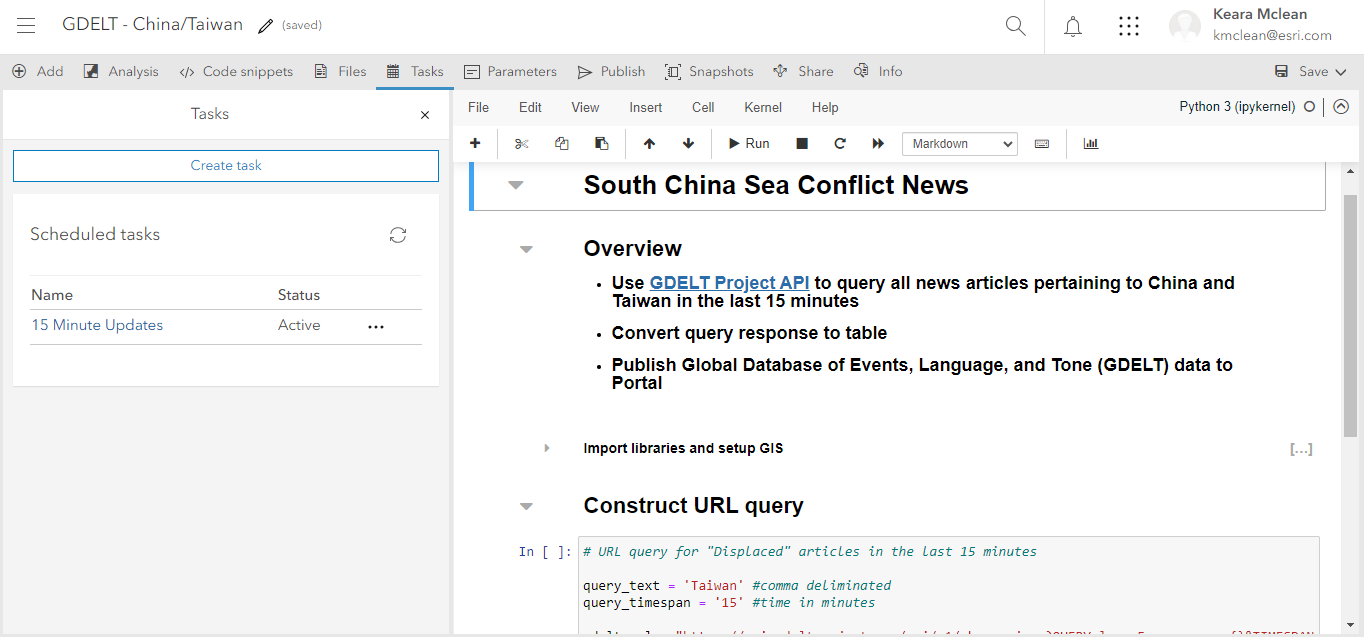
By scheduling tasks to run in Notebooks to capture updates in dynamic data feeds, we save significant analyst time while ensuring timely access to critical information.
Now that you’ve learned how to effectively use data management for automated intelligence workflows with the ArcGIS System, head over to Part 2 of this blog to learn how to automate workflows in real-time.
Article Discussion: