Understanding who your core customers are and locating others like them is critical for strategic and sustainable business growth. ArcGIS Business Analyst’s Target Marketing Wizard offers a powerful approach to analyze customer insights and assess market reach, allowing companies to identify high-potential areas and customer segments for maximum return on investment.
In this blog post, we’ll guide you through a step-by-step workflow using ArcGIS Business Analyst Pro, demonstrating how to leverage target marketing for a data-driven strategy for reaching your ideal customer segments. Using a solar panel company in California as a case study, you’ll learn how to create customer and market area profiles, identify high-value segments, and map insights to drive growth.
Workflow Overview
This workflow covers the essential steps for building a target marketing strategy in ArcGIS Business Analyst Pro. Following these steps will help you understand your current customer base, identify areas with growth potential, and make informed marketing decisions.
- Step One: Create a Customer Profile
Start by grouping your customers into segments based on shared characteristics like lifestyle, location, and spending habits. This profile will reveal which customer segments are most engaged with your product.
- Step Two: Define a Market Area and Create a Market Area Profile
Define the geographic area you want to analyze, such as a state or city, and create a market profile of this area. Comparing this profile with your customer segments highlights areas where your brand has growth potential.
- Step Three: Perform a Four Quadrant Analysis
Use the Four Quadrant Analysis to categorize your customers into Core, Developmental, Niche, and Monitor segments.
- Step Four: Map the Target Groups
Map customer segments and potential growth areas to see where core and developmental groups are concentrated geographically.
- Step Five: Reporting
Generate detailed reports that summarize customer segmentation, market potential, and media habits, helping refine your marketing decisions.
Step-by-Step Target Marketing Analysis
Step One: Create a Customer Profile
A Customer Profile is an organized summary that categorizes your customer base by key characteristics like location, lifestyle, and spending habits. This profile groups, or “segments,” customers with shared traits, offering valuable insights into what motivates their purchasing behaviors. By understanding these segments, you can tailor your marketing efforts more effectively. Esri’s Tapestry segmentation system provides a structured approach to this process, grouping communities across the United States into manageable segments based on demographic, socioeconomic, and lifestyle characteristics.
As the foundation of your target marketing analysis, the Customer Profile helps you see where different customer types are located, guiding your strategy to better connect with each group.
Preparing Customer Data for Target Marketing
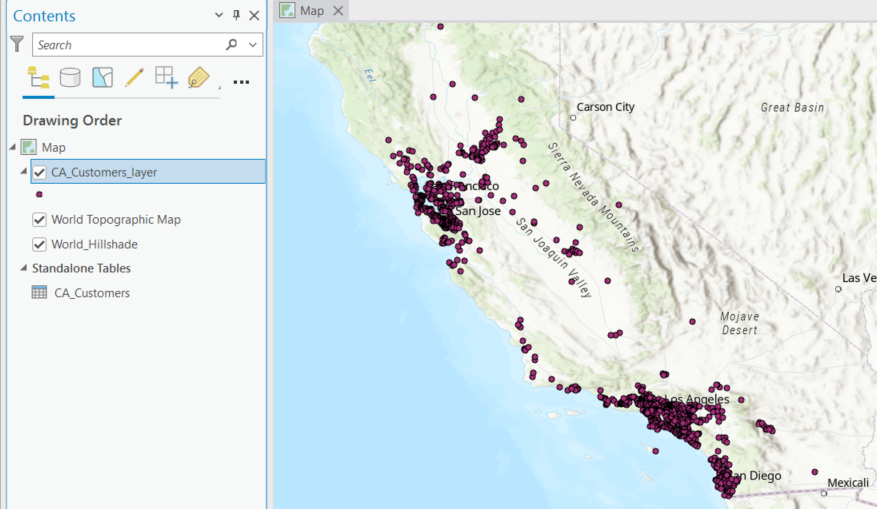
Before using your data in the Target Marketing Wizard, ensure it’s in layer format. To begin, add your customer data to ArcGIS Pro:
- Under the Map tab, click Add Data, then Browse to locate and select your customer data file (such as an Excel file).
Once your data is added, ensure it’s in layer format for use in the Target Marketing Wizard:
- Right-click the customer file in the Contents pane and select XY Table to Point.

- In the dialog box, specify a name for your new layer in the Output Feature Class field.
- Click OK to create a customer point layer, which is now ready for target marketing analysis.
Running the Target Marketing Wizard
- Open the Target Marketing Wizard
-
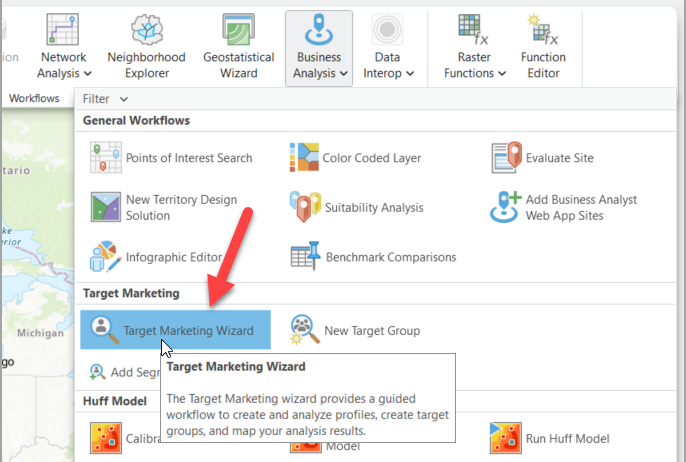
- Go to the Analysis tab in ArcGIS Business Analyst Pro.
- Click on Business Analysis and select Target Marketing Wizard from the gallery.
- Select the Customer Layer
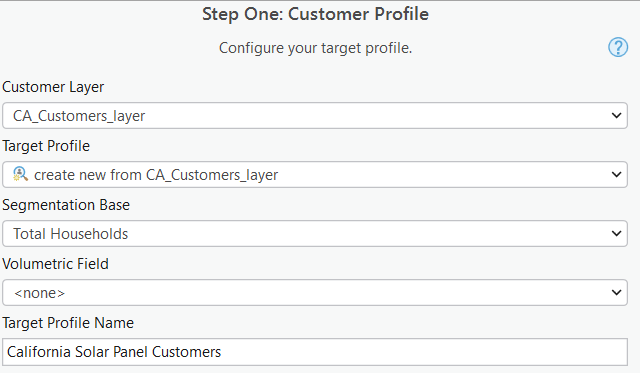
- In the Customer Layer drop-down, choose CA_Customers_layer, which contains your customer locations.
- In the Customer Layer drop-down, choose CA_Customers_layer, which contains your customer locations.
- Create a New Target Profile
- In the Target Profile drop-down, select create new from.
- Set Segmentation Base to Total Households so that it reflects your customer type.
- Name the Target Profile
- Name your profile descriptively, e.g., California Solar Panel Customers.
- Review the Customer Profile
-
- The profile is stored as an item in your project folder. To access it, open the Catalog pane, navigate to the Business Analyst folder, and then open the Target Marketing folder.
- View it by right-clicking the profile and selecting “Open” to see how your customers are distributed across Tapestry segments.
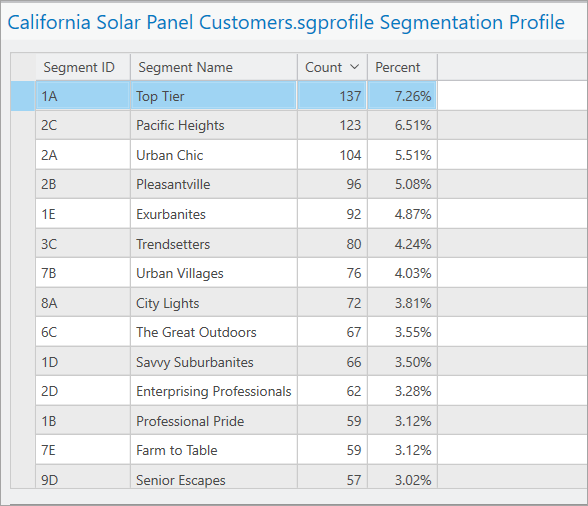
The Customer Profile helps you understand which segments are most prominent among your customer base. In this example, the Top Tier (1A) and Pacific Heights (2C) segments represent a significant portion of your customers, accounting for 7.26% and 6.51% of the total, respectively. These segments should be key focal points for your marketing efforts, as they form a substantial part of your customer demographic.
Step Two: Define Market Area and Create a Market Area Profile
In this step, you will first define your market area. Then, you will create an associated Market Area Profile. The Market Area Profile lists a count of your selected base, either total households or adults, for each Tapestry segment. Comparing the two profiles allows us to create an index that indicates whether we are reaching customers at a higher or lower rate than they exist in the area.
- Select the Market Area Layer
- Choose the California State Boundary as your Market Area Layer.
- Choose the California State Boundary as your Market Area Layer.
- Create a New Base Profile
- From the Base Profile drop-down, select Create new from California.
- From the Base Profile drop-down, select Create new from California.
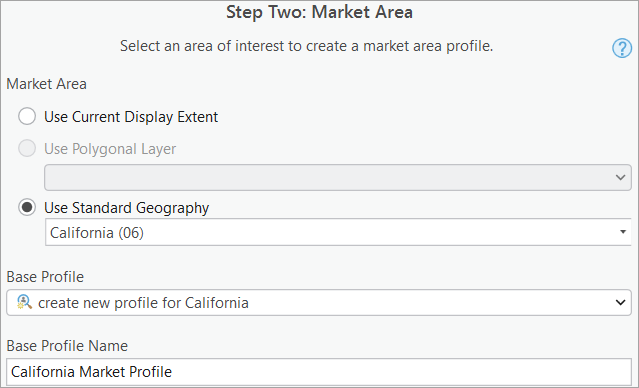
- Review the Market Area Profile
- Open the profile to see the segmentation of households in California.
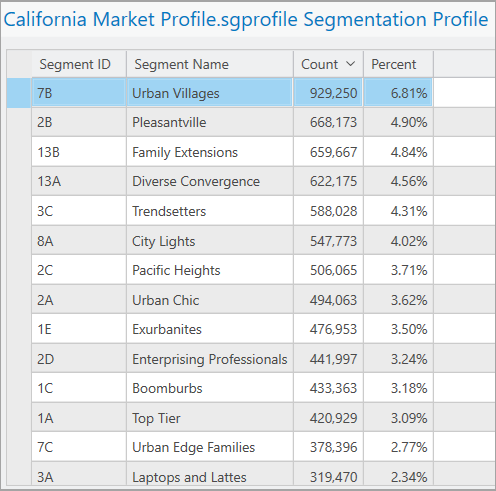
Urban Villages (7B) represents 6.81% of California’s adult population but only 4.03% of your current customer base. This gap highlights a significant opportunity for targeted marketing efforts to engage this underrepresented segment. By tailoring messaging and outreach strategies to the preferences and needs of the Urban Villages segment, you can strengthen your market penetration and better align with California’s broader demographic landscape.
Step Three: Perform a Four Quadrant Analysis
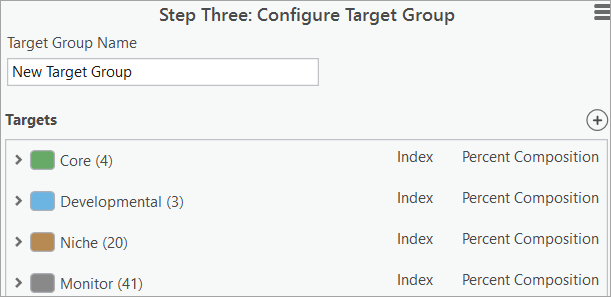
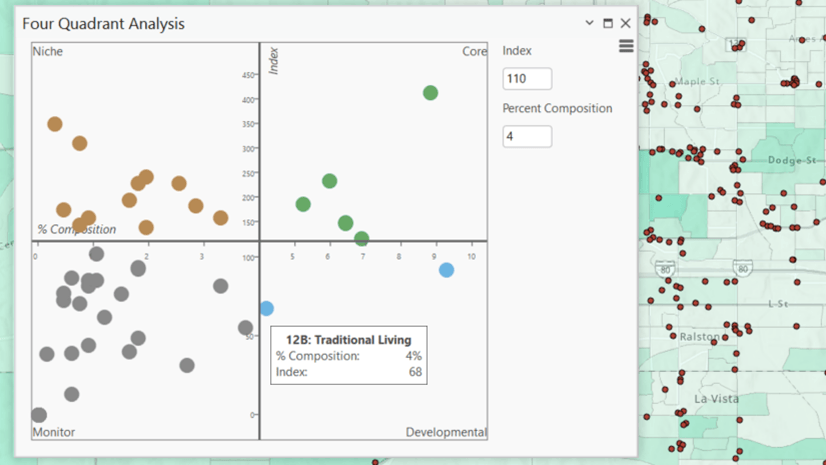
The Four Quadrant Analysis classifies your customers into four groups—Core, Developmental, Niche, and Monitor—based on their performance relative to the broader market. This classification uses an index value, where 100 represents the average, to compare the percent composition of your customers in each segment to the overall market area’s composition. The analysis identified 4 Core segments that are central to the market, 3 Developmental segments with potential for growth, 20 Niche segments that serve specialized needs, and 41 Monitor segments to keep an eye on for any shifts in performance. Counts in parentheses indicate the number of targets in each category.
-
- Core (4 segments): These segments represent your most loyal and engaged customers, characterized by high indexes and significant composition within your customer base. For example, Top Tier (1A) makes up 7% of your customer base with an Index of 235, meaning this segment engages with your product over twice as much as the general market. Core segments form the foundation of your customer base and are critical to maintaining and growing your market presence.

Our Core customers come from segments 1A (Top Tier), 1E (Exurbanites), 2A (Urban Chic), and 2C (Pacific Heights), collectively representing a strong interest in solar energy. With indices ranging from 139 to 235 and a composition of 5–7%, these environmentally-conscious groups align perfectly with our mission to deliver sustainable energy solutions.

- Developmental (3 segments): These groups represent a promising portion of your customer base, with slightly lower-than-average engagement compared to the broader market. For instance, the Urban Villages (7B) segment has an index of 59 but accounts for 4% of your customers. This indicates significant potential for growth, as targeted marketing strategies could enhance their engagement and increase their adoption of your products.

- Niche (20 segments): These smaller but highly engaged groups share high indices with Core segments, though their overall market impact is more limited. For instance, Rural Resort Dwellers (6E) represent 2% of your customer base but have an impressive index of 727, indicating their engagement is over seven times the market average. Despite their size, these segments are highly valuable for targeted campaigns and premium offerings, as their loyalty and responsiveness can yield significant returns.

- Monitor (41 segments): These groups show minimal engagement and limited potential for growth. For example, Bright Young Professionals (8C) make up only 1% of your customer base with an index of 45, indicating they are significantly underrepresented and less likely to engage with your products or services. As such, these segments are a lower priority for targeted marketing efforts.

Step Four: Map the Target Groups
In this step, you generate map layers to visualize where core and potential customers are concentrated. Set the following parameters in the Target Marketing Wizard:
- Geography Level: US. Tracts
- Mapping Layers: Select Target Layer, Market Potential, and Penetration Layer.
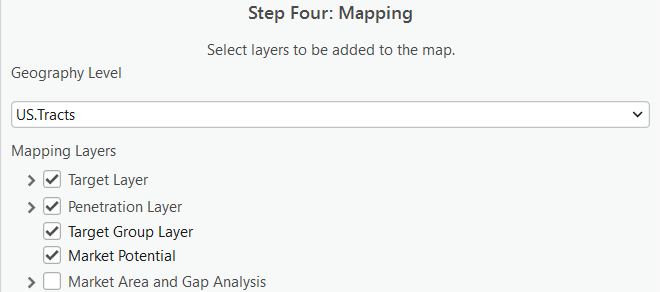
Map Layers
The following map layers provide a visual understanding of where your target customer groups are concentrated and indicate potential areas for growth. Each layer highlights key geographic insights, from where core customers are densely located to census tracts with untapped market potential.
To customize your view, you can toggle layers on or off in the Contents pane, allowing you to focus on specific map layers for detailed analysis.
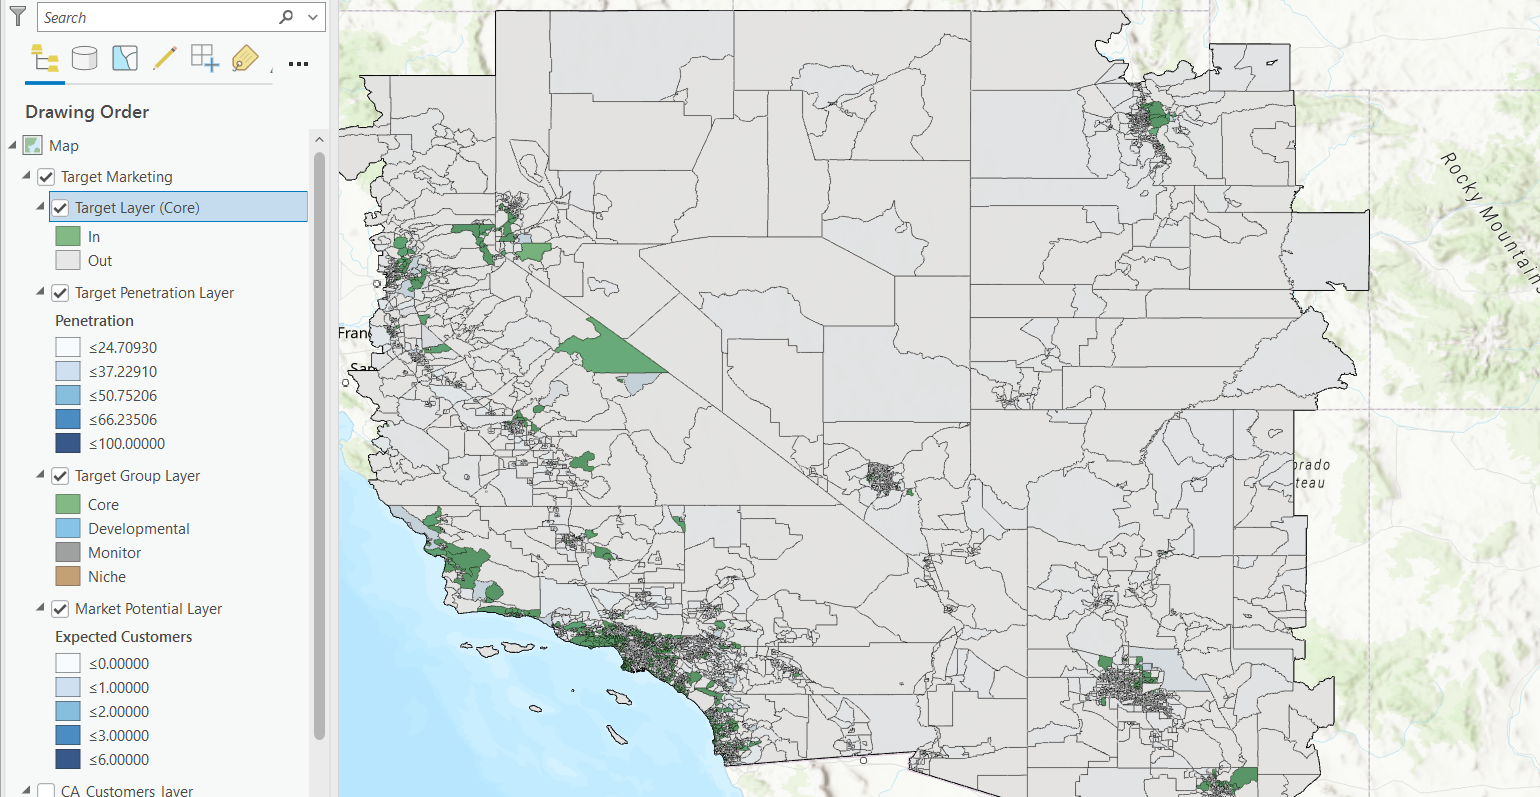
Target Layer:This layer highlights census tracts where potential customers from Core segments, identified in the Four Quadrant Analysis, are concentrated. Core customers are primarily located in key coastal cities such as San Francisco, Los Angeles, and San Diego. These “In” areas represent tracts with high densities of core customers, essential for sustaining current business performance. In contrast, “Out” areas indicate tracts with fewer core customers, offering limited immediate growth potential. The map focuses on tract groups where the dominant segment—representing most households—belongs to our Core Target, which includes segments 1A (Top Tier), 1E (Exurbanites), 2A (Urban Chic), and 2C (Pacific Heights).
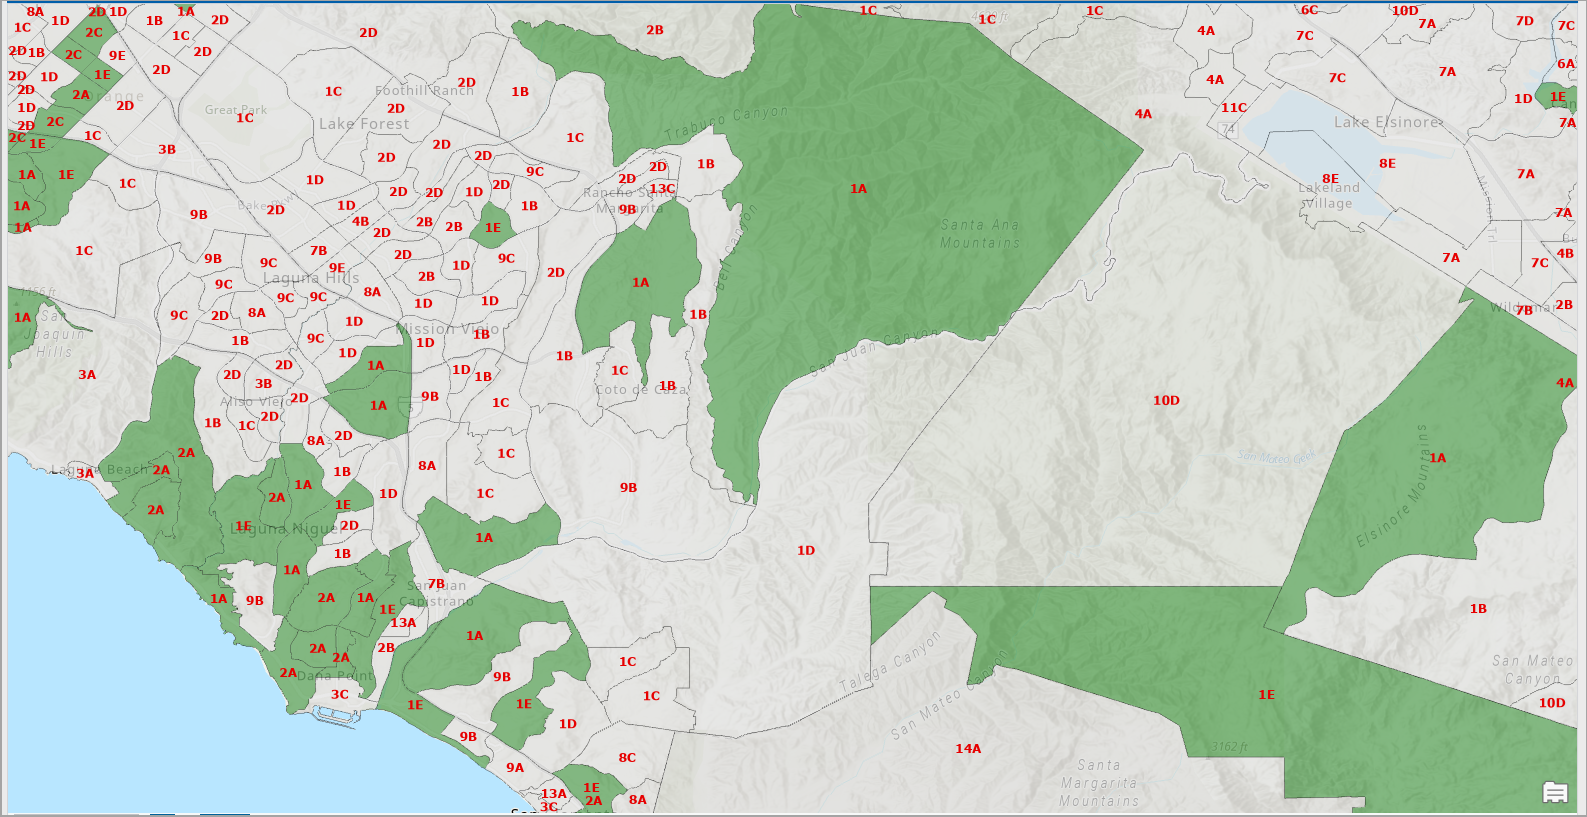
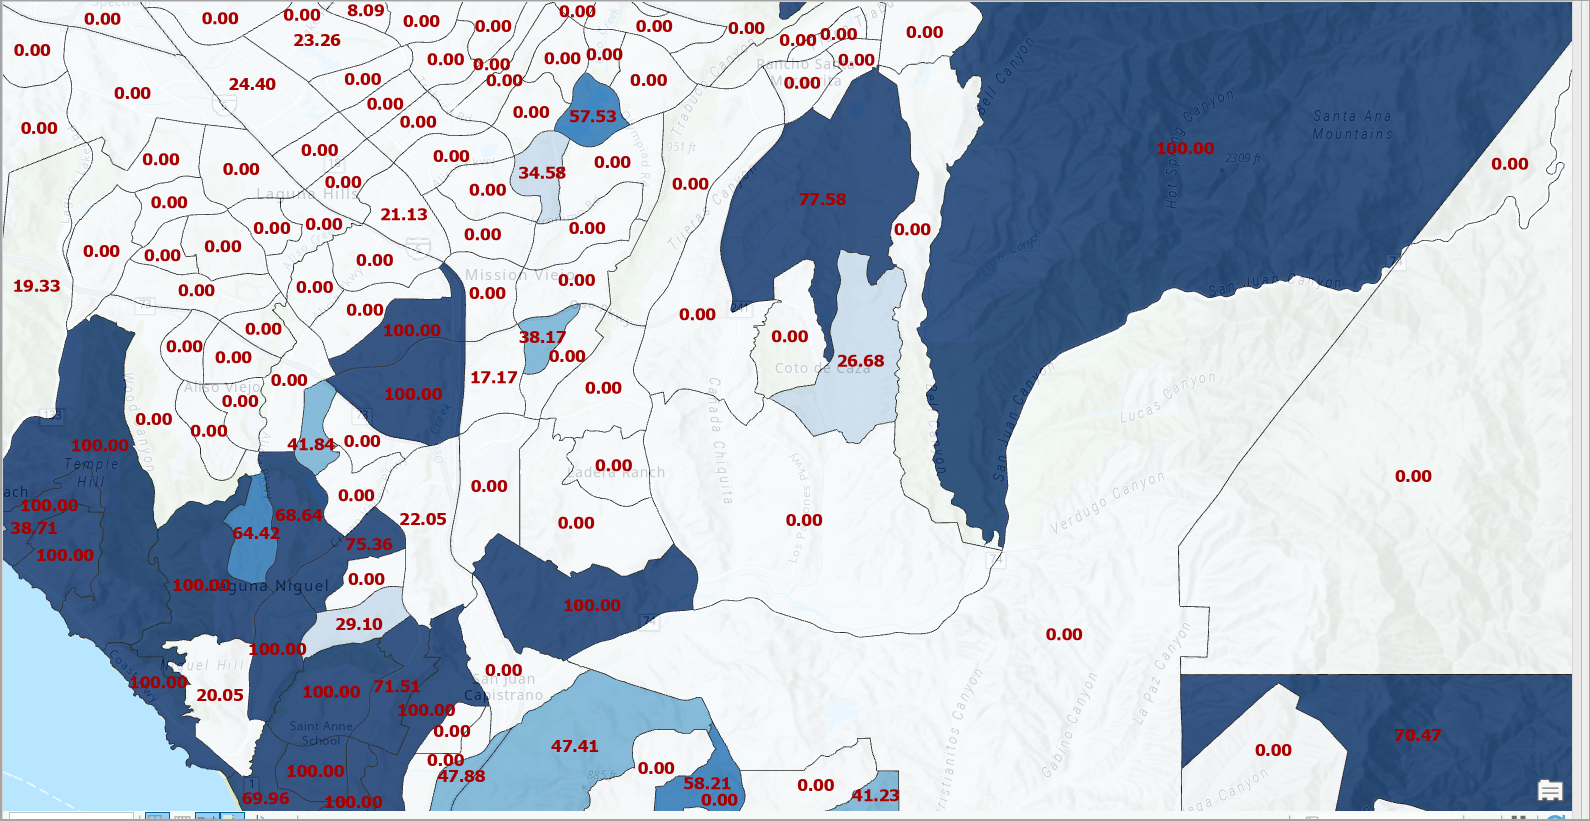
Target Penetration Layer: The Target Penetration Layer shows the percentage of households in the market area that align with your core customer segments. This map highlights areas of high potential, such as census tracts marked with deeper shades of blue and penetration rates approaching 100%, indicating strong alignment with your target audience. Unlike focusing solely on current customers, this layer identifies where households with traits similar to your core customers are located—whether or not they currently shop with you. For example, high-penetration areas near Laguna Niguel and surrounding neighborhoods showcase significant opportunities for expanding your reach among likely customers.
Target Group Layer: The Target Group Layer displays where each of your customer segments—Core, Developmental, Niche, and Monitor—are concentrated across California. This layer helps you focus marketing and expansion efforts where the potential is highest, particularly in Core and Developmental areas.
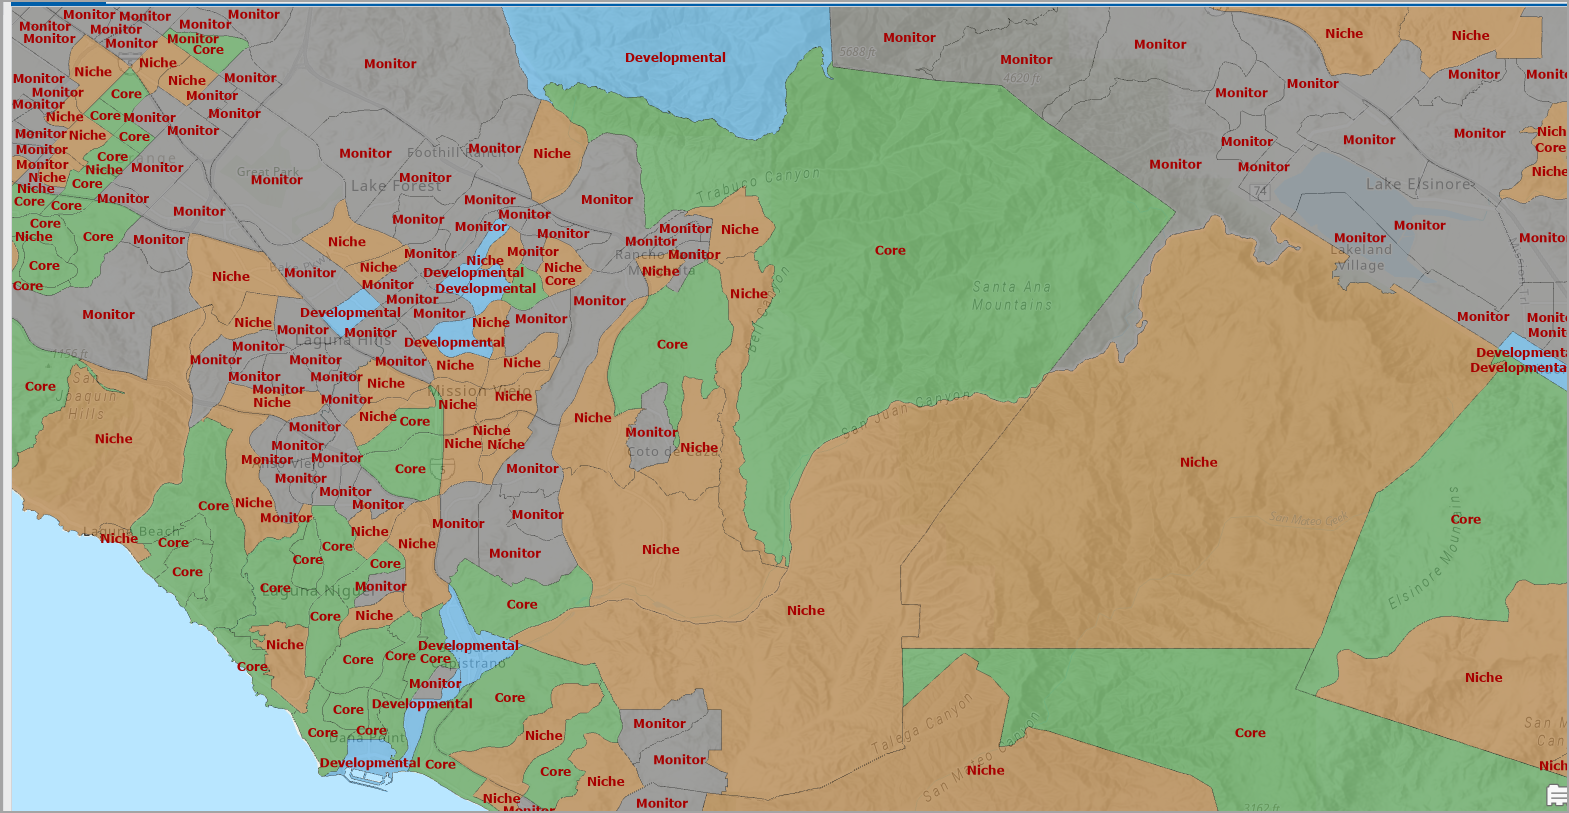
- Core (Green): Primarily located in coastal areas, especially around the Bay Area, Los Angeles, and select urban hubs. These segments align closely with the demographics of your most loyal customers, making them critical for maintaining market strength.
- Developmental (Light Blue): Scattered near cities and suburban areas, these census tracts offer significant growth opportunities through targeted marketing and outreach strategies.
- Monitor (Brown): Found in inland and rural census tracts, these areas have low engagement and may not be priorities for expansion.
- Niche (Orange): Found in specific inland areas, these groups are smaller but highly engaged. They provide opportunities for tailored marketing strategies to maximize their unique value.
Market Potential Layer: This layer highlights areas in California with varying levels of potential for acquiring new customers, based on their alignment with your core customer profiles. The map allows you to identify areas where your marketing efforts could yield the highest returns.
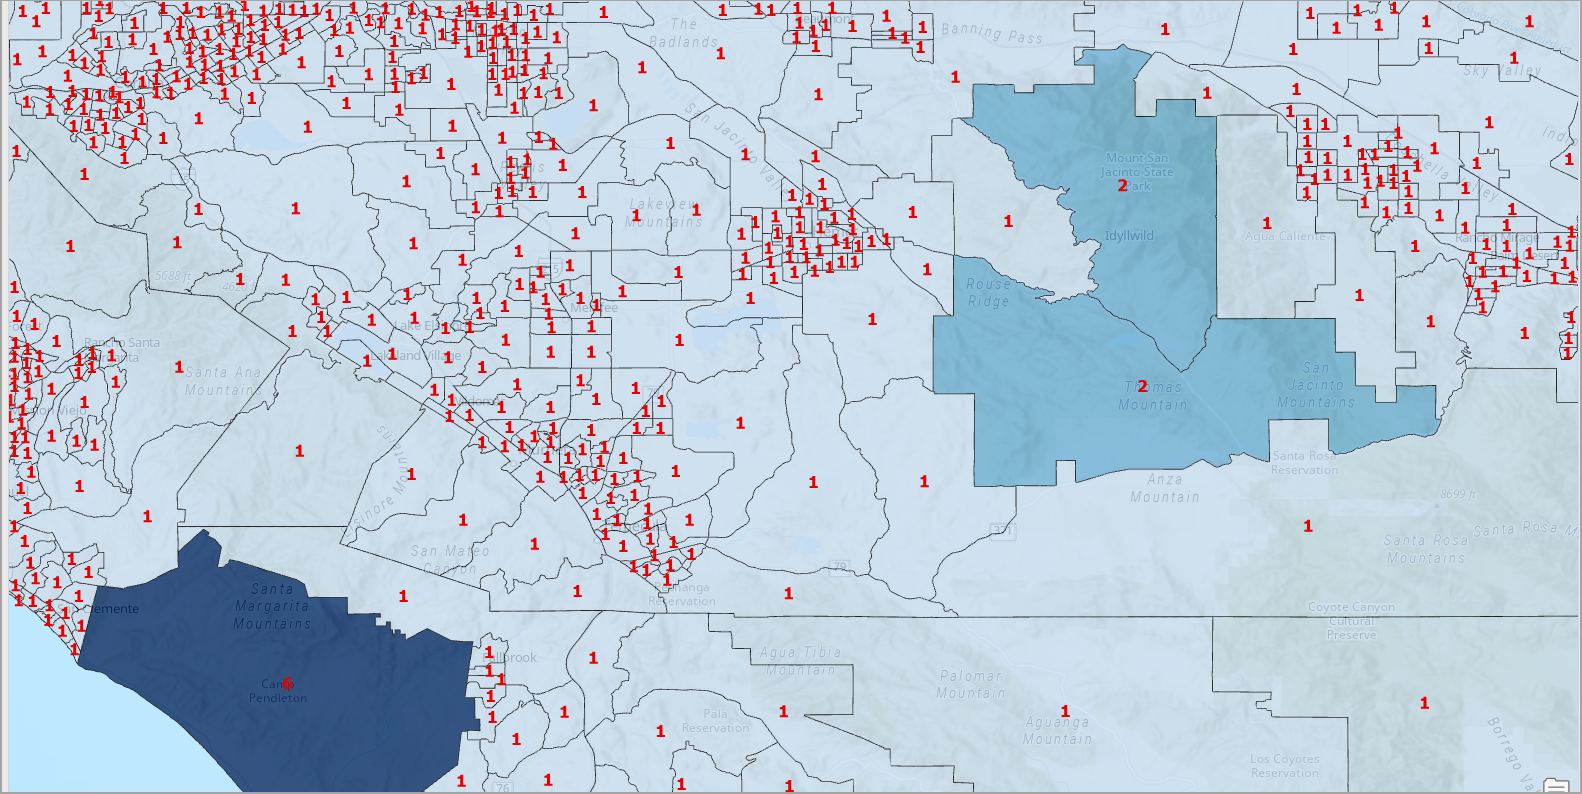
- Lighter Blue (≤0.00): These areas indicate minimal potential for customer acquisition. Census tracts with this shading suggest very low alignment with your core customer segments and are a lower priority for marketing efforts.
- Medium Blue (≤2.00): These areas exhibit moderate potential, reflecting some alignment with your target audience and opportunities for growth through focused marketing.
- Darker Blue (≤6.00): High-potential census tracts, shown in darker blue, represent significant alignment with your core customer profile. Areas such as Camp Pendleton South and nearby urban centers indicate the strongest potential, with up to 6 customers expected in these census tracts. These areas warrant targeted marketing campaigns to maximize growth opportunities.
Step Five: Reporting
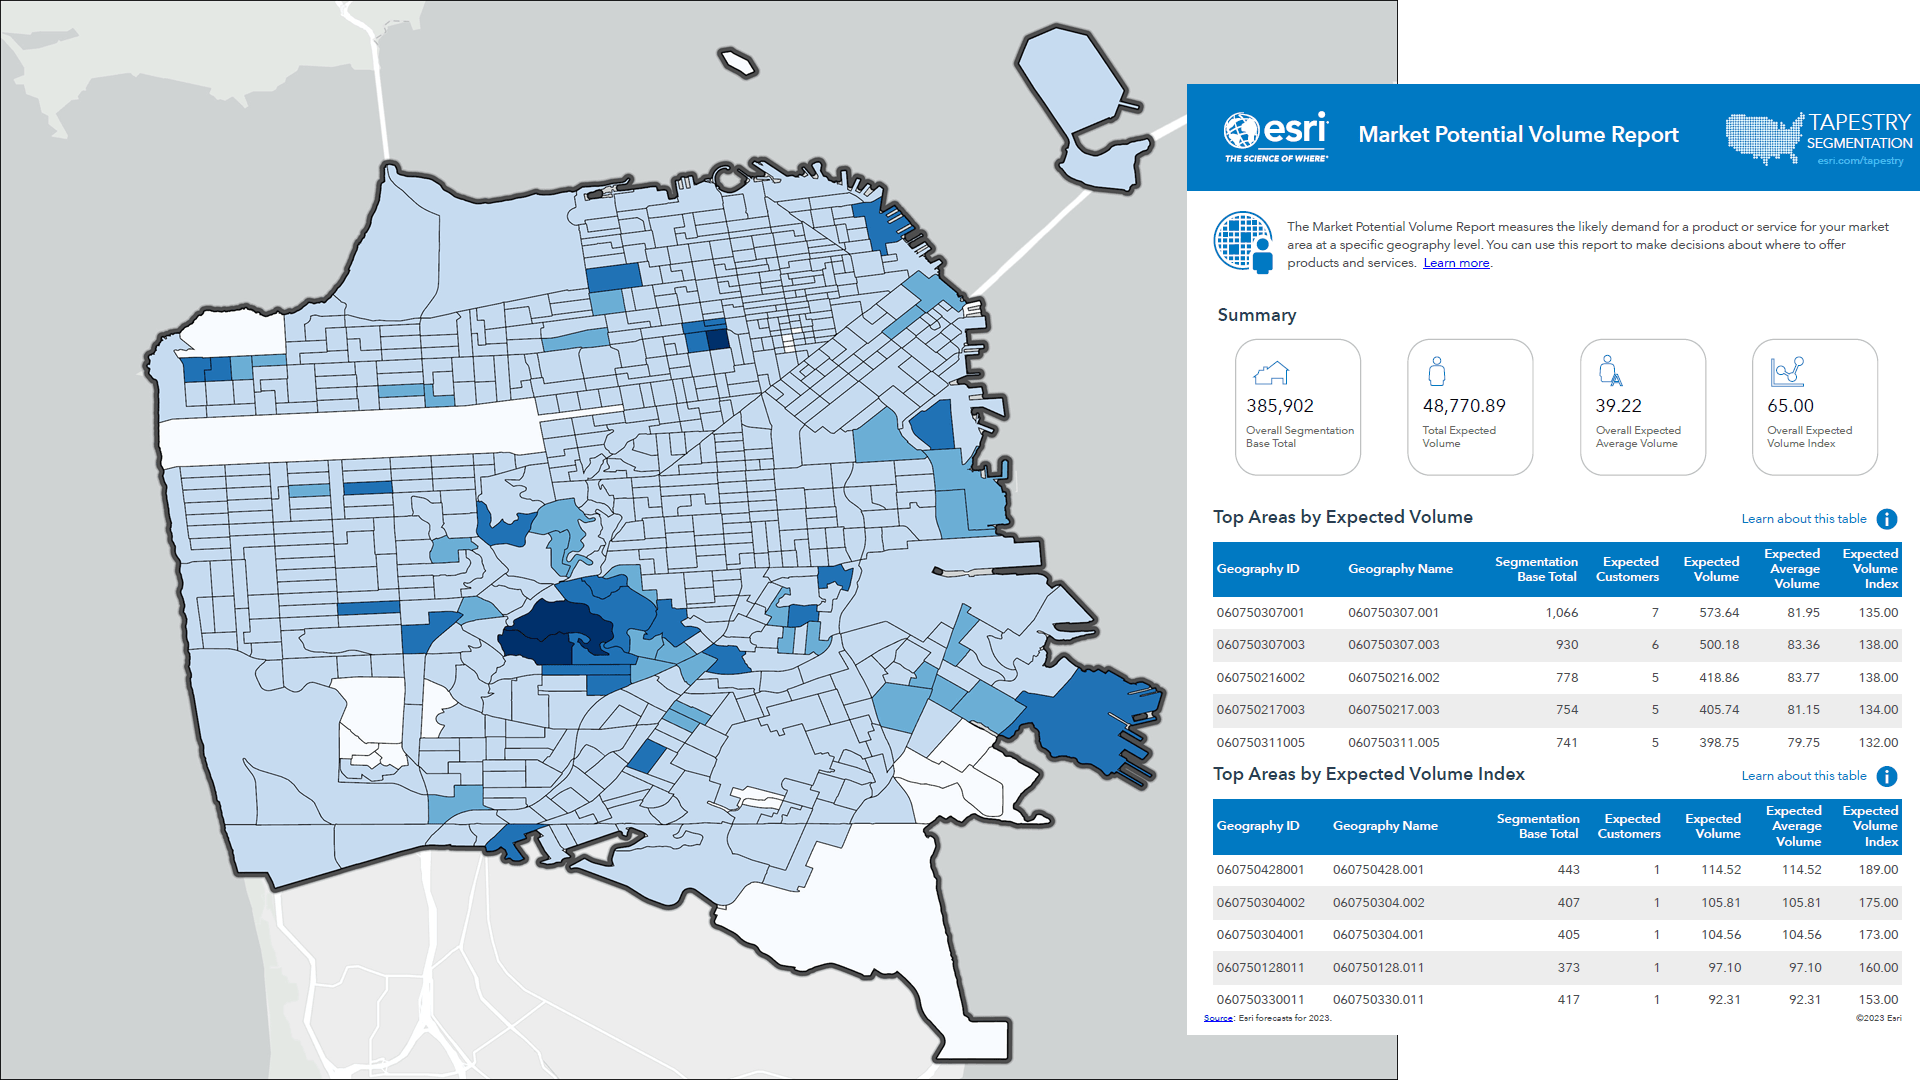
The Target Marketing Wizard generates several reports that offer insights into customer segmentation, market potential, and media consumption habits. These reports are essential for shaping marketing strategies and focusing on areas of growth. For Step 5, we selected the Segmentation Profile, Developing Marketing Strategies, and Market Potential reports. Below is a breakdown of the key reports used in this analysis and the actionable insights they offer.
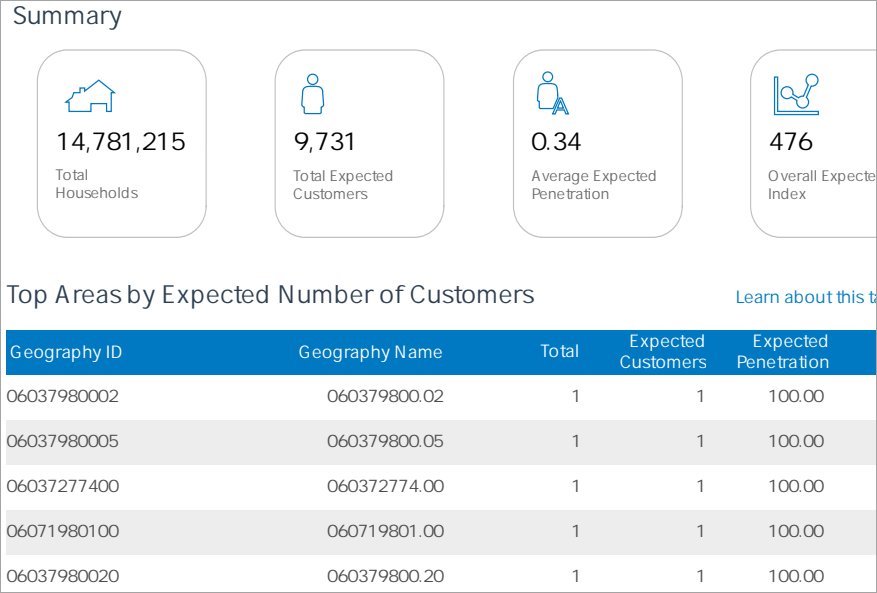
This report provides a detailed breakdown of your customer base and highlights the most valuable segments for solar installations based on target count, penetration, and potential revenue.
For example, the Top Tier (1A) segment represents 7.3% of the target population and has an index of 235, meaning it is significantly overrepresented compared to the general population. Although its penetration rate (3%) is slightly below the base percent (3.1%), its strong overrepresentation and high target count (137) make it a priority for solar installation marketing efforts.
Segments like Rural Bypasses (10E), Rural Resort Dwellers (6E), and Prairie Living (6D) also offer valuable opportunities:
- Rural Bypasses (10E): With the highest index (1260), this segment is a standout niche market despite its smaller target count (17) and percentage (0.9%). Its strong alignment with the target population makes it an ideal focus for specialized campaigns.
- Rural Resort Dwellers (6E): Represents 2.5% of the target population with a target count of 47 and a high index of 727, offering strong potential in rural and scenic areas.
- Prairie Living (6D): Although smaller (1.0% target percentage, 19 target count), its high index (927) indicates strong alignment, making it valuable for focused marketing efforts.
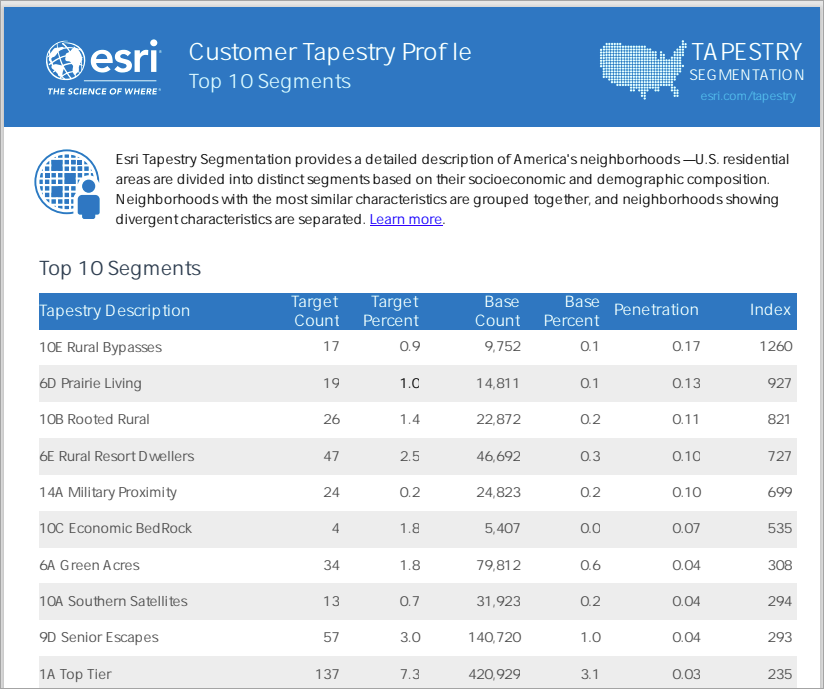
This report identifies census tracts with the highest potential for solar panel customer acquisition by analyzing demographic alignment and expected penetration. With 14,781,215 total households and 9,731 total expected customers, the market presents focused opportunities for growth, with an average expected penetration of 0.34%.
Census tracts such as 06037980002, 06037980005, and 06037277400 each show 1 Expected Customer and an Expected Penetration of 100.00%, indicating strong alignment with your target customer profile. These tracts represent key areas for targeted marketing efforts to maximize customer acquisition.
The Overall Expected Index of 476 reflects how well the identified market area performs compared to the California baseline (set at 100). A higher index indicates stronger alignment between the local population and your ideal customer demographics, making this market highly favorable for solar panel adoption.
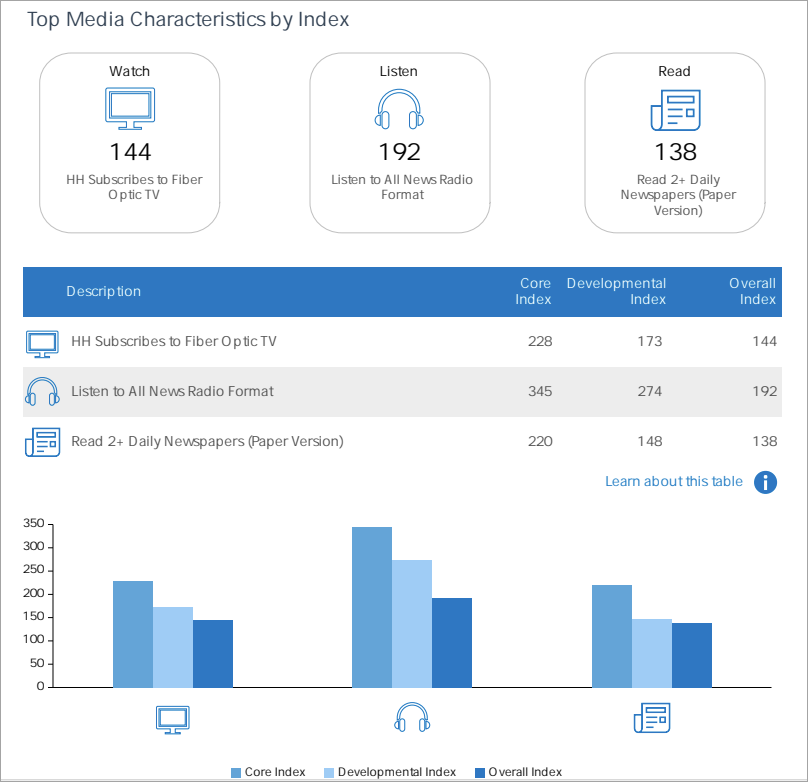
This report outlines media consumption habits to help you craft targeted marketing strategies that align with the preferences of your Core and Developmental customer segments.
- Fiber Optic TV: Core customers are 228% more likely to subscribe to Fiber Optic TV, while Developmental customers are 173% more likely. The overall index of 144 highlights this as an effective channel for reaching both customer groups.
- News Radio: Listening to all-news radio formats is a standout behavior, with Core customers being 345% more likely and Developmental customers 274% more likely to engage with this medium. The high overall index of 192 underscores its effectiveness for targeted outreach.
- Print Newspapers: Reading 2+ daily newspapers (paper version) is also prevalent, with a Core Index of 220 and a Developmental Index of 148, resulting in an overall index of 138. This suggests that while less dominant, print media remains a valuable channel for specific messaging.
The chart below illustrates these trends, emphasizing that Fiber Optic TV and news radio formats are particularly effective channels for engaging Core and Developmental customers. These insights provide a strong foundation for crafting data-driven marketing strategies that resonate with your audience.
Key Insights and Opportunities
Several strategic opportunities emerge from these profiles and reports:
- Capitalize on Core Segments
Segments like Top Tier (1A) and Pacific Heights (2C) show strong alignment with your offerings, as they are overrepresented in your target market and demonstrate high engagement. Continue targeting these groups with premium solar solutions that emphasize energy independence and long-term cost savings.
- Engage Media-Oriented Consumers
Segments such as Rural Resort Dwellers (6E) and Prairie Living (6D) show strong potential with high indices for media consumption, particularly fiber optic TV and news radio. Tailor marketing campaigns using these channels to capture their attention and drive engagement with solar solutions.
- Expand Urban and Digital Outreach
Urban Villages (7B) represents a segment with untapped potential. While they currently account for a smaller share of your customer base, their demographic alignment suggests an opportunity to invest in digital-first marketing strategies to build awareness and engagement.
- Leverage Suburban Sustainability Trends
Segments like Urban Chic (2A) and Green Acres (6A) reflect strong values in family-oriented, sustainable living. These suburban areas are ideal for promoting residential solar solutions, emphasizing eco-friendly benefits and energy savings to match their priorities.
- Focus on High-Potential Media Channels
Based on the media consumption report, news radio and fiber optic TV are standout channels for reaching Core and Developmental customers. Consider expanding advertising efforts in these spaces to enhance visibility and drive conversions.
Conclusion
By leveraging the Target Marketing Wizard in ArcGIS Business Analyst Pro, you can uncover meaningful insights into both Customer Profiles and Market Area Profiles, enabling a comprehensive understanding of your market dynamics and customer segments. Whether your goal is to deepen engagement with high-potential Core Segments, reach underrepresented urban audiences through digital campaigns, or promote solar solutions to sustainability-focused suburban communities, these tools empower you to craft targeted, data-driven marketing strategies.
This workflow ensures your efforts are aligned with the highest growth potential, helping you capitalize on emerging opportunities, maximize your impact, and stay competitive in the ever-evolving renewable energy market.
Ready to take the next step? Start by creating a Customer Profile in ArcGIS Business Analyst Pro today and discover how data-driven insights can unlock new opportunities for growth and success.


Article Discussion: