As part of the November 2024 release, ArcGIS Business Analyst Web App has an updated and redesigned points of interest (POI) search workflow. The POI search workflow finds places and plots them on a map.
Enhancements to this workflow include the following:
- The search options have been redesigned to improve discoverability.
- Searches can be prefiltered using an advanced search with conditions.
- The new Place map style provides default sets of POI icons for datasets, enabling one-click intuitive symbology.
- The search results are now populated in the new Results pane, featuring a summary, histogram, bubble chart or scatterplot, and downloadable table.
In this blog article, we’ll use a POI search to analyze parking and entertainment in Lausanne, Switzerland. We need to identify where places for entertainment are located and whether there is ample public parking nearby.
Set the data source
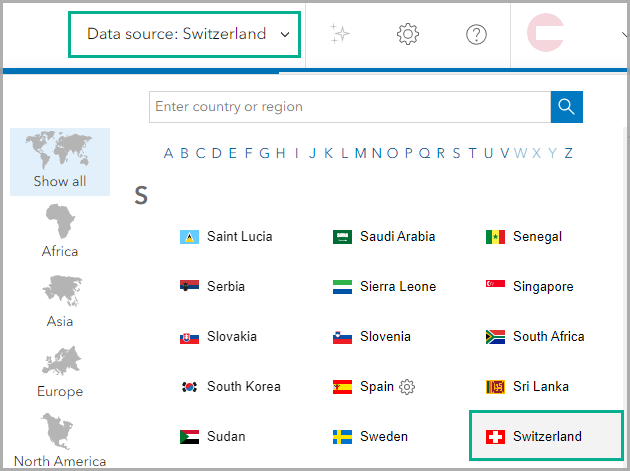
First, let’s use the Data source drop-down menu to set Switzerland as the data source. Points of interest data (also known as Places data) is available regionally from different providers. For more information, see Introduction to Places data. For Switzerland, the places data is provided by Foursquare.
Set the analysis extent
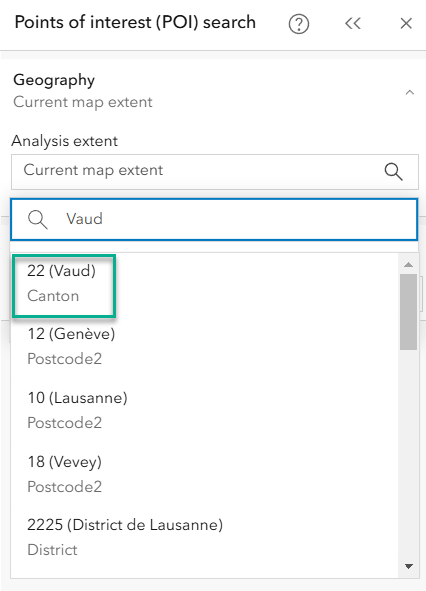
Now that the data source is set to Switzerland, let’s start the POI search workflow. On the Maps tab, click Create maps and select Points of interest (POI) search. For Analysis extent, enter Vaud and select the Canton Vaud result.
Map an advanced search
We can start entering our search criteria in the Search section of the workflow pane. Click the Enter keyword, category, etc. field and click the Advanced search tab.
We are interested in searching for all places for entertainment and parking in the area. Click + Add condition. To add a condition, you must select a field, then choose a filter operator and set a value. Create a condition as follows:
- For the field, select Category.
- For the filter operator, choose is any of the following.
- For the value, select Arts and Entertainment (All). In the Enter category name field, type parking and select Parking.
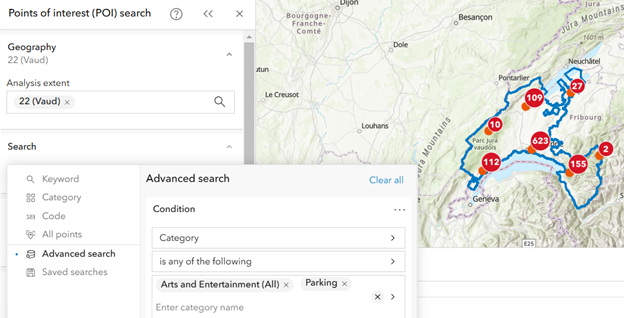
We can also use an advanced search condition to make our search more complex and our results more specific. Since there is a restriction on returning a maximum of 5,000 points, using an advanced search condition is useful to make the query as specific as possible for the most relevant searching.
Let’s refine the results to focus on a single city and prefilter the results to the city of Lausanne. Create a condition as follows:
- For the field, select Locality.
- For the filter operator, choose is.
- For the value, enter Lausanne.
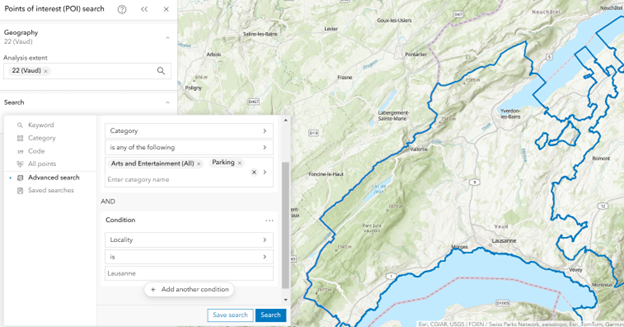
Click Search to perform the points of interest search with the new advanced condition. The places are added to the map. Zoom in to explore the results.
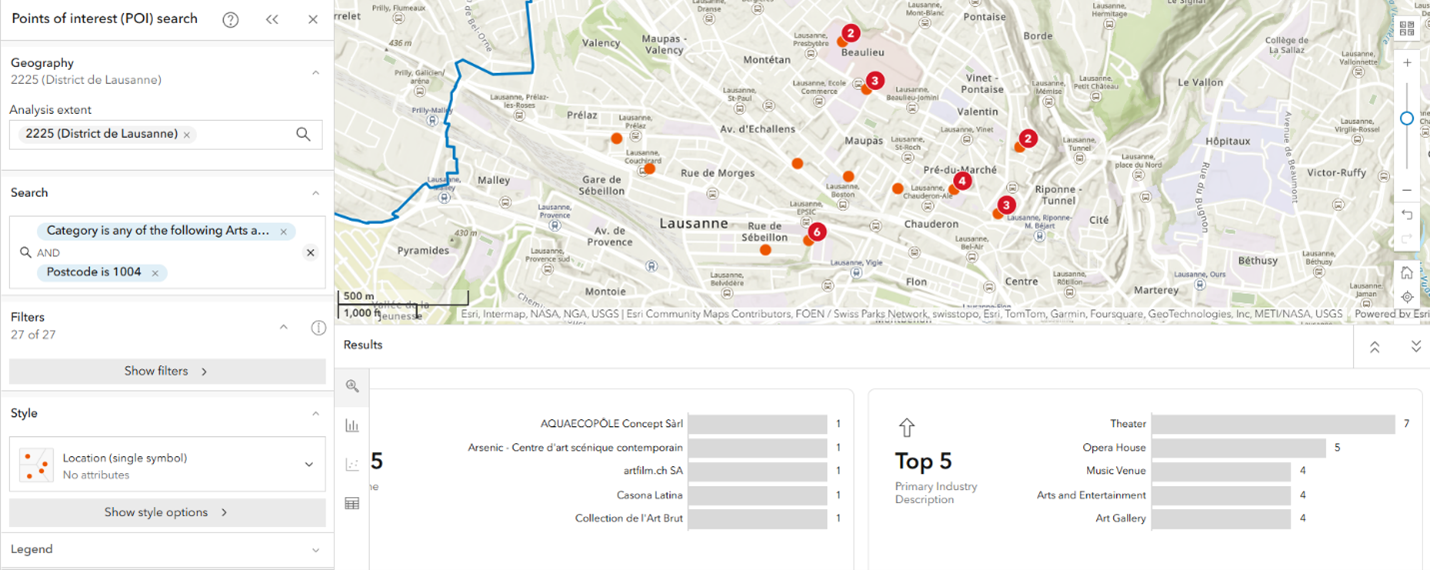
Filter the results
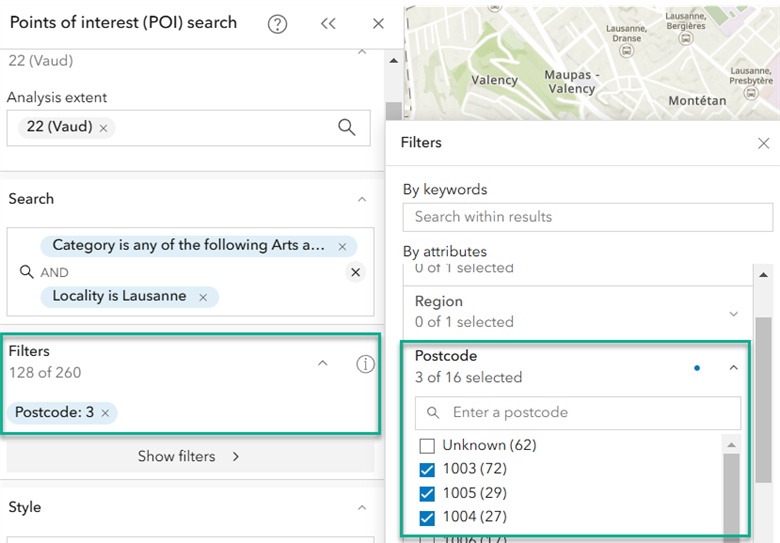
We can also use a filter to further refine our results. While prefiltering uses conditions to create a more specific search, filtering refines the search results to return more specific places.
Click Show filters and expand the Postcode drop-down menu. Let’s check the postcode 1003, 1004, and 1005 options. The filter is automatically applied, and the map results are updated.
Stylize the map
By default, the map uses the Location (single symbol) style. Click the Style drop-down menu and select Place. The point icons are replaced with curated icons that match the datasets.
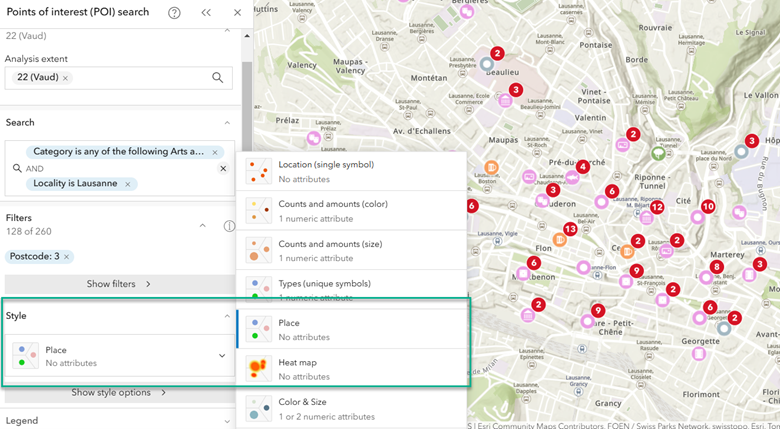
This new map style provides one-click symbology. This provides quick visual identification for the types of places represented by the points.
Let’s increase the icon sizes. Click Show style options and drag the Size slider to increase the icons to size 35. Optionally, use the Cluster points toggle button to aggregate points into clusters or display them individually on the map.
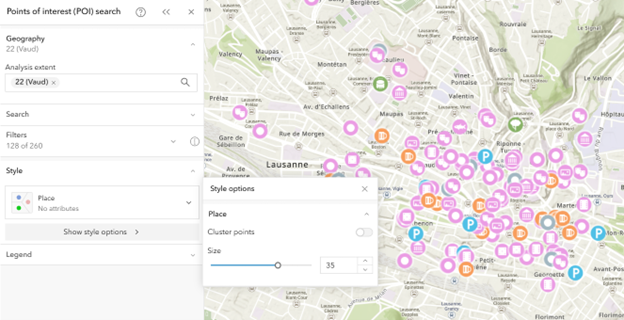
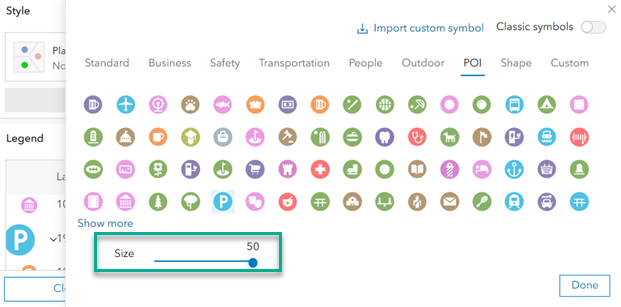
In the Legend section, find and click the icon for parking. In the symbolization menu, use the Size slider to increase the parking icon size to 50. Now all of the parking icons are the largest icons on the map. Use the map legend to reference what the icons symbolize and how many places are identified on the map.
Explore the results
Let’s explore the Results pane. The Results pane in our scenario features a summary, histogram, and attribute table.
On the Summary tab, use the horizontal scroll bar to see the Top 5 primary industries.

Click the Table tab to view the results as a table. Hover over an item in the table to highlight the corresponding site on the map. Optionally, click Customize table to modify the columns in the table. Drag the name of a column to change its order in the table. Uncheck the check box next to the column name to deselect it from the table.

Points of interest can be used alone or in tandem with additional data to enrich the analysis. For instance, run infographics for your sites. Use the Transit Stop Analysis infographic to see walk time distances.
This blog article has described a scenario using the updated points of interest search workflow in Business Analyst Web App. We welcome your feedback! Please use the feedback option at the bottom of this blog article or post on Esri Community.



Article Discussion: