ArcGIS Pro 3.4 introduces several enhancements for hyperspectral imagery, including support for AVIRIS data, improved Cloud Raster Format (CRF) storage for hyperspectral data, and a new Add Hyperspectral Data dialog box, which enhances the user experience when working with hyperspectral data. This blog uses the Jack and Laura Dangermond Preserve as the study area to demonstrate how these improvements have streamlined the analysis workflow, allowing the creation of an oak tree map for the preserve using hyperspectral AVIRIS imagery.
Get familiar with the data and the study area
Located at the intersection of two ocean currents at Point Conception in Santa Barbara County, the Dangermond Preserve is a home to a variety of wildlife species. Its coastal oaks are remarkable for their ability to thrive near the ocean while providing essential habitats for the area’s wildlife. Our goal is to map the existing oak trees using AVIRIS hyperspectral imagery.
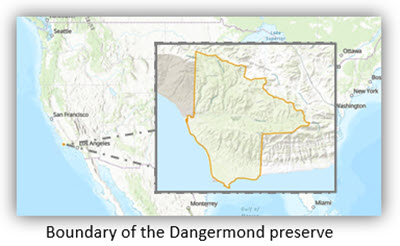
The Airborne Visible/Infrared Imaging Spectrometer (AVIRIS) is a NASA Jet Propulsion Laboratory (JPL) mission that began providing hyperspectral imagery in 1989 and has recently been innovated with the next-generation AVIRIS-NG. AVIRIS-NG captures imagery across the full wavelength spectrum, and its high-spatial and spectral resolution enables applications that are not possible with traditional multiband images, such as tree species mapping, greenhouse gas detection, and mineral analysis.
AVIRIS-NG data can be accessed from the AVIRIS-NG Data Portal. We downloaded eight scenes covering the study area, specifically the surface reflectance product from the year 2020.
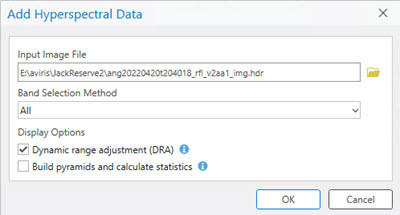
To examine the data, we load one of the images to ArcGIS Pro using the new Add Hyperspectral Data dialog box in ArcGIS Pro.
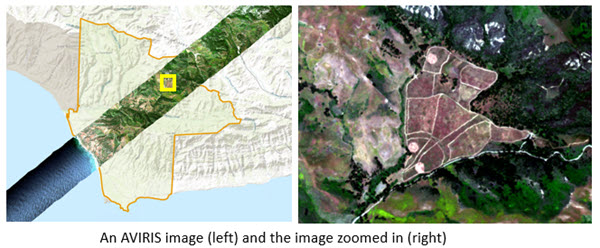
The image is a long strip along the flightline; the 4-meter resolution clearly reveals the oak trees and the former agriculture land where the preserve has planned to plant new oak trees.
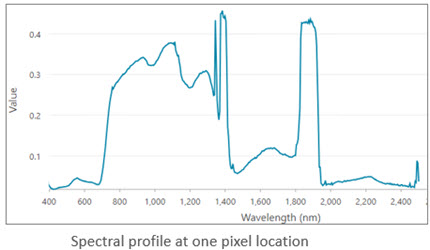
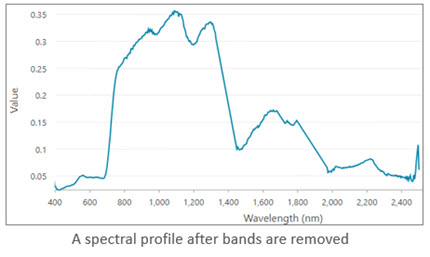
The AVIRIS image consists of 425 bands, covering a wavelength range from 380 to 2,510 nanometers. Two prominent spikes in the spectral profile are caused by water vapor absorption in the atmosphere. These “noisy” bands are not useful in our study and will be removed to improve accuracy in analysis.
Create a hyperspectral image mosaic for the study area
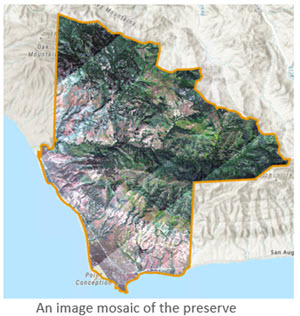
To prepare data for analysis, we will first create a mosaic dataset from the eight AVIRIS images using the new AVIRIS raster type, which is used to search, identify AVIRIS imagery, and construct rasters for the mosaic dataset.
Since the image extent includes many NoData pixels due to the orientation of the long flightline, we used the Build Footprint tool to recalculate the geometry of the footprint, ensuring the scene includes only valid pixels.
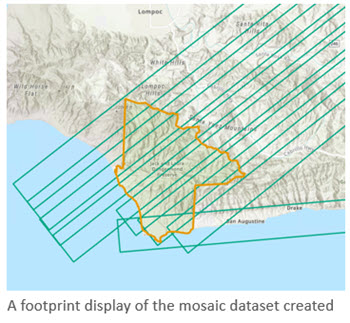
Because large portions of the images fall outside of the study area and some bands are not relevant to our analysis, the next step is to create a mosaic that includes only the necessary pixels. To do this, we will apply a processing template, shown below, that clips the mosaic to the study boundary and removes the noisy bands using the following processing template.

The Subset Bands function, specifically designed for hyperspectral imagery, allows you to extract bands by specifying wavelength or band ID ranges. In this case, we exclude bands in the ranges of 192 to 211 and 285 to 314, which is “noisy” data due to water vapor absorption.
Finally, we use the Generate Raster From Raster Function geoprocessing tool to save the result as a hyperspectral image mosaic in CRF format.
The two pikes in the spectral profile at the same location in the mosaicked image have been successfully removed.
Perform analysis
Now we are ready to begin our analysis. To extract oak trees within the study area, we will use the Spectral Angle Mapper (SAM) method in the Classify Raster Using Spectra tool. Unlike other classification methods, SAM allows us to extract only the class interested (in this case, oak trees) without classifying all other pixels in the image.
To start, we first collected a few oak tree locations using the Training Sample Manager.
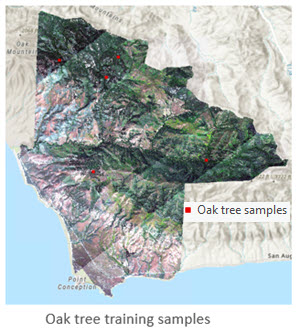
Next we used the Classify Raster Using Spectra tool with the hyperspectral image mosaic and the measured training samples we prepared earlier.
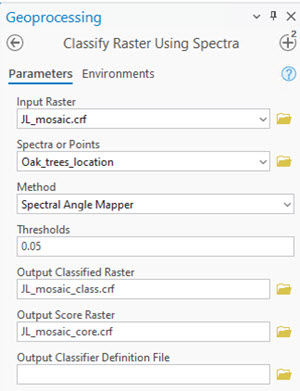
The result of the process is the oak tree map of the Dangermond Preserve. To determine the appropriate threshold, we initially set the threshold to zero, output both the classified raster and score raster which contains the spectral angle values to the target, then used the score raster to fine-tune the threshold. The extracted oak trees are represented by pixels with spectral angles closest to the training samples.
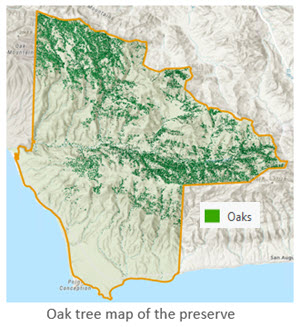
Most oak trees are concentrated in the northern and eastern parts of the preserve, with very few found in other areas. The preserve’s coastal live tree restoration project has seeded 5,068 trees since 2020, and we believe these trees will play a critical role in sustaining the ecosystem in this region.
Summary
ArcGIS supports various types of hyperspectral imagery, including Earth Surface Mineral Dust Source Investigation(EMIT), AVIRIS, and any hyperspectral imagery stored in standard ENVI or TIFF format, along with a wide range of image analysis tools. We encourage you to apply these capabilities and analysis workflows in your work.

Article Discussion: