The fall release of ArcGIS Maps SDK for JavaScript has arrived, leading by new feature table enhancements and improved drawing experience. Join us as we delve into the highlights of the 4.31 release!

Feature Table: save configurations and export features to CSV
We continued to bring significant enhancements to feature table, including save out any configuration on how it should display, exporting selected features to CSV, better attachment support, and more.
Configure and save display settings: The new attribute table template enables you to configure, save, and reuse your own settings of displaying feature table’s columns. You can define properties such as visibility, order, and sorting of the table’s columns. Tables can contain a variety of elements, such as fields, attachments, and relationships. This new feature simplifies sharing and reusing of table configurations across different applications. For instance, you can reused configured table settings from Map Viewer to custom applications or across multiple custom applications to ensure a consistent user experience.
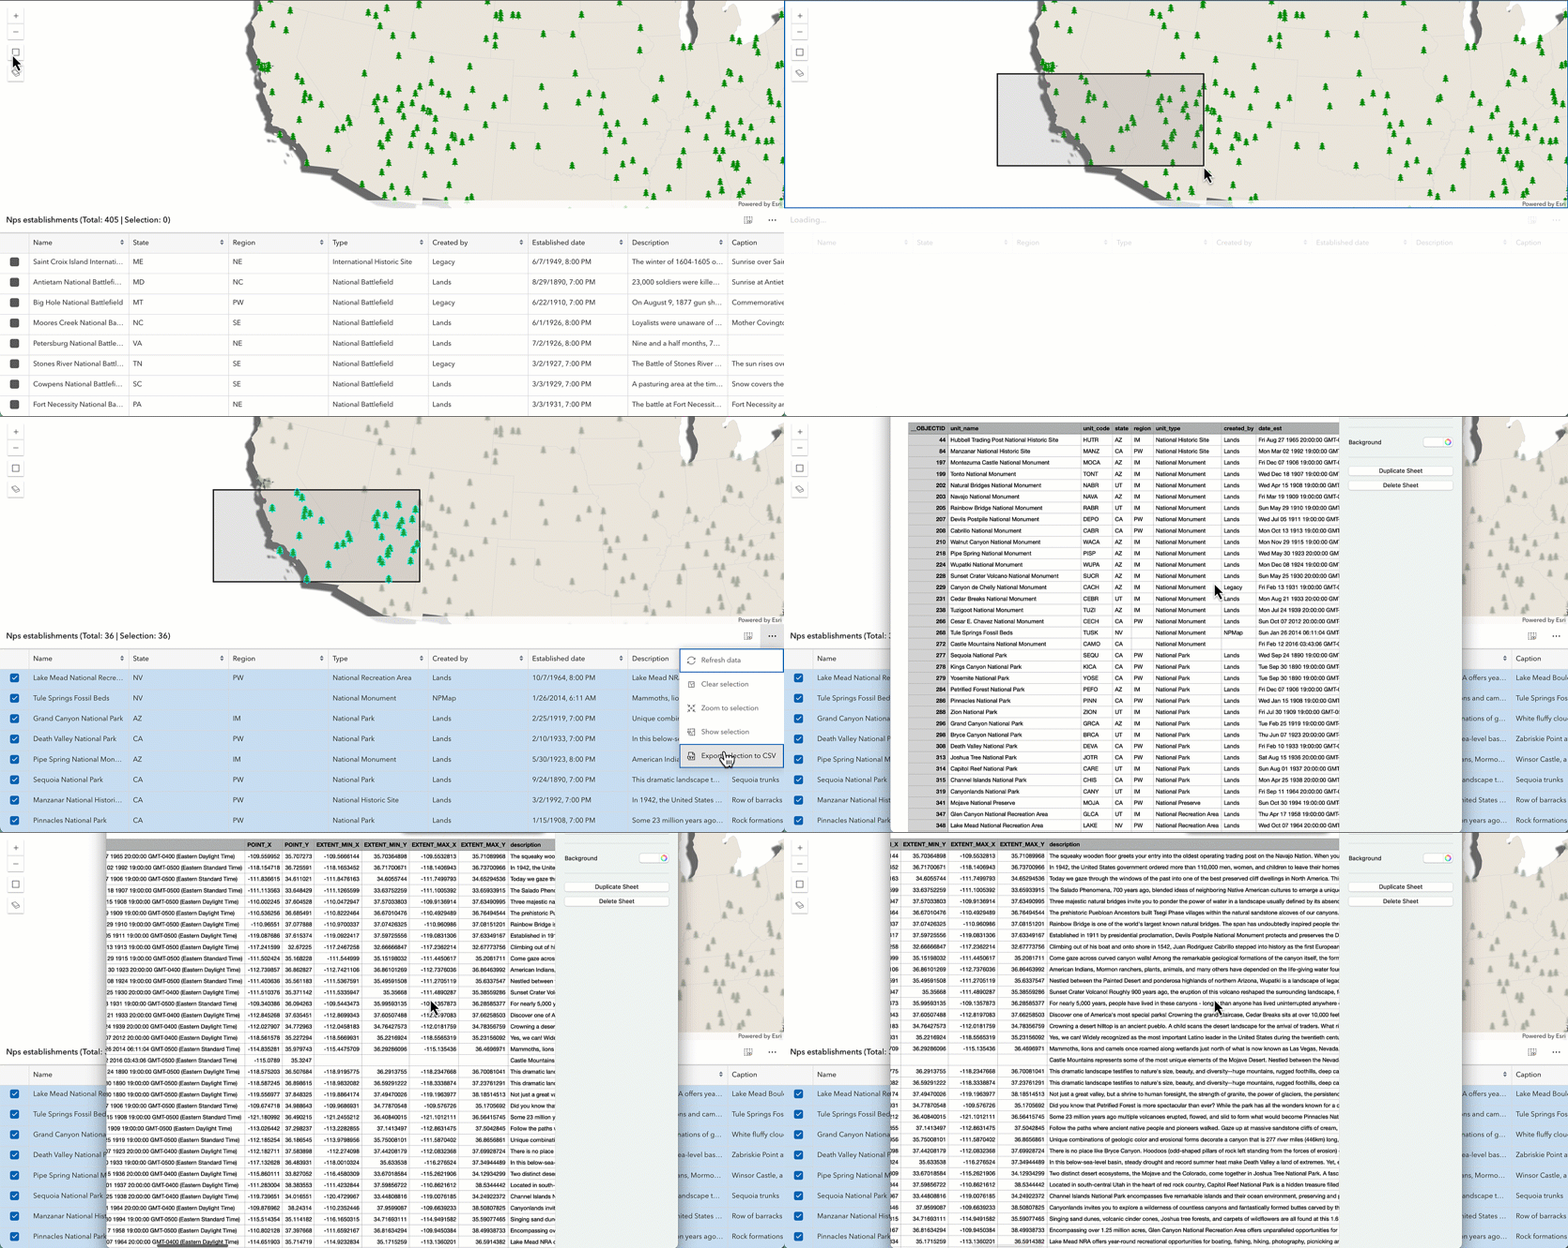
Export selected features to CSV: Selected features can be exported programmatically or with the default “Export selection to CSV” option in feature table’s menu. If point data is being exported, the downloaded CSV file will automatically include columns with latitude and longitude coordinates. Exporting selected features can be combined with interactive highlight, querying, and filtering, achieving seamless workflows beyond the web application.
View and update attachments: With the appropriate layer permissions, users can add, update, and delete the feature attachments in feature table.
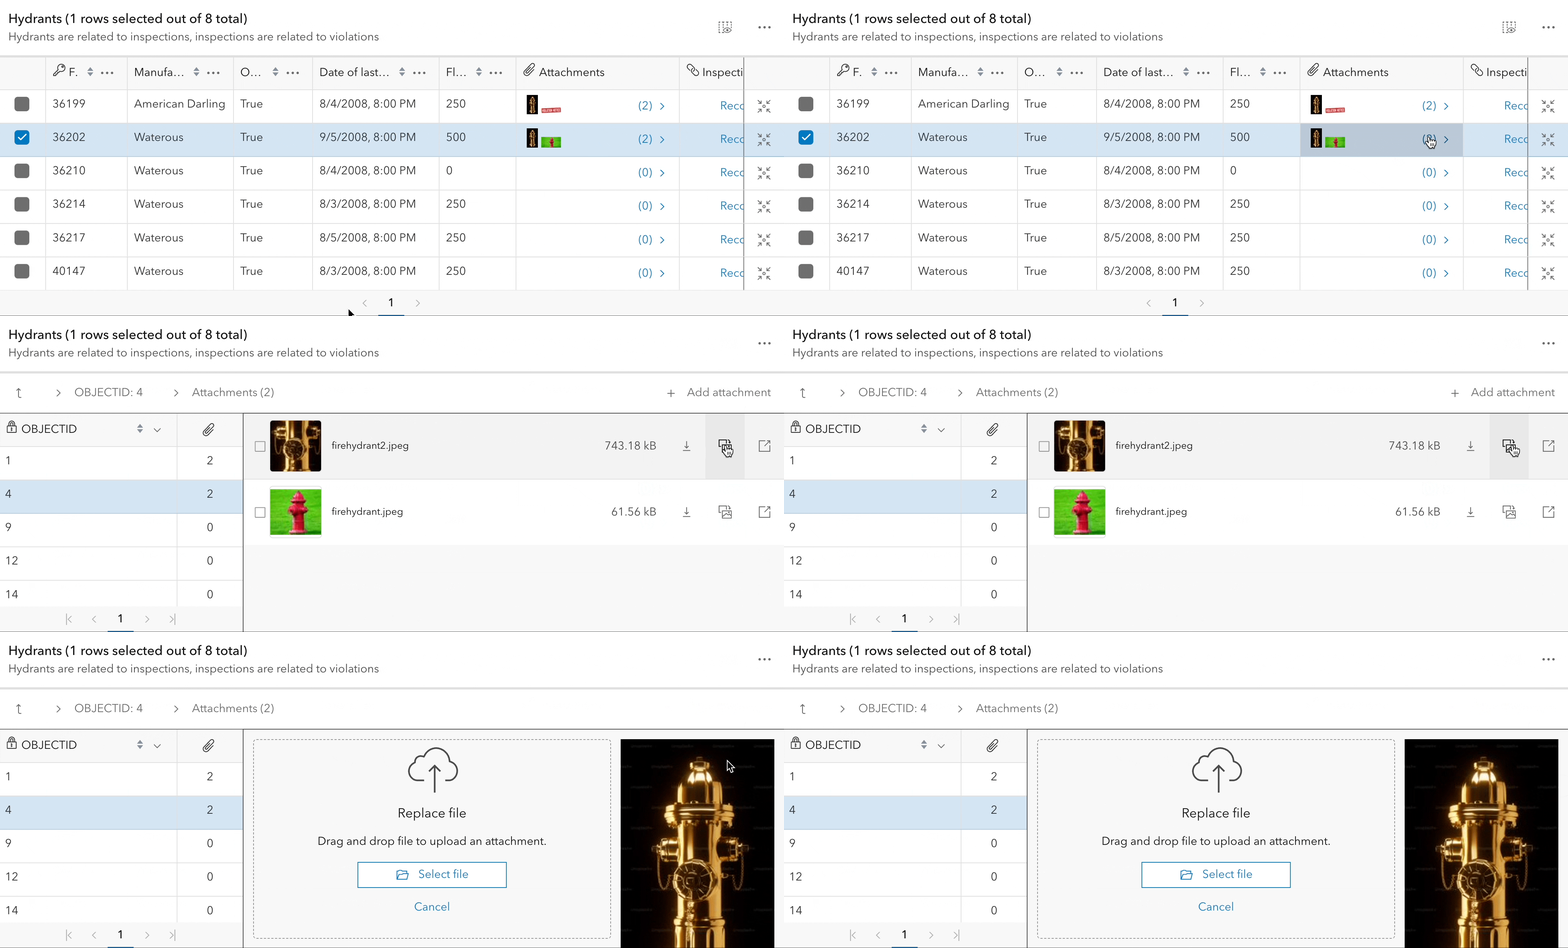
In addition to the mentioned features and improvements, we included pagination for viewing high volumes of records and complete support for viewing and editing feature layers with subtypes and data within subtype group layers.
Snap to grid
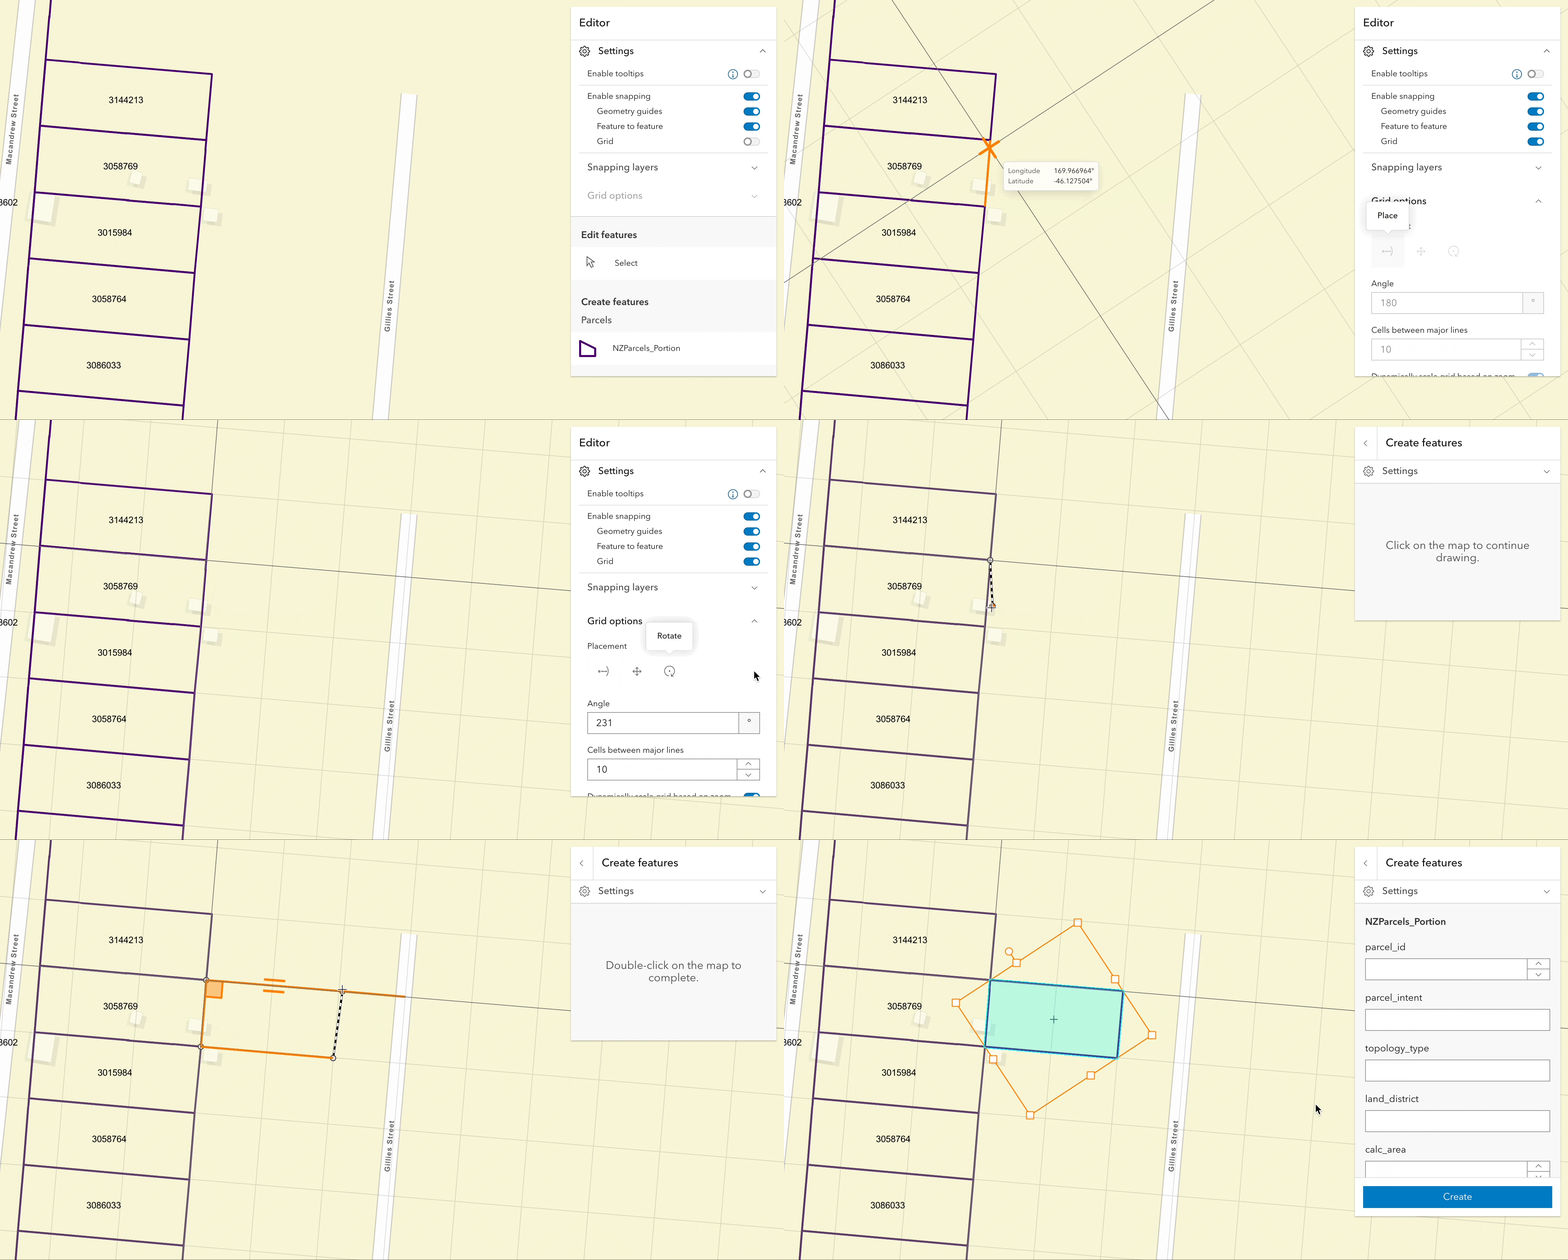
Are you drawing uniformly-shaped parcels and evenly-spaced street lights? We have you covered with the new snap to grid drawing capability. Create a two-dimensional grid and snap feature to the grid with the new grid control widget. The grid is a network of uniformly spaced horizontal and perpendicular lines rendered on the screen to guide drawing. You can interactively move, scale, and rotate the grid, and snap the grid to existing features on the map. Snapping to grid is especially useful for editing and sketching workflow that requires efficient placement of features that conform to a regular grid, such as parcel editing and utility line drawing.
Tooltip enhancements
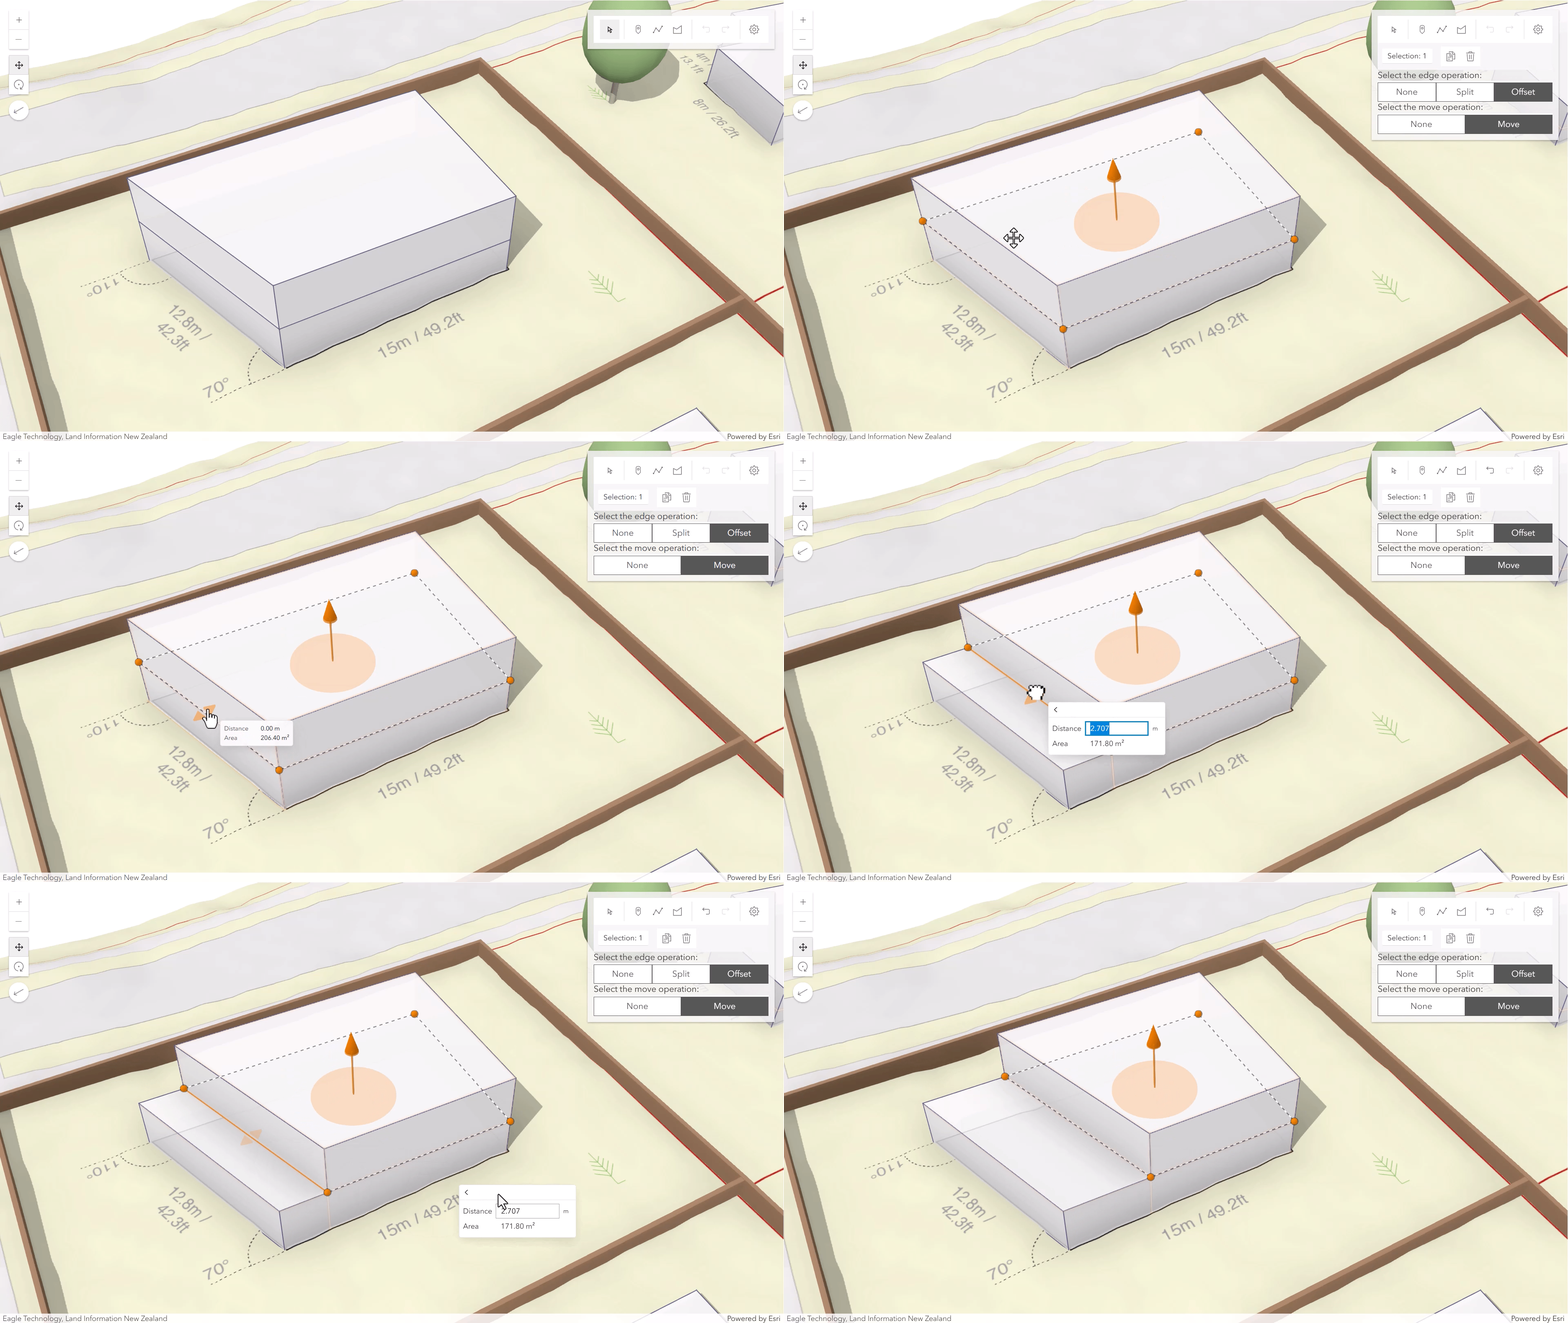
Set edge offset in 3D: You can set the distance between edges of 3D objects using the new edge offset field to create exact building setbacks.
Draggable tooltip: Drag the tooltip while in input mode to change its position.
Binning and clustering now support line and polygon
You can aggregate line and polygon geometry to bins or clusters in feature layer. Binning and clustering are client-side operations that help reduce visual clutter and reveal hidden trends behind small features that are hard to see at smaller scales.
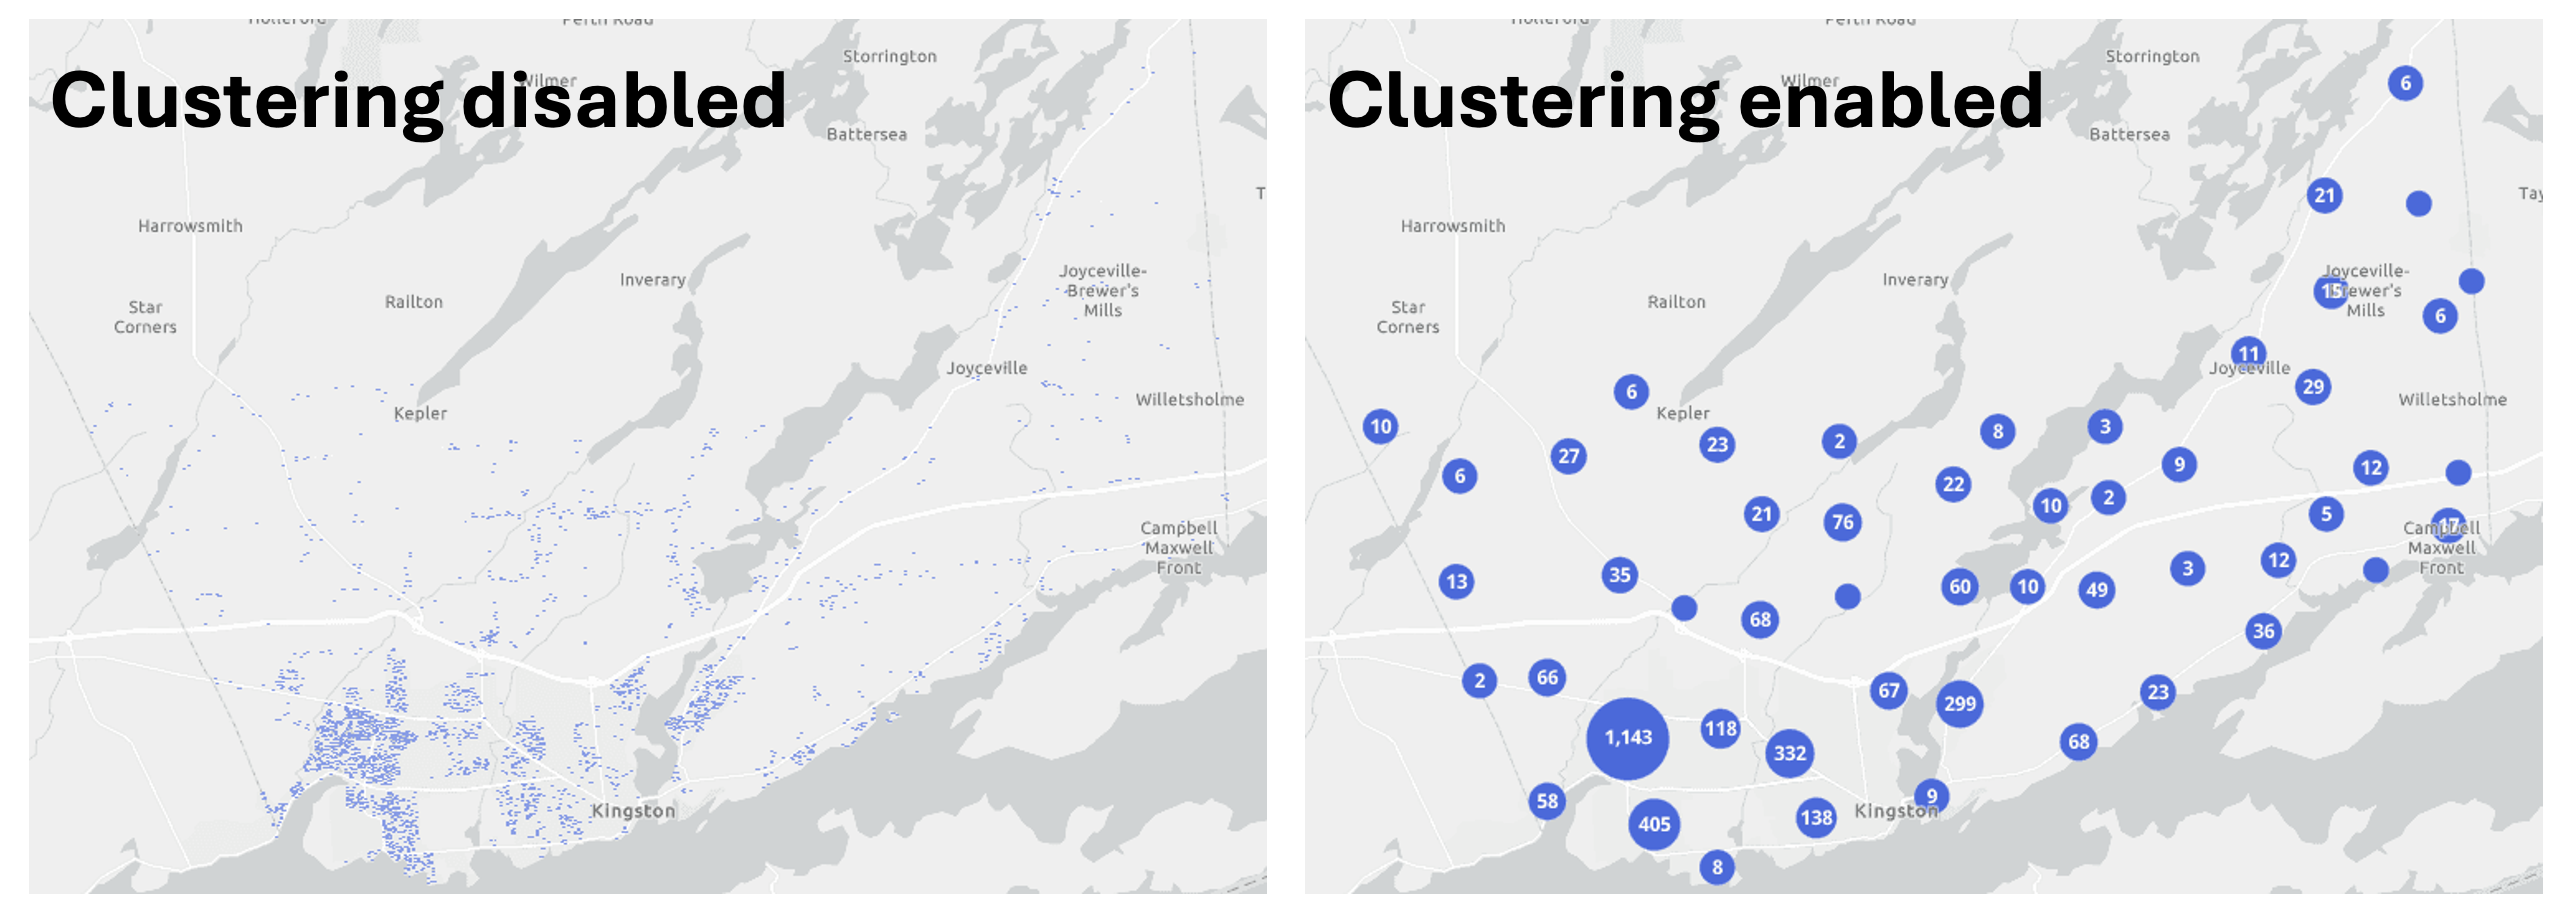
Learn more about best practices and visualization tips for binning and clustering lines and polygons in the sample.
Symbol animations (beta)
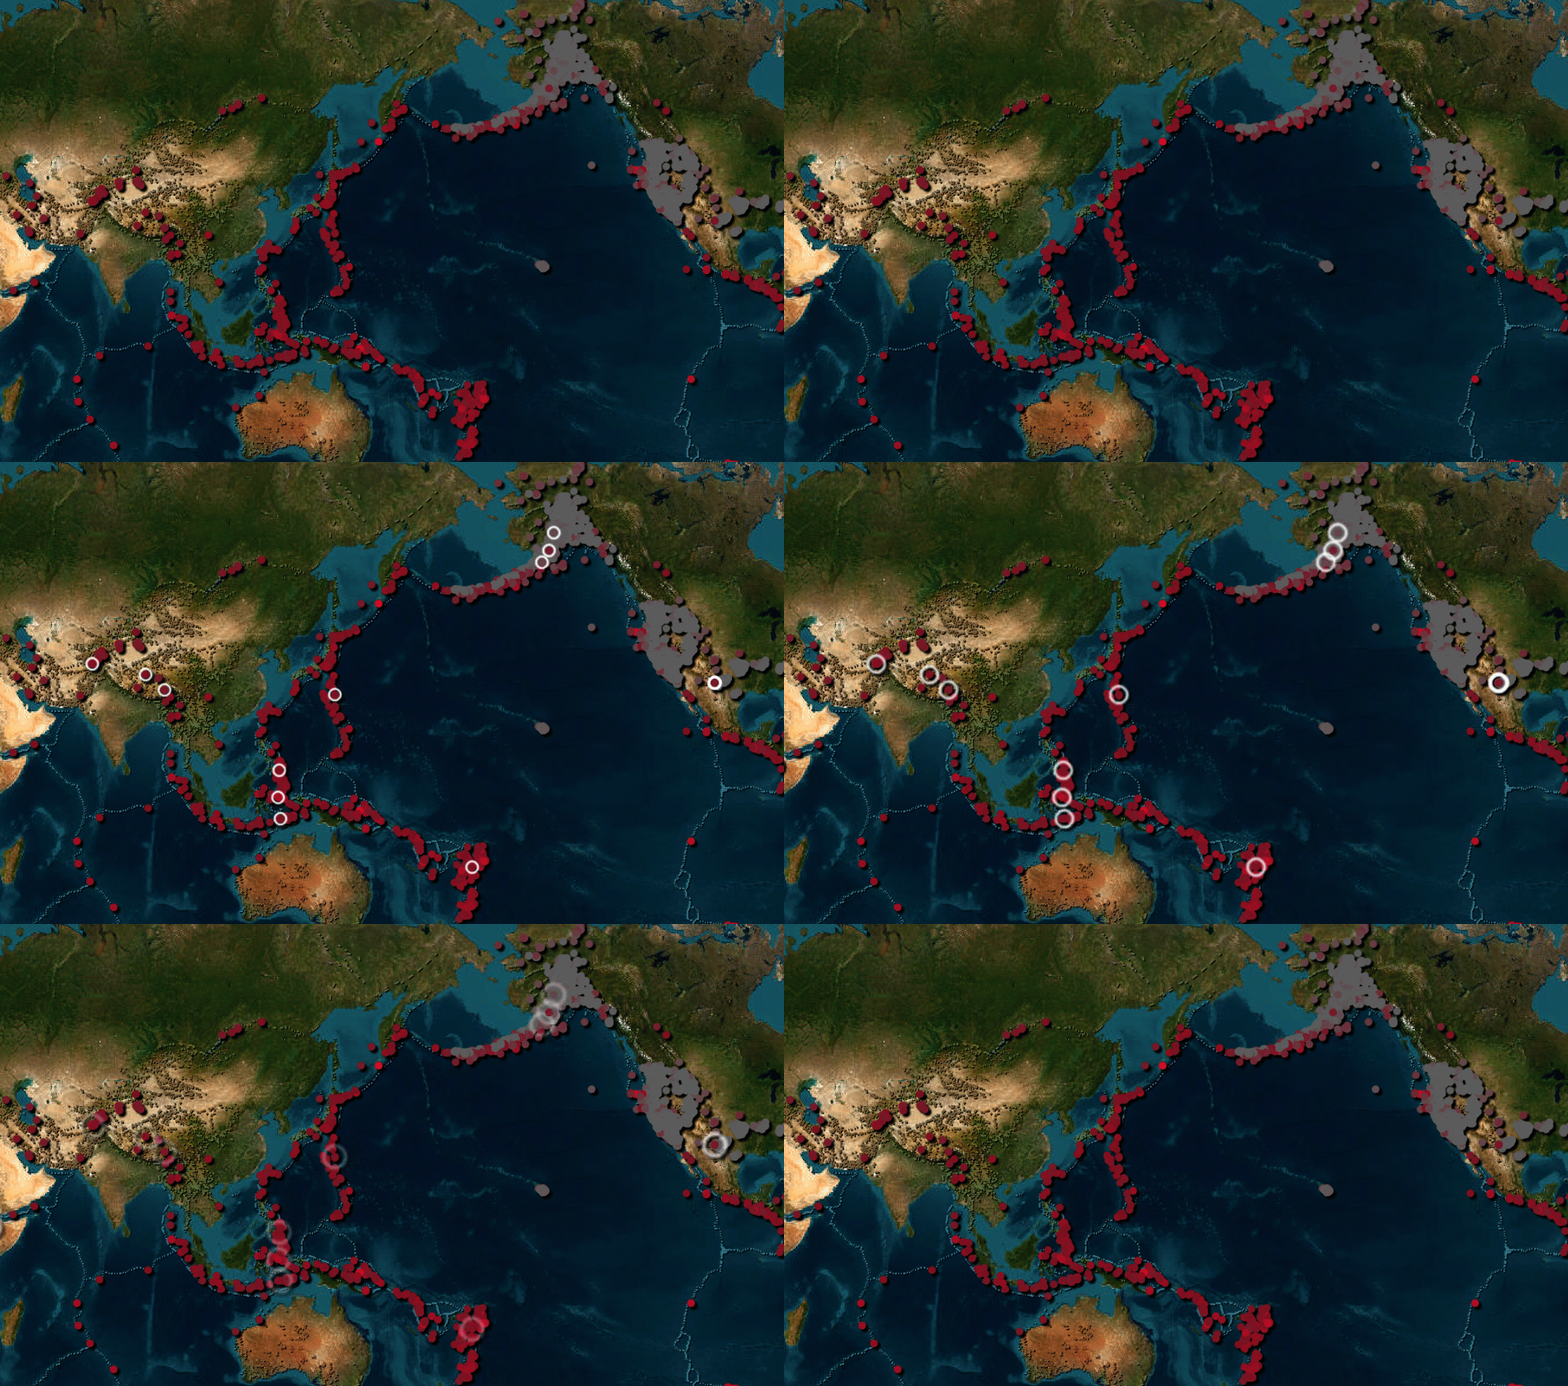
Draw attention to features with the new symbol animations using CIM symbol. Symbol animations allow you to accentuate features by animating a point or marker’s color, offset, rotation, size, or transparency.

Animations can be used to highlight the freshness of data, draw attention to specific features, or just create an engaging visualization in your 2D map.
Icon rotation in 3D
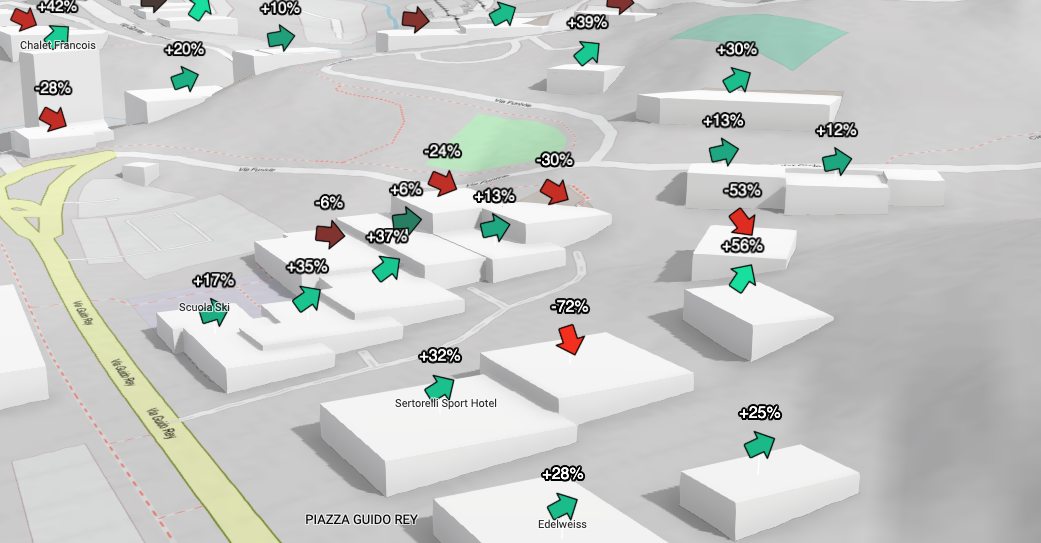
Enhance 3D thematic visualizations with the ability to rotate 2D billboarded icons within a 3D scene view. This is particularly helpful to show directional data such as wind direction at weather stations.
What’s new with components
We expanded the SDK’s component offerings with new components, enhancements, and improved documentation. Standards-based web components introduce a new way to build web apps for maximizing productivity and is the recommended pattern for all new apps.
Embeddable components: We introduced the embedded map component for quickly embedding a saved web map into a website seamlessly with default components (i.e. zoom, legend, bookmarks) pre-configured. By setting the properties and/or attributes in HTML, developers can easily change the web map, UI components, and theme with no JavaScript required. The example below shows how to include a trail web map with embedded map component.
<arcgis-embedded-map
    item-id="ceb8954a5f2c457284c5074efd5a5ca0" heading-enabled legend-enabled
    theme="dark" information-enabled style="height:300px;">
</arcgis-embedded-map>
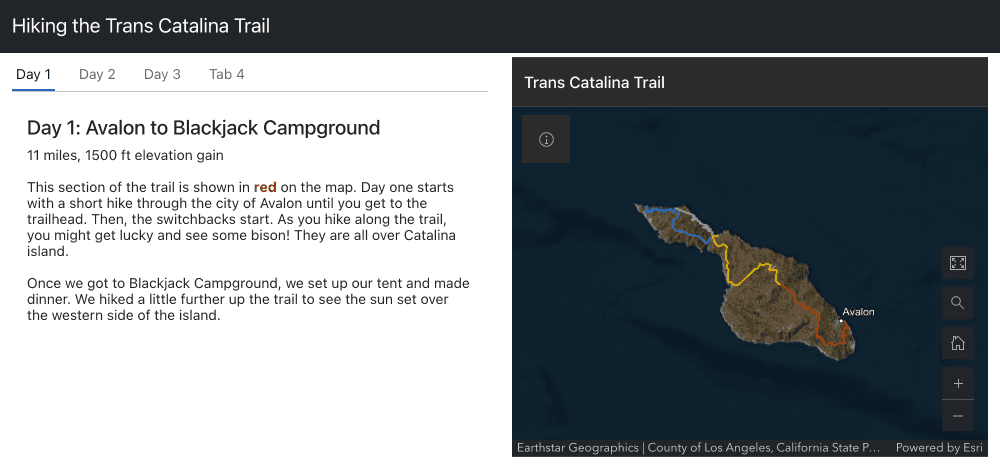
Embedded map component empowers developers to include interactive web map easily in non-map-centered websites for more geographical context.
New map components: We added four new components to the map components package: Feature Table, Swipe, Catalog Layer List, and Oriented Imagery Viewer
Use components without a view: You can now use components that are not <arcgis-map> or <arcgis-scene> without a view, such as using Feature Table as a standalone table for data exploration and Search for interactive geocoding.
We also added better support for charts components and charts model (beta) and made significant updates to our guides, tutorials and samples to use components in your applications.
Visible area in 2D and 3D
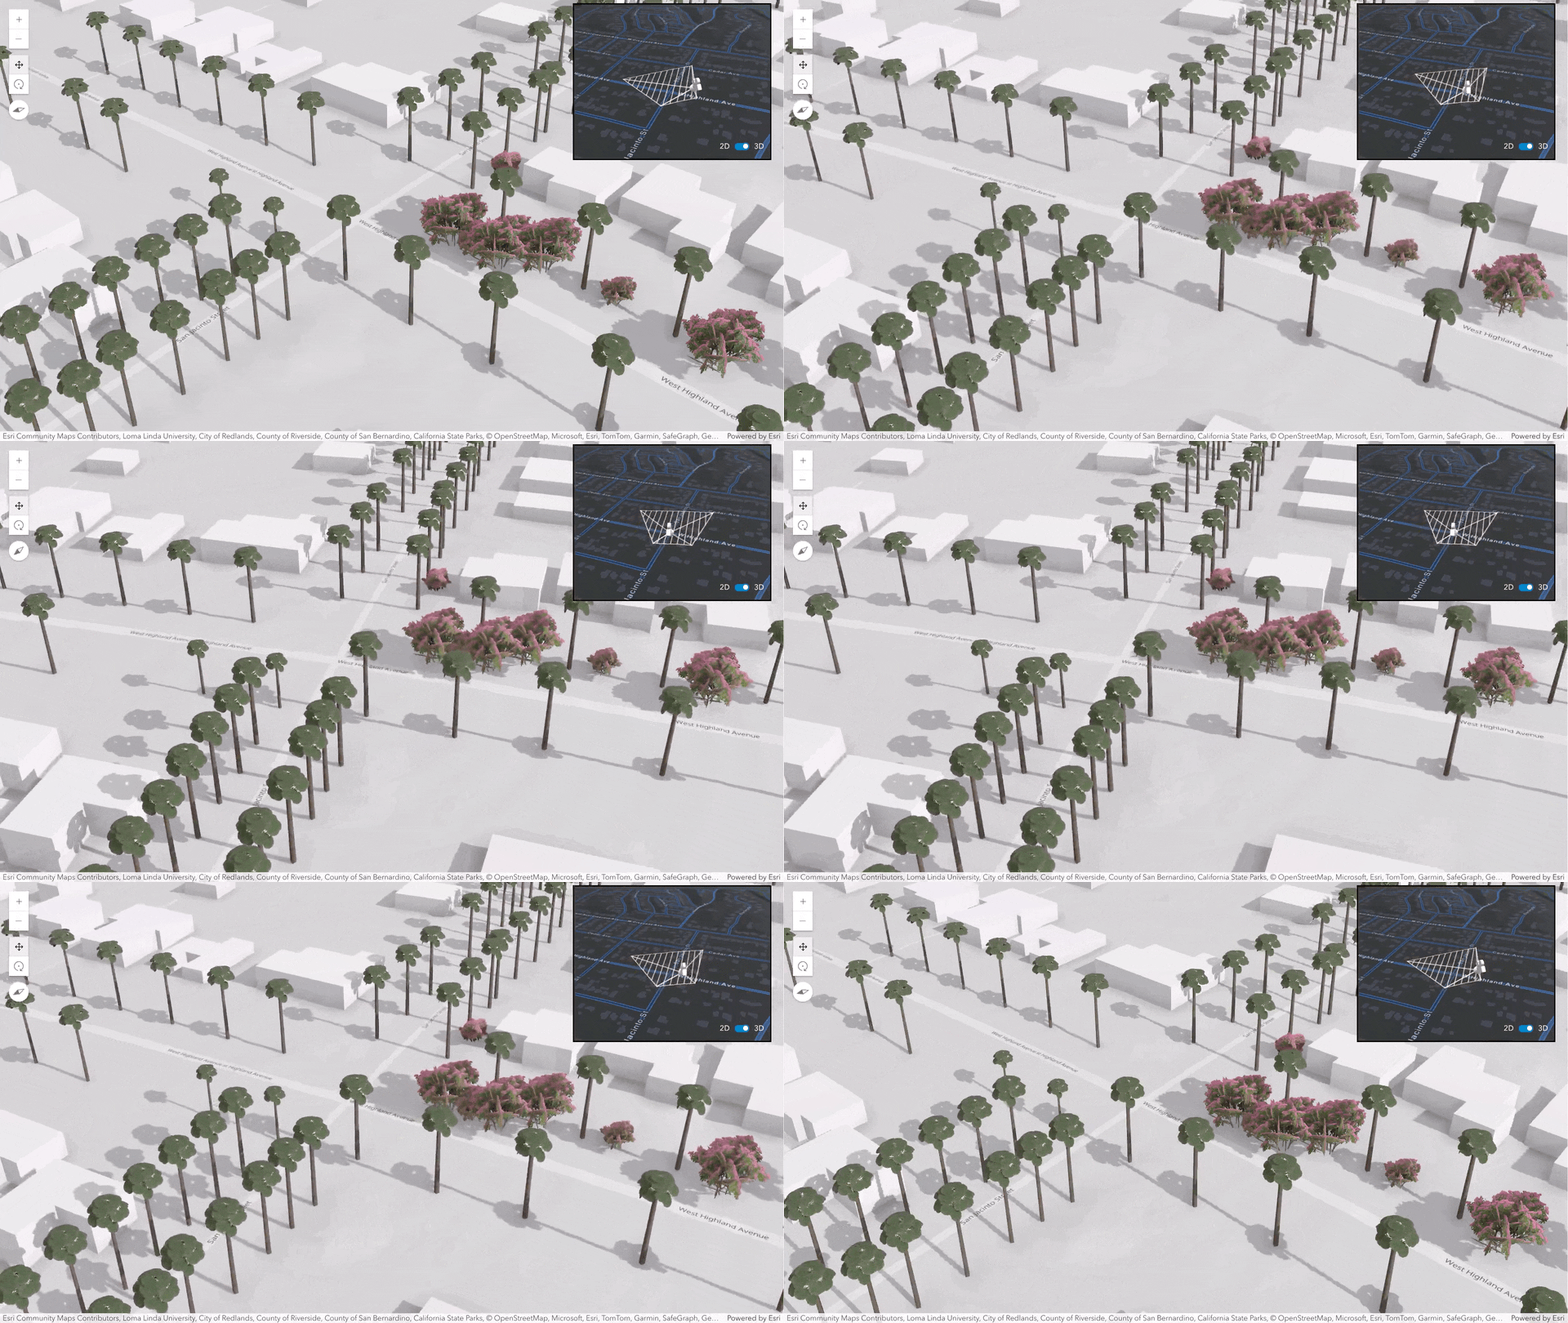
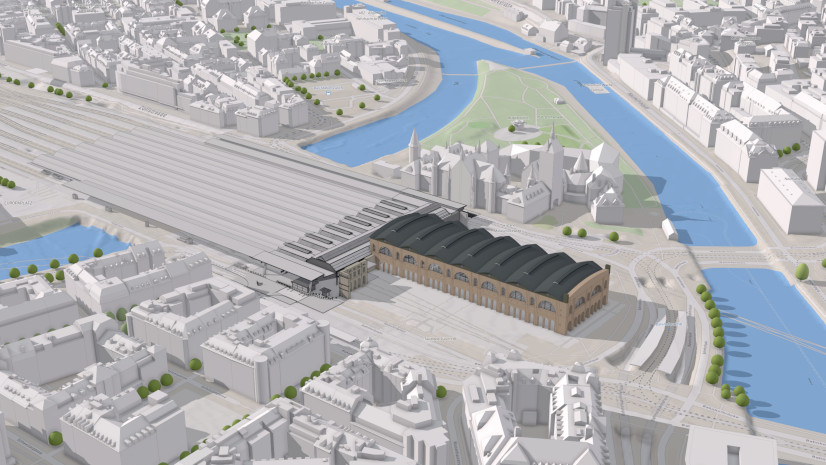
You can access the currently visible area in map view and scene view as a polygon with the new visibleArea property. This is more precise than view extent, enabling more accurate spatially querying and filtering and clearer visual indication of the area currently visible to the user.
Interactive field of view controls
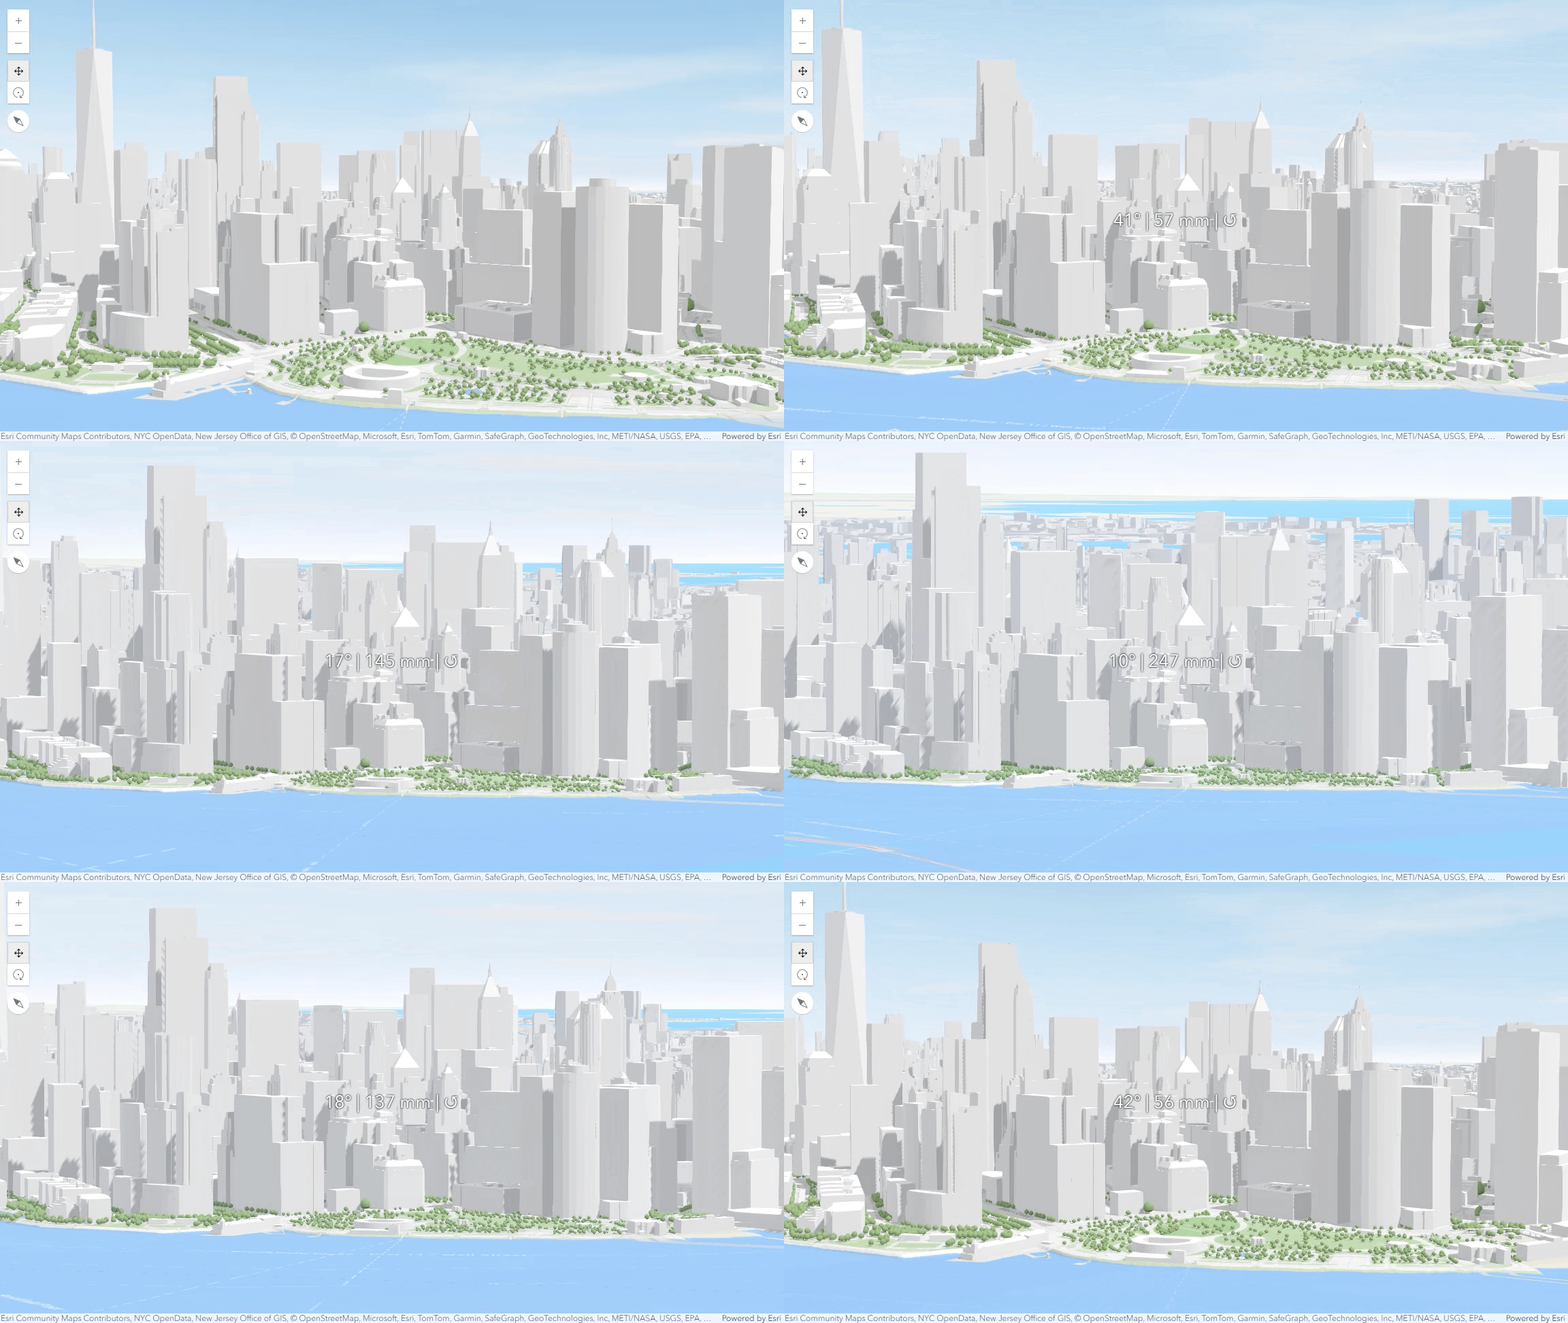
Apply telephoto or wide-angle views to explore and present your 3D content in a different perspective. New interactive controls allow you to change the camera field of view (FoV) – or focal length – in any 3D web app, including Scene Viewer.
Geometry operators (beta)
Geometry operators provide a variety of capabilities for performing client-side functions for testing, measuring, and analyzing spatial relationships between two or more 2D geometries. Geometry operators lay the foundation for next-generation client-side analysis and visualization in the future and will be an eventual replacement for the geometry engine.
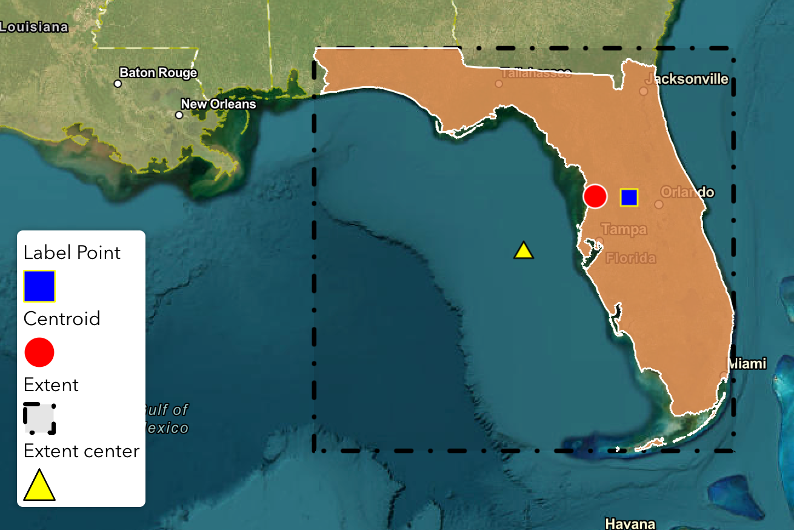
The geometry operators provide new capabilities including transformations like scale, shear, and shift, as well as operators for determining geodetic distance, geodesic proximity, and centroids. Refer to the introduction to geometry operators guide page for a detailed overview of the operators.
Learn more about 4.31!
Besides what’s highlighted above, this release also welcomes link chart support for knowledge graph data, ability to share and present your viewshed analysis in scene, viewing utility network associations in popups, and more! Visit our release note for more information.
Join our livestream on December 3rd at 9am PT to see our 4.31 release highlights in action and get your questions answered with our product team!

Article Discussion: