The ArcGIS Enterprise 11.4 release brings exciting new storytelling features and enhancements to ArcGIS StoryMaps. You can now promote consistent storytelling with templates, share collection items on a map, present briefings with image gallery, code, and table blocks in full screen, and so much more.
Read on to learn about the update and how it can help you elevate your storytelling!
- Create templates to share storytelling patterns (beta)
- Enhance accessibility by adding closed captions to uploaded videos
- Hide the story cover
- Create media action text links
- Use an image as the base layer for an express map (beta)
- Add videos to express map pop-ups
- Choose to keep pop-ups open
- Display tooltips on Map tour locations
- Add the image gallery, code, and table blocks
- Collect metrics for briefings using Google or Adobe Analytics

Storytelling
Create templates (beta) to share storytelling patterns
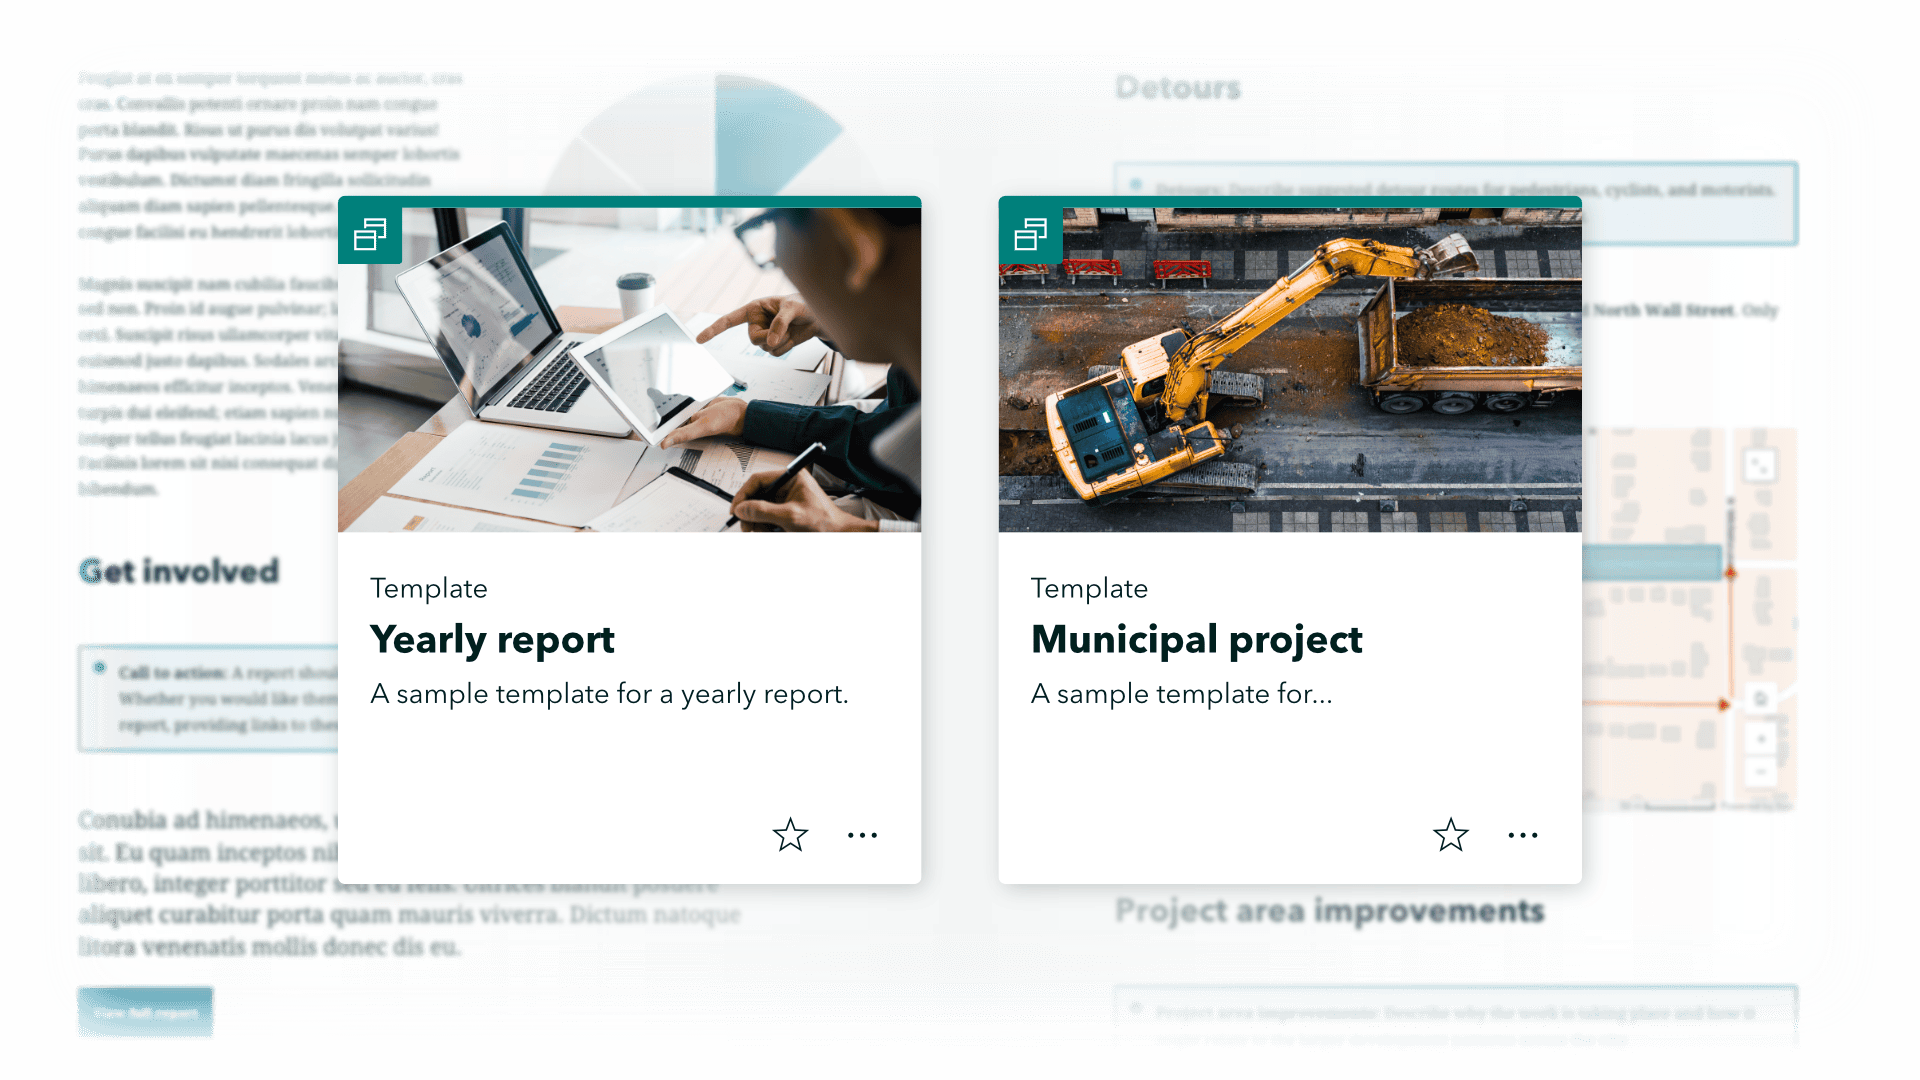
ArcGIS StoryMaps serves as a powerful communication tool across various industries, and as a result, there is a demand for story templates. So, we are thrilled to introduce templates in the ArcGIS Enterprise 11.4 release of ArcGIS StoryMaps!
Whether you want to provide instructions for your students to complete an assignment or save time scaling your organizational story production with consistent messaging and branding, templates are a way to create a story structure that others can follow and recreate easily.
Please note that templates are only available to ArcGIS Enterprise 11.4 organizations that have beta features enabled.

Closed captions for uploaded videos
To make ArcGIS StoryMaps more accessible, we have enabled the ability to include closed captions on uploaded videos.
After uploading a video to your story, go to the Video options menu to access the new Accessibility tab and upload closed captions by adding a .vtt file. Once the file is uploaded, use the viewer controls (dependent upon web browser) to turn on captions.
Learn more about closed captions and the .vtt file type in this Esri Community post, or learn more about getting started with accessible storytelling in general.
Hide story cover
We are excited to announce a new option in the story settings that allows you to hide the cover of a story! While this functionality has been available in specific situations, such as when adding a story to a collection or embedding it on another website, many users have expressed a desire for a more effective and streamlined method to accomplish this.
The new setting will allow you to hide important details about your story from viewers. When this option is used, information can be hidden, preventing the story from appearing in web search results, so you will see that option disabled when you publish. This feature is especially useful for demonstrations or kiosks at exhibits.
Add media action links to text selections
Media actions allow users to create buttons that readers can click on to display different pieces of media in the sidecar block. Now, in addition to creating media action buttons, you can also configure media actions on text selections in your story. This gives you another option for creating interactive elements that are more compact and appear inline in a story paragraph.
Check out this video to see link-style media actions…in action.
If you want to learn more about media actions, see Supercharge your stories with media actions.

Mapping
Upload image for express map base layer (beta)
Until now, the express map builder solely offered a broad selection of basemaps and web maps to build upon using a variety of tools that can add interactivity to your map. However, with this update, you can now opt to use an image as a base layer in the express map builder. This enables you to utilize the same drawing, annotation, and dynamic map tools, plus other storytelling devices like media actions, to apply interactivity to images.
Whether you are looking to guide your reader through a photo, provide further information through pop-ups, or use annotations for clarification, we’re excited to see how you utilize this enhancement in your stories and briefings!
Get inspired and learn more about map-based images here.
Express map image base layers are in beta and only available to ArcGIS Enterprise 11.4 organizations that have beta features enabled. Please let us know on the Esri Community if you find any issues or have feedback.
Add videos to express map pop-ups
Express maps can now provide you with a unique and efficient way to create maps for stories or briefings. With this capability, authors can elevate their express maps by adding videos to the pop-ups, enhancing the interactive experience for readers.
Choose to keep pop-ups open
To help you direct your readers’ attention to a particular feature in a map, an option to choose whether to keep pop-ups open in a web map or scene has been added to the map configuration options in the ArcGIS StoryMaps builder. Please note that this applies to maps with feature layers or map image layers. If you’d like to use this with other layer types, drop us a note on the Esri Community to let us know how else you’d like to use this capability.
Tooltips for Map tour locations
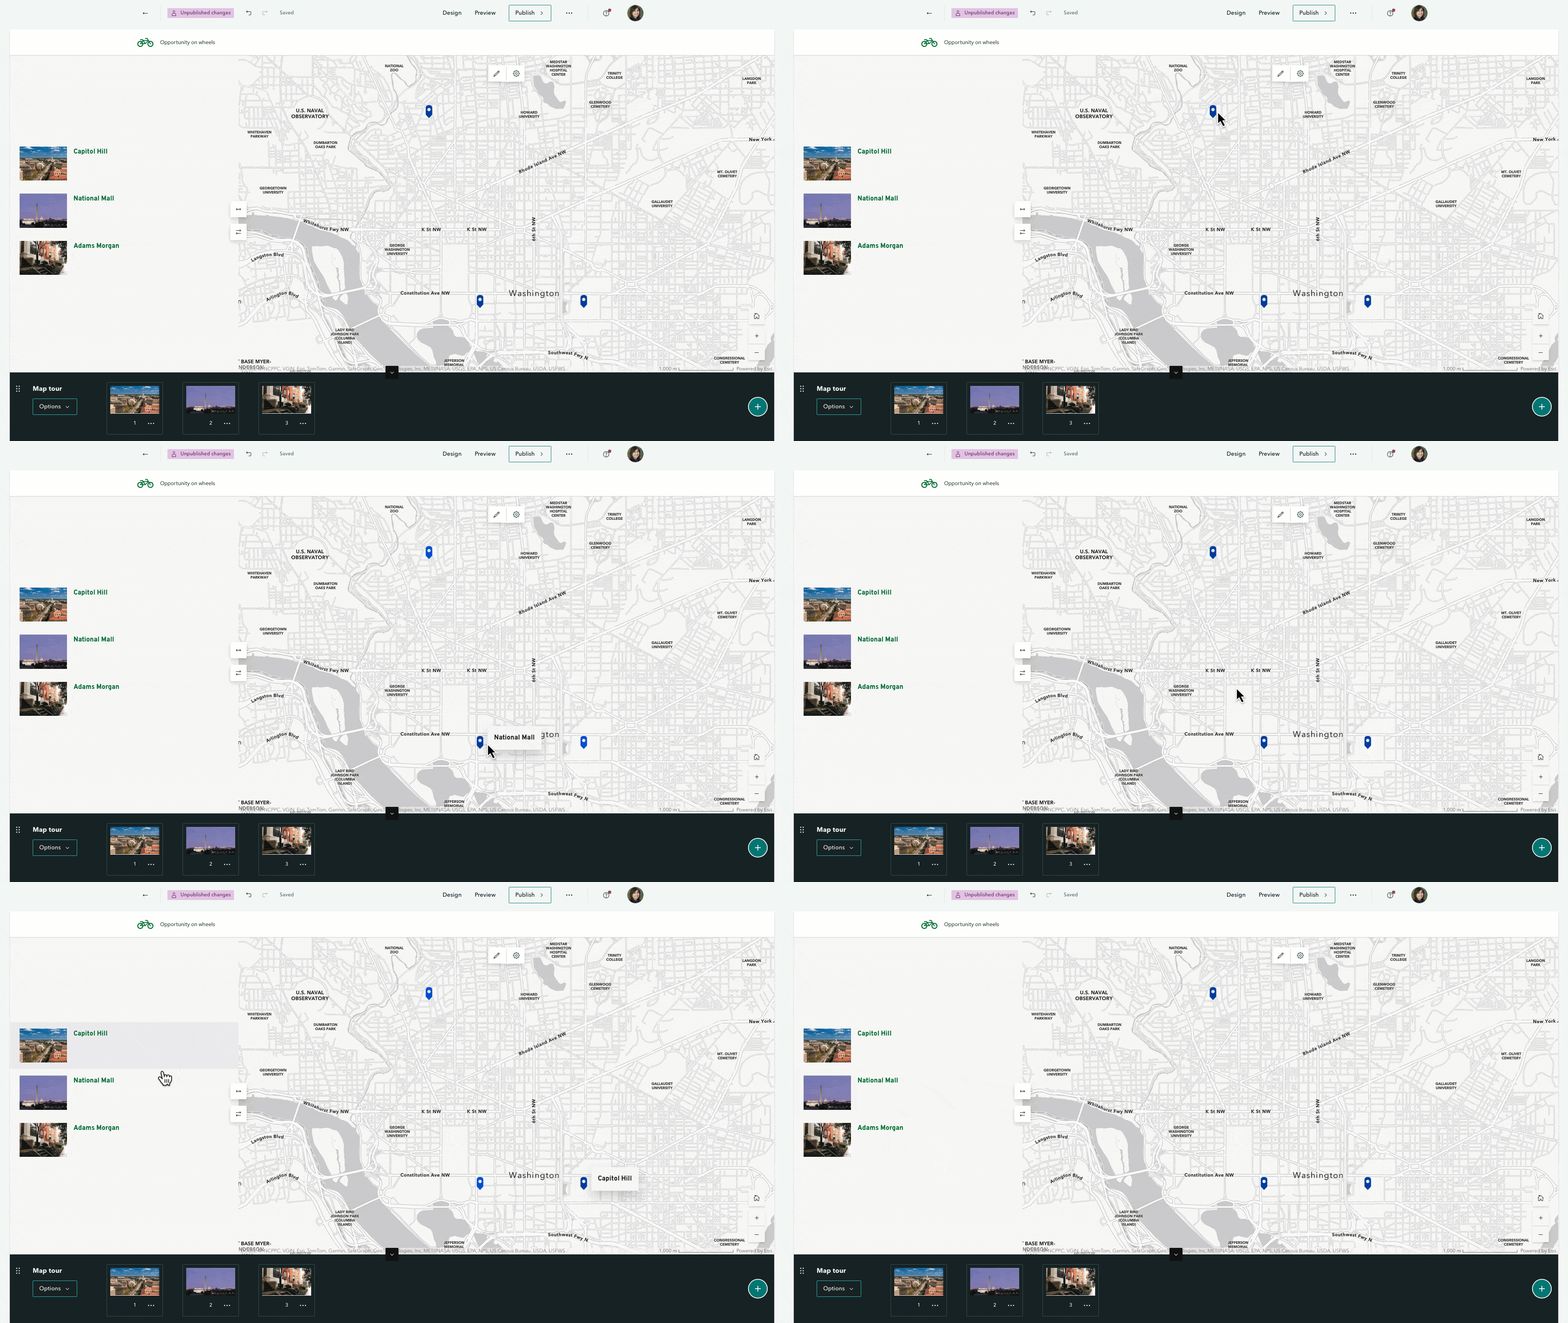
Map tours are a favorite immersive block that seamlessly combines maps, media, and text to help guide readers through your story. We have added tooltips to more easily associate the places in the side panel with their corresponding map points and vice versa.
Now, when you hover over tour points in the side panel, the tint of the corresponding map point will change. And when you hover over a map point, the place name assigned in the side panel will appear near that map point. These visual cues make it easier to find a location or to decide where to go to next in the tour.


Briefings
Add image gallery, code, and table blocks
Image gallery
Image galleries enable you to showcase a mosaic of images in your stories, and now the gallery option is available when adding content to briefing slides. You can choose to set each gallery image to fit or fill, depending on your preference.
Do not forget to include attribution and alternative text to credit your images and improve the accessibility of your briefing. Managing images within a gallery—adding, removing, and rearranging—functions the same way as in stories, and readers can click on the images to expand them (unless a link is configured on the image, in which case clicking it will open the link).
Tables and code
The ability to add tables to a story was added back in August 2023, which happened to be the same time that briefings was released in beta. These features have now come together and you’re able to add nicely formatted tabular information to your briefings.
It’s extremely useful to be able to summarize statistical data for an audience in a table or provide a status update in an easily digestible form. Check out this video see how easy it is to create a table.
Collect briefing metrics using Google or Adobe Analytics
You may be familiar with using Google Analytics or Adobe Analytics to track audience engagement with your stories. Now you can use these services to track views and other reader interactions for your published briefings as well.
The process for setting this up for a briefing is similar to how it works for a story. You’ll find a familiar looking Analytics tab in the Briefing settings where you can choose the analytics service you’d like to use and enter your configuration information.
For more information on tracking audience engagement, see Use web analytics to measure your traffic in ArcGIS StoryMaps (esri.com).

Collections
Collection items on map (beta)
Collections are an excellent way to unite related items in one place for a cohesive viewing experience. Now, you can choose to Show map under your cover options in the Design tab.
Enabling this option displays a map alongside your collection items while maintaining your cover layout. You can assign locations to each item, creating clickable points on the map that link directly to them. Additionally, you can customize the map’s appearance, switch between 2D and 3D views, select a basemap, and allow viewers to jump to their current location on mobile devices.
Please note that sharing collections items on a map is only available to ArcGIS Enterprise 11.4 organizations that have beta features enabled.
Check out this Growing Green Cities collection to see a cover map in action:
Date on collection covers
Showing a date on the cover was something you have been able to do for stories and briefings, and now this is available for collections. Just hop into the Collection settings and select the date display option you’d like and the date will be visible to your readers.

And more…
The ArcGIS StoryMaps update on ArcGIS Enterprise 11.4 also brings the following enhancements:
- Easily undo or redo a change when editing a briefing from the ArcGIS StoryMaps builder.
- Double-click the header when viewing a briefing to switch to full screen.
- Briefings have an improved layout and are easier to navigate when viewed in portrait orientation on a phone.
- Add videos to express map pop-ups
- Express map pins have an added border color to improve visibility.
- Create a theme from one of the professionally designed standard themes in the theme builder and modify it to suit your needs.
- Enable a time animation widget on 3D scenes from the map options menu in ArcGIS StoryMaps that inherits the properties set in Scene Viewer.
For a complete list of changes and fixes in this ArcGIS StoryMaps release, view the Release notes.
We’re excited for you to explore these updates and integrate them into your projects for more impactful narratives with ArcGIS StoryMaps.
Article Discussion: