Introduction
Starting this release, you can now open tabs for Tables, Charts, Models, Raster Function Templates, and Analysis Histories. Alongside the new tabbed experience, the time and multi-dimensional sliders underwent recent updates. With these enhancements, you can seamlessly move between working with tools like tables and charts all while maintaining your workspace. This post will go over how to open and manage tabs in ArcGIS online as well as outline the changes to the time and multi-dimensional sliders.
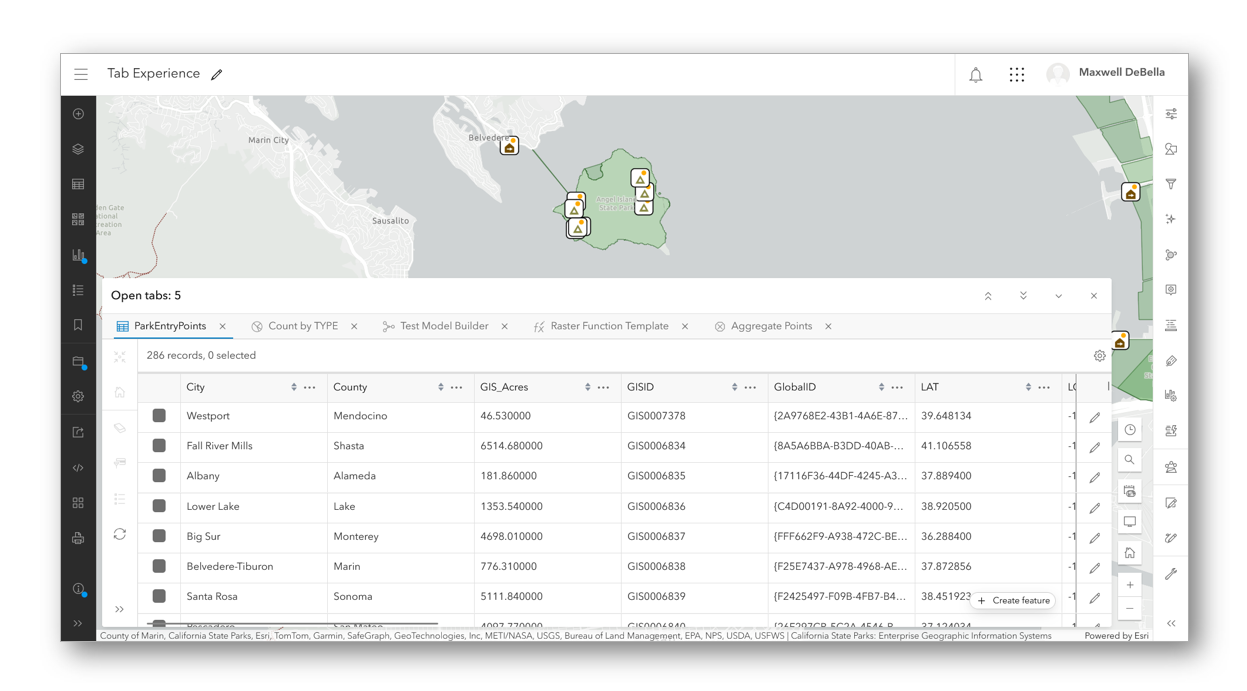
Below is a list of everything that can be opened as a tab.
Opening tabs
Table
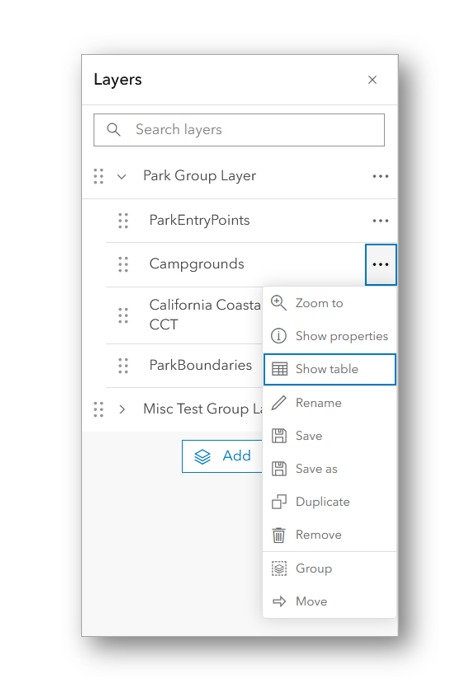
To open a table, click on a feature layer in the Layers pane, then select Show table on the layer action drop down. Table layers will automatically open as a tab when added to a web map. You can open multiple tables and freely switch between them. This makes comparing data between layers more effortless.
Charts
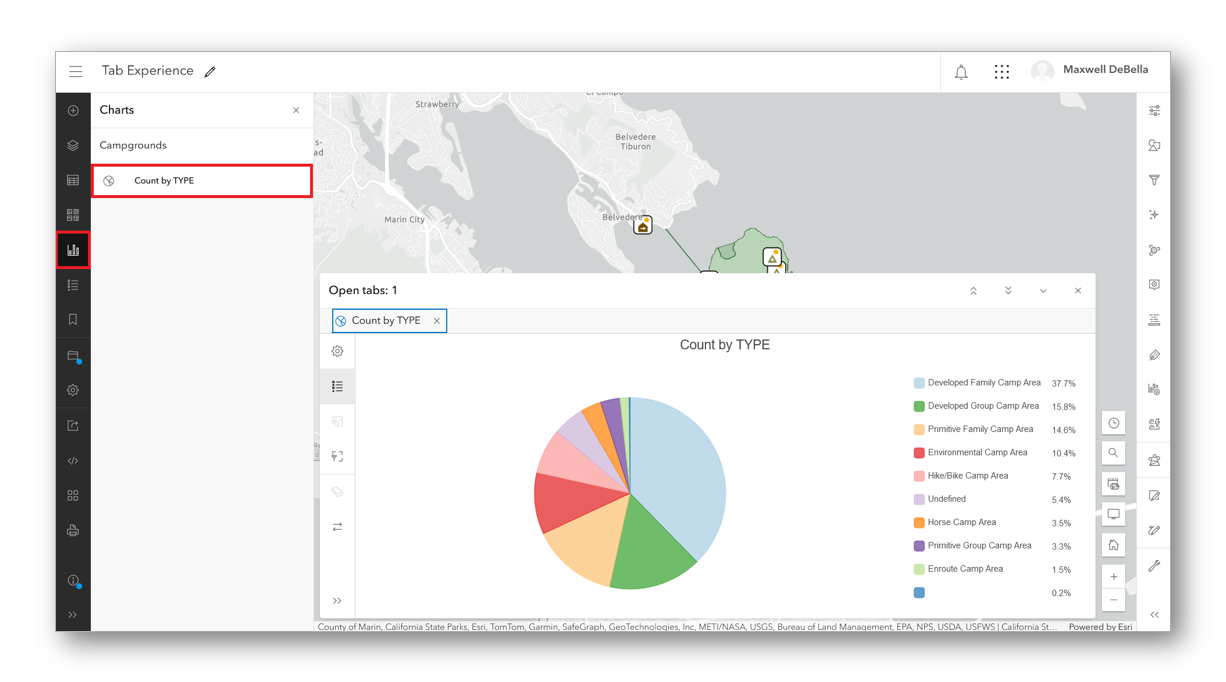
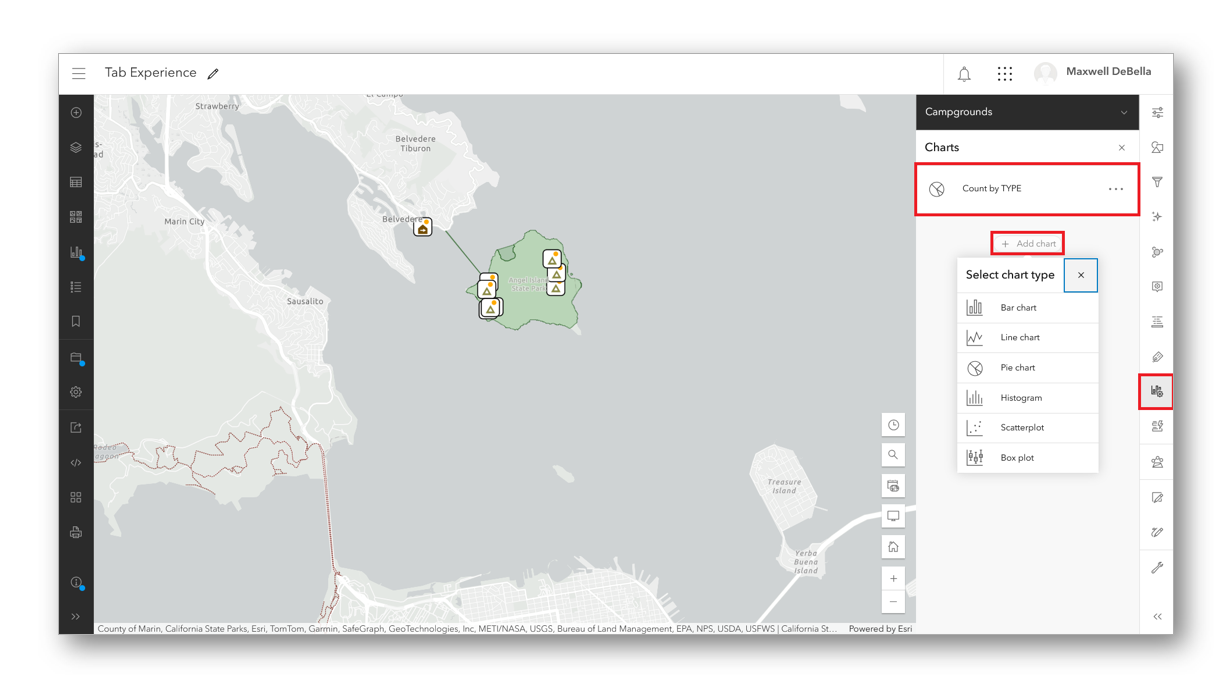
For charts, simply select a layer, then click the Charts button on the right toolbar to create a new chart. The new chart will be added as a tab. To open an existing chart, select Charts on the left toolbar and click the chart to add it as a tab. Charts can only occupy a single tab at a time. Having multiple charts open simultaneously will be available Spring 2025. Using the new tabbed experience, you are free to move between designing a chart and preforming other actions in your map.
Analysis
For analysis-based tools, open the Analysis pane by clicking on the Analysis button on the right tool bar. To use both Model Builder (Beta) and Raster Function Templates, you must have a Professional or a Professional Plus user type.
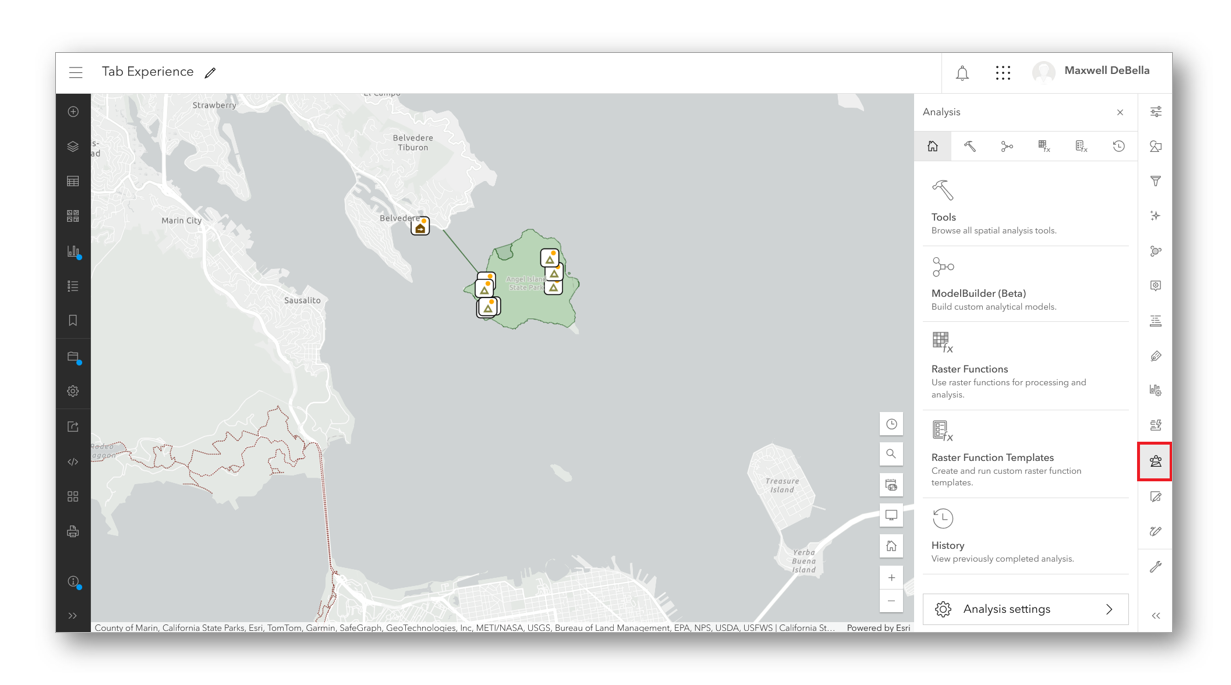
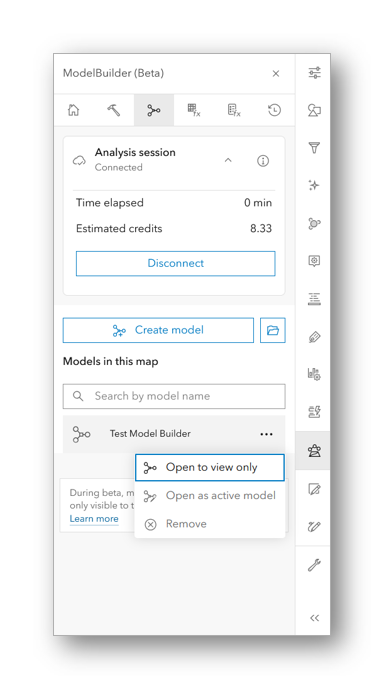
To open Model Builder (Beta), click Model Builder in the Analysis pane. You will see the option to connect to a session. Starting a session is required to perform any actions beyond viewing the model. Only one model can be active at a time. While an active model is running, you can continue to preform tasks, such as editing your data, styling a layer, or designing a chart.
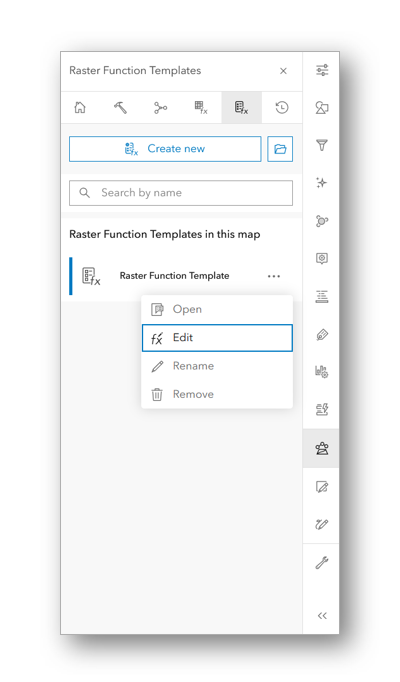
To open the Raster Function Templates, click Raster Function Templates on the Analysis pane. This will open a list of templates; click the options icon next to the desired template and then select Edit. To create a new template, click Create new. The new template will be automatically opened as a new tab. Similar to working with models, you can open multiple raster function templates as tabs. Templates can be processed in the background, allowing you to work on other tasks in your map.
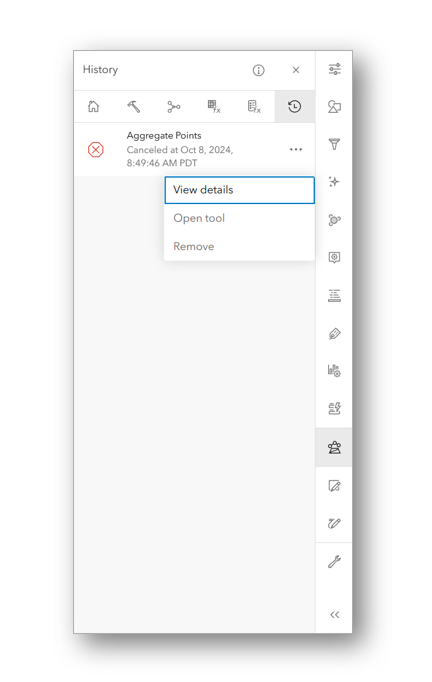
To view a previous Analysis job, click History and View details to open it as a tab. With this update, you can now compare previous analysis jobs to easily replicate tasks as well as investigate any possible failures with specific analysis jobs.
Managing Tabs
Now that you know how to add tabs to the Map Viewer, let’s review how to manage tabs.
The panel that sits in the center of the map has undergone adjustments to handle the tabbed experience. There is now a header which contains a count of all the tabs opened.
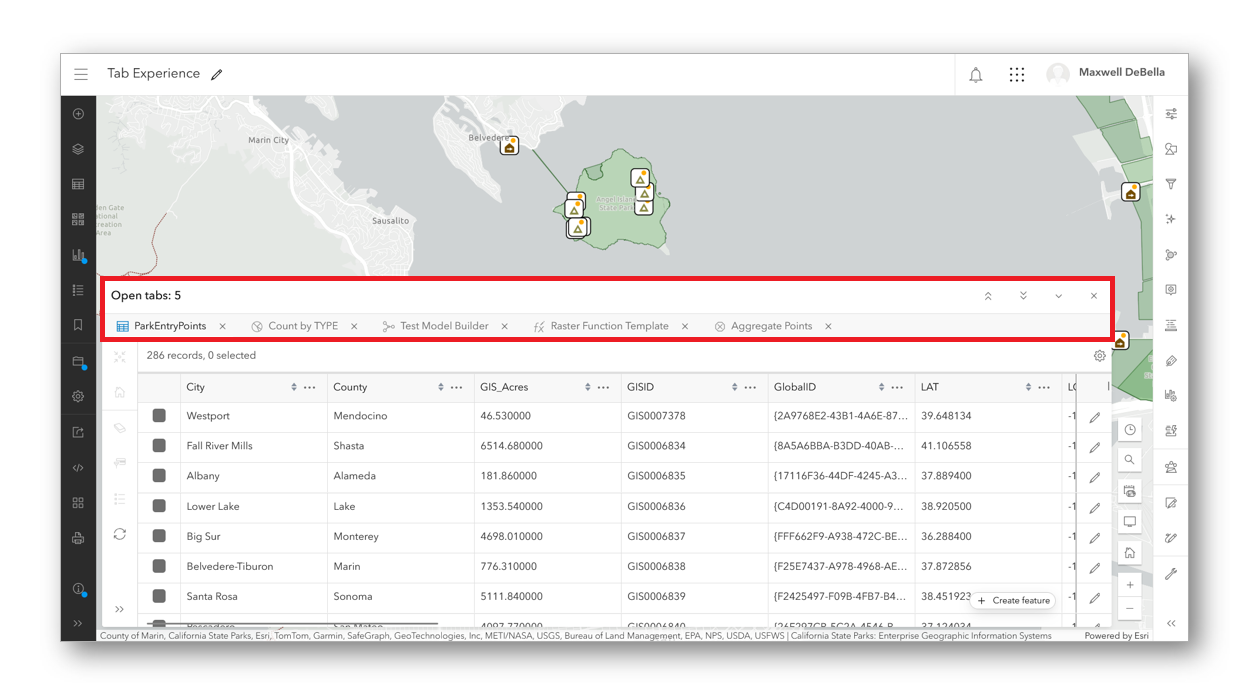
To the right of the header, there are double chevrons and a single chevron. The double chevron pointing up can be used to increase the height of the panel, whereas the double chevron facing down decreases the height. There are three height options: small, medium, and large. You can completely minimize the tab interface with the single chevron facing down and restore it to its previous height with the single chevron facing up. This experience is great for alternating between viewing the map alongside your tabs, expanding your tabs to the fullest extent, and/or fully minimizing your tabs to get a bigger picture of your map.
Each tab has a unique icon denoting its type. If the number of tabs open exceeds the length of the tab header, you can cycle through tabs with the left and right chevrons. You can close individual tabs by clicking the X on the tab. To close all tabs, click the X on the center-panel’s main header. If there are any unsaved changes to a Raster Function Template and or a model you will be prompted to save, discard, or go back. Relying on a tab’s icon is useful for locating a particular tab. Closing individual tabs that are no longer needed will help to de-clutter your workspace.
Enhancements to Time and Multi-Dimensional Sliders
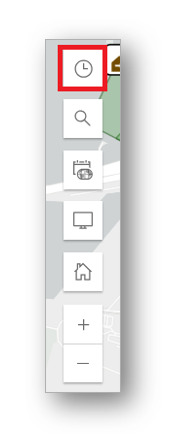
The time slider and the multi-dimensional slider have also seen recent changes. Before this release, the sliders and the center-panel could not be open at the same time. Now, the sliders exist together with the center-panel. The button to access the time slider has been moved from the right toolbar to the map tools. If you have a time enabled layer present in the web map, you will see the new button above the Search tool on the map view. For those familiar with the previous experience, you no longer need to worry about time being an exclusive tool on the map. This makes working with both sliders and other tools at the same time a reality for this release. The time slider will now only be dismissed if you click the button to close it.
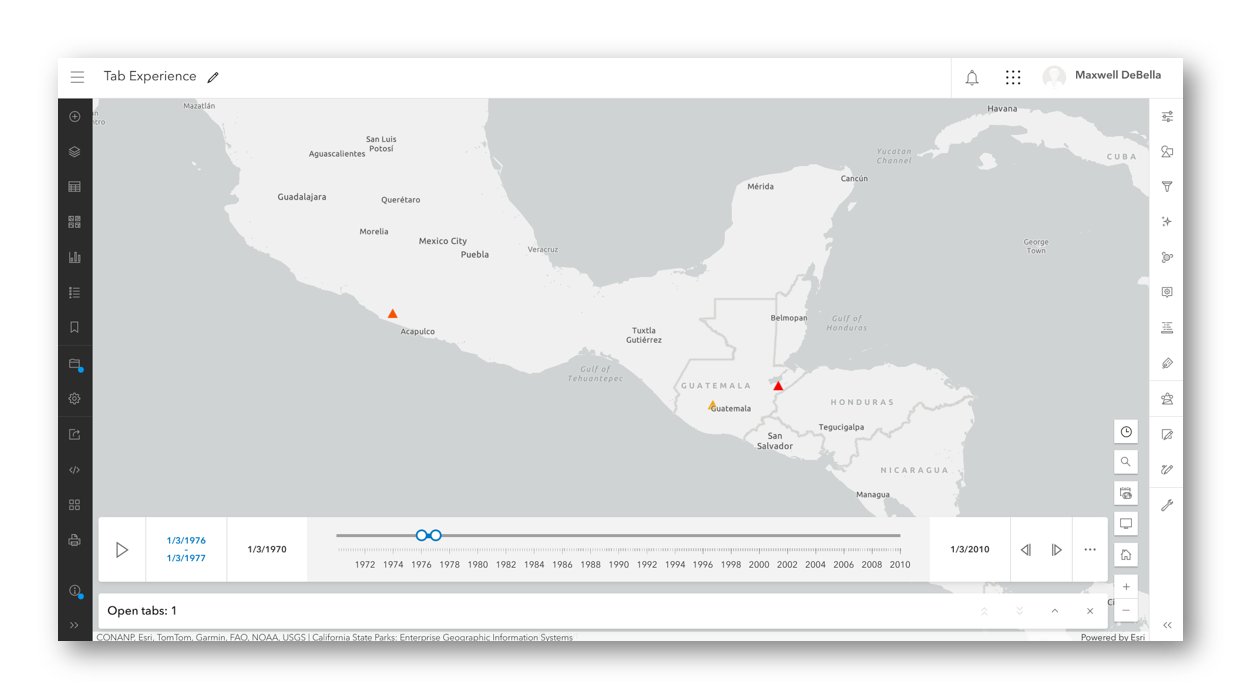
The new tabbed experience in Map Viewer introduces a more seamless experience with working with your data. Designing advanced and informative maps just got that much easier. We hope you enjoy these enhancements to Map Viewer. For more information on the Fall 2024 release, please check out the What’s New Blog. Happy mapping!
Commenting is not enabled for this article.