Sometimes what you need is not a map, but a number. Especially in order to answer a question for decisionmakers. Lots of decision support involves answering questions around median household income. Many analysts use it to gauge the overall economic conditions of an area. The median household income is a key economic indicator that represents the income level at which half of households earn more and half earn less. To calculate the median household income, all household incomes are sorted from smallest to largest, and the middle value is the median.
It yields a better representation of the typical income in an area compared to the mean (average) income, which can be skewed by extremely high incomes. In fact, the median household income in the United States in 2023 was $77,719, compared to the mean household income of $109,160, according to the Census Bureau’s 2023 1-year estimates. Very high-income households are skewing the mean higher than the median by more than $30,000 dollars.
Unfortunately medians are some of the trickiest statistics to adjust and recalculate. The median is not a value that can be summed or aggregated. Rather, you need to work with a distribution.
ArcGIS Living Atlas has maps and data layers of household income, as well as breakdowns by age of householder and race of householder. In this blog, we’ll examine two real-life customer questions about deriving and approximating estimates based on median household income from ranges.
How do I find the number of households making 80% or less of my state’s median household income?
This question came to us from a state agency in Rhode Island. We’ll use Rhode Island as the worked example below. To derive the answer to this, we will using both the median household income and household income distribution layers.
Step 1. Fetch the median household income (B19049_001E) for Rhode Island from the state layer of median household income: $81,370 as of the 2018-2022 5-year estimates.
Step 2. Multiply by 0.8 since you’re interested in 80% of this income level: $65,096.
Step 3. Use the income distribution layer to add up the following fields:
B19001_002E + //under 10k
B19001_003E + //10k – 14,999
B19001_004E + //15k – 19,999
B19001_005E + //20k – 24,999
B19001_006E + //25k – 29,999
B19001_007E + //30k – 34,999
B19001_008E + //35k – 39,999
B19001_009E + //40k – 44,999
B19001_010E + //45k – 49,999
B19001_011E + //50k – 59,999
(B19001_012E) * (65,096 – 60,000) / (74,999-60,000) //60k – 74,999 * (.34)
You now have an estimate of the count of households earning a moderate income (often defined as 80% of Area Median Income) or below in Rhode Island: (176,546 households as of the 2018-2022 5-year estimates). Divide this by total households in the Household Income Distribution layer and multiply by 100 to get the percentage.
You could do the same procedure for a county’s median household income. If you’re using the metro area’s median income, then you’d need to first pull the metro-level data from data.census.gov in order to find out what the 80% the metro’s area median income is that you’re working with, and follow the same procedure. (Note: For state, metro, and large counties, decide if the 1-year estimates or the 5-year estimates are best for your purposes. Only the 5-year estimates are available as feature layers in ArcGIS Living Atlas.)
In your web map, you can present these two numbers in the state’s pop-up by adding them as Arcade Expressions. You can configure your application to show this number as an indicator on a dashboard.
How do I find the median household income for a group of tracts?
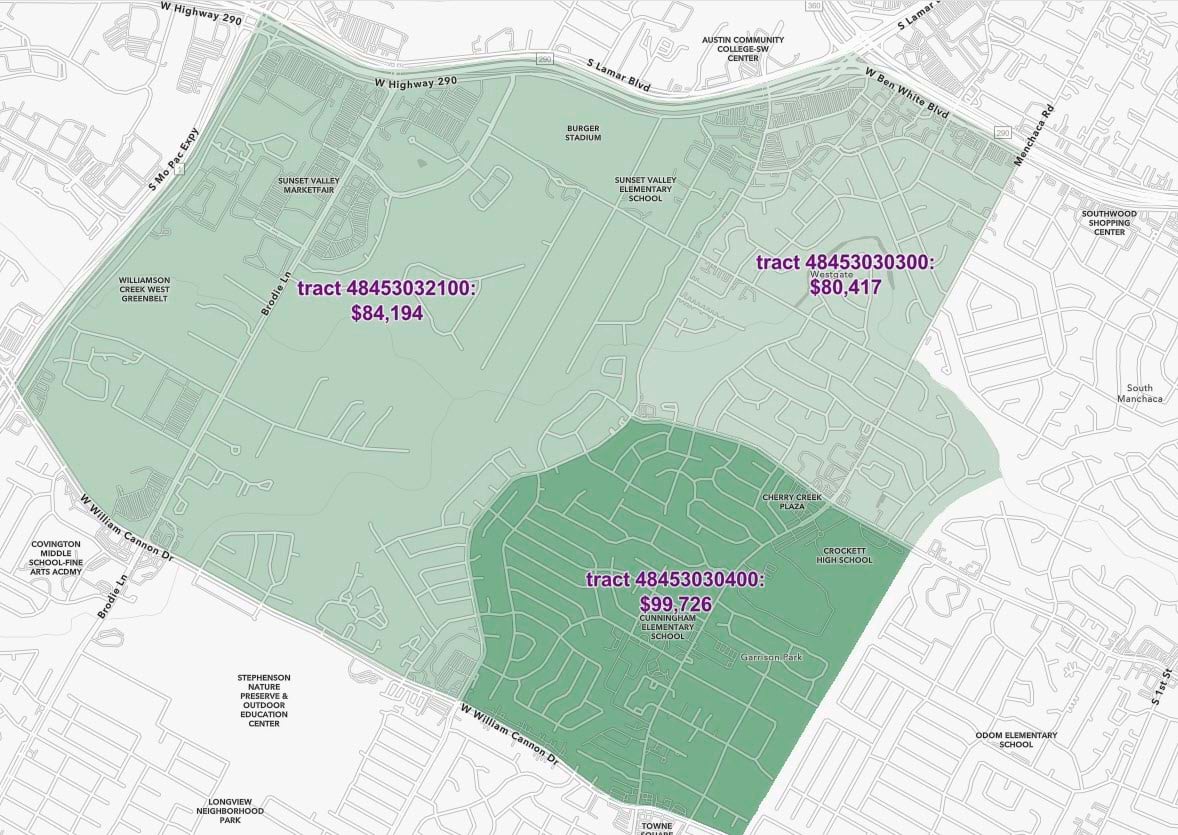
For this example, let’s look at three tracts in Austin, Texas. Their median household incomes are $80,417; $84,194; and $99,726.

We’ll use the Household Income Distribution layer again, which has detailed ranges of income levels.
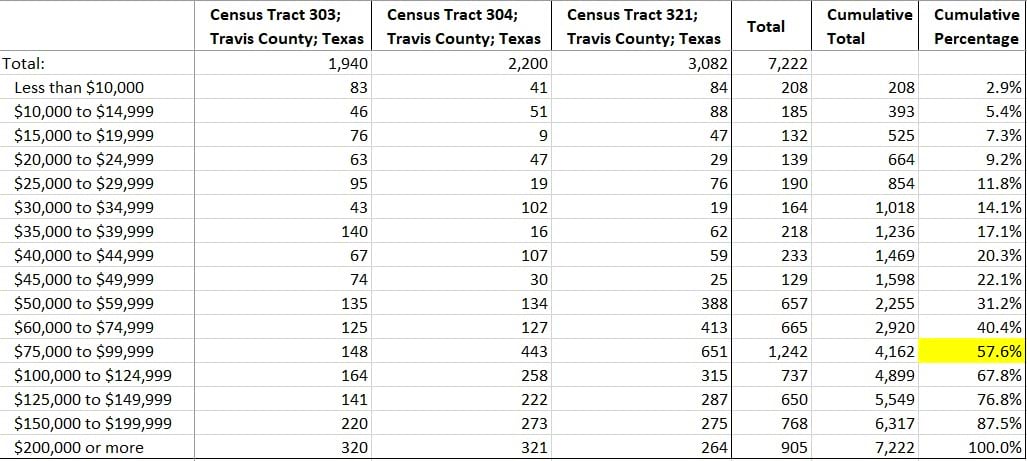
Step 1: We’ll add all three tracts together, as well as create columns for the cumulative total and a cumulative percent. When the cumulative percent crosses 50%, that’s the range that we know the median is in.

Step 2: Determine the midpoint of the total number of households.
7,222 / 2 = 3,611 //total households divided by 2
If we were to line up all those households in a row from lowest household income to highest, the household in spot 3,611 would have the median income.
Step 3: Find out what range that midpoint is in using the cumulative total column. It should be the same range you found in Step 1 that has a cumulative percent just above 50%. In this case, the midpoint household is in the $75,000 to $99,999 range.
Step 4: Determine the income of that household at the midpoint. We know there are a cumulative total of 4,162 households for that range, meaning that 4,162 have incomes of $99,999 or less. We also know that 2,920 households have incomes of $59,999 or less, and only 1,242 are in the range of $75,000 to $99,999. We can subtract the cumulative total for the range right below 50% from the midpoint:
3,611 – 2,920 = 691 //midpoint minus last cumulative total
Then divide this number by the total households in the $75,000 to $99,999 income range:
691 / 1,242 = .556
Now we’re going to assume that those 1,242 households are distributed evenly among the range of $75,000 to $99,999. (The fancy word for this is linear interpolation.) Let’s use that ratio to see where within $75k and $99,999 the midpoint’s income is:
75,000 + [(99,999 – 75,000) * (.556)]
75,000 + [(24,999) * (.556)]
75,000 + 13,908 //rounding to a whole dollar
$88,908
A Robust Estimate
If you simply do the “quick-and-dirty” approach of taking the median of the medians ($84,194 in this case), you get a different answer. While our result of $88,908 is still an estimate since we are working with tabulated data, it’s a more robust estimate. The more tracts you’re aggregating, the bigger the difference between the quick-and-dirty median of medians and the derived median from the full distribution. Additionally, a big drawback of taking the median-of-medians is that your answer can only be one of the values of the tracts within your group. Using the method above, the possibility space for the answer is continuous. The biggest drawback, however, is that the median-of-medians does not take into account the differences in the total number of households in each tract.
General Tips
Median household income is a consistently popular attribute, but there are so many other medians out there. These same approaches can be applied to median age, median home value, median contract rent, median year that homes were built, and many more attributes. No matter the attribute, you’ll want to work with a table with the smallest ranges you can find, for example, five-year age ranges are preferable over ten-year age ranges.
Other Options
- Use the reported medians from Census when possible. Are you aggregating tracts to form a city or a legislative district? Census publishes estimates for many geographic levels beyond what is available in Living Atlas.
- For truly custom polygons, use the Enrich Layer analysis tool and retrieve Esri Demographics data for medians. Spend a few analysis credits to calculate medians for several custom polygons at once, and several median attributes at once.
- Use the Public Use Microdata Sample (PUMS) that the American Community Survey offers. Unlike the ACS summary tables that we love to map, the PUMS data is individual records of people and housing units, with single values for variables like age, income, rent, and home value. This means that you can really sort individual records from highest to lowest, which will give a more accurate result than the linear interpolation workflows. The PUMS files are for advanced data users who are comfortable working with survey weights. Also, this option will only get you the Public Use Microdata Area (PUMA) as the smallest level of geography, which could be groups of counties in some areas.
Next time the decisionmakers whom you support ask you these questions, you are well-positioned to answer. Share your examples in Esri Community.


Article Discussion: