Imagine that you own a successful mobile dog grooming business in Lancaster County, Nebraska. You have spent the last decade building up this profitable business and developing a loyal set of customers. You are ready to expand the business to the nearby Omaha, NE area.
In this article, we will demonstrate how to leverage your existing customer data to identify the population segments most likely to utilize your services and pinpoint where to find new customers within these segments.
- What is Target Marketing?
- Setup
- Overall Workflow
- Create Segmentation Profiles
- Run the Target Marketing Wizard
- Examine the results
What is Target Marketing?
The ArcGIS Pro Business Analyst extension provides powerful tools and workflows that allow businesses to make better, more data-driven decisions. The Target Marketing Wizard is one of these tools. The Target Marketing Wizard analyzes the composition of your market area compared with your customers and allows you to see the types of people you are reaching, as well as people you should be targeting and where they can be found.
We will utilize Esri’s Tapestry Segmentation, which is a market segmentation system that classifies residential neighborhoods in the United States into unique market segments based on demographic and socioeconomic characteristics. It helps businesses and organizations understand their target audiences better by providing insights into the lifestyle preferences, behaviors, and demographic profiles of residents in different neighborhoods.
Read on to learn how to use the Target Marketing Wizard to identify and market to potential new customers.
Setup
Before we start our workflow, we need to do some setup and gather our input data.
Data source
The Target Marketing Wizard requires a locally installed Business Analyst data source that contains segmentation data. In this article, we are using the U.S. 2024 dataset.
Customer data
You will need a point layer of your current customers and their locations. This can be an existing layer that you have or can be created from an Excel file with location data. Learn about using Microsoft Excel files in ArcGIS Pro.
Our layer of current customers in Lancaster County is called LancasterCountyCusts.
Existing customer area
You will also need a polygon layer that represents the geographic extent of your customers. This can be an existing boundary layer that you have, can be created from standard geographies, or even created using the Minimum Bounding Geometry geoprocessing tool.
We are using a county boundary called LancasterCountyBoundary, which encompasses all customers in LancasterCountyCusts.
New market area
Finally, you will need a layer that represents the area into which you want to expand. It can be based on standard geographies (counties, zip codes, etc.) or any other polygon layer that you like.
Our layer covers Douglas and Sarpy Counties in Nebraska and is called DouglasSarpyCountiesBoundary. We created it using the Generate Standard Geography Trade Areas geoprocessing tool.

Overall Workflow
Our workflow consists of three high-level steps.
- First, we will create two segmentation profiles – one for our existing customers and one for the area in which those customers live. This will provide us with the segmentation information about which segments perform best for our business.
- Next, we will run the Target Marketing Wizard with a focus on the new market area into which we are looking to expand. The wizard allows us to focus on our successful segments and create map layers and reports for those segments in relation to our new market area.
- Finally, we will examine the map layers and reports that the wizard created and learn how to interpret them.

1. Create Segmentation Profiles
We need two segmentation profiles to perform the analysis. The customer profile tells us who are our customers by categorizing them by Tapestry segment. The market area profile tells us how many adults or households of that Tapestry segment are in the areas we are looking at. The Target Marketing Wizard puts these two profiles together to determine the best areas to find new customers.
Create a Customer Segmentation Profile
A Customer Segmentation Profile is a distribution of your customers classified into socioeconomic groupings.
Each customer is assigned to a standard geography (block groups in the U.S.), and each of those geographies is assigned to the Tapestry segment with the highest population in that area. This information is used to determine to which Tapestry segment each customer belongs. The customer profile consists of a list of Tapestry segments along with the number of customers in each and percentage relative to total customers. Learn more about Customer profiles.
To create a Customer Profile, you will need a layer that contains your existing customers as point data.
First, open the Generate Customer Segmentation Profile geoprocessing tool. Set the following parameters.
- Customer Layer: your customer layer (our is LancasterCountyCusts)
- Segmentation Base: Total Households
- Output Profile: leave default
- Volume Info Field: leave blank
Click Run.

A Customer Profile is created and stored in your project folder. To view this profile, go to the Catalog pane and open the Business Analyst folder and then the Target Marketing folder. Right click on CustomerProfile.sgprofile. The Segmentation Profile viewer opens.
Here you can see a list of all the Tapestry segments in the customer base, along with the counts and percentages of your customers who live in a block group assigned to that segment. We can see that nearly a quarter of our customers are in the 6A (Green Acres) segment.

Create a Market Area Segmentation Profile
A Market Area Segmentation Profile categorizes the population in a geographic area. Population is categorized at the smallest demographic level supported by your dataset (block groups in the U.S.). Each block group is assigned a dominant Tapestry segment based on population or household count.
Because we are working with two geographic areas in this workflow (Lancaster County, where our customers are found and Omaha, NE, where we want to expand our business), we will need to create the Lancaster County market area segmentation in advance of running the wizard. Learn more about Market areas.
To create a Market Area Segmentation Profile, open the Generate Market Area Segmentation Profile geoprocessing tool. Set the following parameters.
- Input features: a polygon layer that contains your customers (our layer is called LancasterCountyBoundary)
- Segmentation Base: Total Households (this should be the same as we used for the Customer Profile creation)
- Output Profile: leave default
Click Run.

A Market Area Segmentation Profile is created and stored in your project folder. To view this profile, go to the Catalog pane and open the Business Analyst folder and then the Target Marketing folder. Right click on MarketAreaProfile.sgprofile. The Segmentation Profile viewer opens.

Here you can see a list of all the Tapestry segments, along with the counts and percentages of all households in the area (Lancaster County). Later in the workflow, this will be compared with the values in the Customer Segmentation Profile previously created to identify which Tapestry segments to target.
2. Run the Target Marketing Wizard
Now that we have our segmentation profiles are created, we can run the Target Marketing Wizard to understand which specific areas to target for our new location.
From the Analysis ribbon, click Business Analysis and then click Target Marketing Wizard.

The wizard opens.
Wizard Step One
This step allows us to specify the types of customers that use our services. We will do that using the Customer Segmentation Profile that we created earlier.
Set the parameters as follows.
- Customer Layer: leave blank (since we pre-created our Customer Segmentation Profile, we do not need the customer layer here)
- Target Profile: select the customer profile we created earlier (CustomerProfile.sgprofile)
- Leave all other fields as they are
Click Next.

Wizard Step Two
In this step, we specify both the area into which we want to expand and the market area segmentation profile for Lancaster County, which we created earlier.
The Market Area section is where we define our target area for siting a new location.
The Base Profile parameter will be used along with the Customer Segmentation Profile chosen in Step One to determine the Tapestry segments on which we want to focus.
- Market Area: click Use Polygonal Layer and choose your expansion area layer (DouglasSarpyCountiesBoundary)
- Base Profile: select the market area profile we created earlier (MarketAreaProfile.sgprofile)
Click Next.

Wizard Step Three
Targets are collections of one or more segments that are grouped together based on similar characteristics in your customer base. Sets of targets are consolidated into target groups. Target groups are used to produce powerful maps and reports that help you identify and locate new customers.
The Targets box groups each Tapestry segment by one of four designated targets: Core, Developmental, Niche and Monitor. These targets are based on the percent composition of your customers in each segment and how that compares to the percent of households in that segment in the overall area. The comparison value is stored as an index, with 100 being the average.

We can see that our Core customers come from segments 1D (Savvy Suburbanites), 4A (Workday Drive) and 6A (Green Acres). It seems these types of customers are the most interested in mobile dog grooming services.
Core customers contain segments that make up 4 percent or more of your customers and index at 110 or greater. And index of 110 means that your customer base in this segment is 10% higher than what would be expected based on the general market. These are the customers we want to find in our new area.
Developmental, Niche and Monitor customers score less than Core customers in percent composition or index or both. Learn more about Target groups.
This is visualized in detail in the Four Quadrant Analysis chart in Figure x. This chart displays segments according to index and percentage values, as described above.

For example, the highlighted segment in the image falls into the Core group as it contains 7% of customers and an index of 121 (this segment is using our services 21% more than the overall population).
It is possible to move segments to different targets, but we will leave the defaults for this exercise.
Learn about Four Quadrant Analysis.
Click Next.
Wizard Step Four
The wizard will use the inputs we have supplied along with the four-quadrant analysis to help us find potential new customers in our expansion area and will generate map layers and reports to assist us in this.
In this step, we choose which maps layers we want the wizard to create for us. We are interested in identifying in which smaller areas in our expansion area we will find the most potential new customers. The map layers that will help us are Target Layer and Market Potential. These are explained later in “Examine the results”. Learn about Target marketing map layers.
Set the following parameters.
- Geography Level: US.BlockGroups
- Mapping Layers: select only Target Layer, Market Potential
- Output Location: leave the default
Click Next.

Wizard Step Five
In this step, we choose which reports we want the wizard to create for us. We are interested in learning more about the areas identified in the Market Potential map layer, we will choose the Developmental Marketing Strategies and Market Potential reports. Learn about Target marketing reports.
Set the following parameters.
- Available Reports: select Developmental Marketing Strategies and Market Potential
- Export Format: select Interactive HTML
Click Next.

Wizard Step Six
Review and click Finish.
3. Examine the results
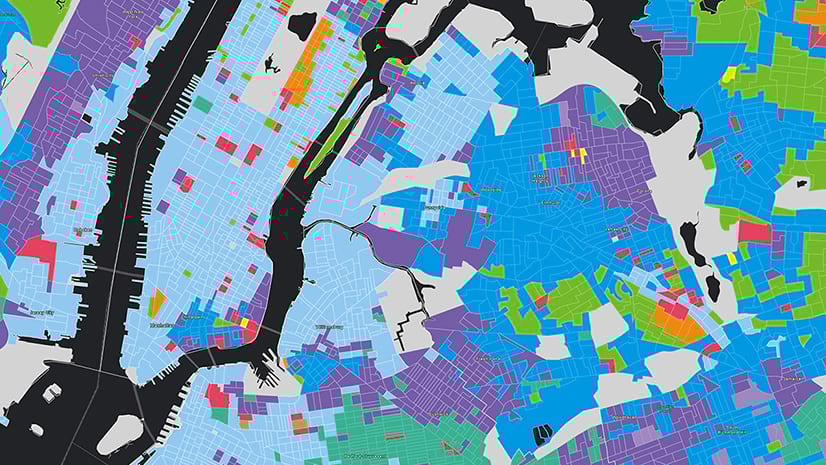
Map Layer: Target Layer (Core)
This layer shows where potential customers in segments classified as Core can be found. Based on the results from the Four Quadrant Analysis, our core segments are 1D, 4A and 6A.
 map layer")
The map shows all block groups where the dominant segment (most households) is in our Core Target.

Map Layer: Market Potential
This layer shows the potential number of customers in each block group. Darker colors represent more potential customers. The values are calculated based on the percentage of customers we have in each segment in our original area and the number of households in each segment in our expansion area.

Report: Developing Marketing Strategies
The requested reports are generated as interactive HTML infographics.
The Developing Marketing Strategies report provides an overview of the media that your target customers read, listen to, and watch. It helps guide decisions about how to reach your target segment groups based on the media they consume.

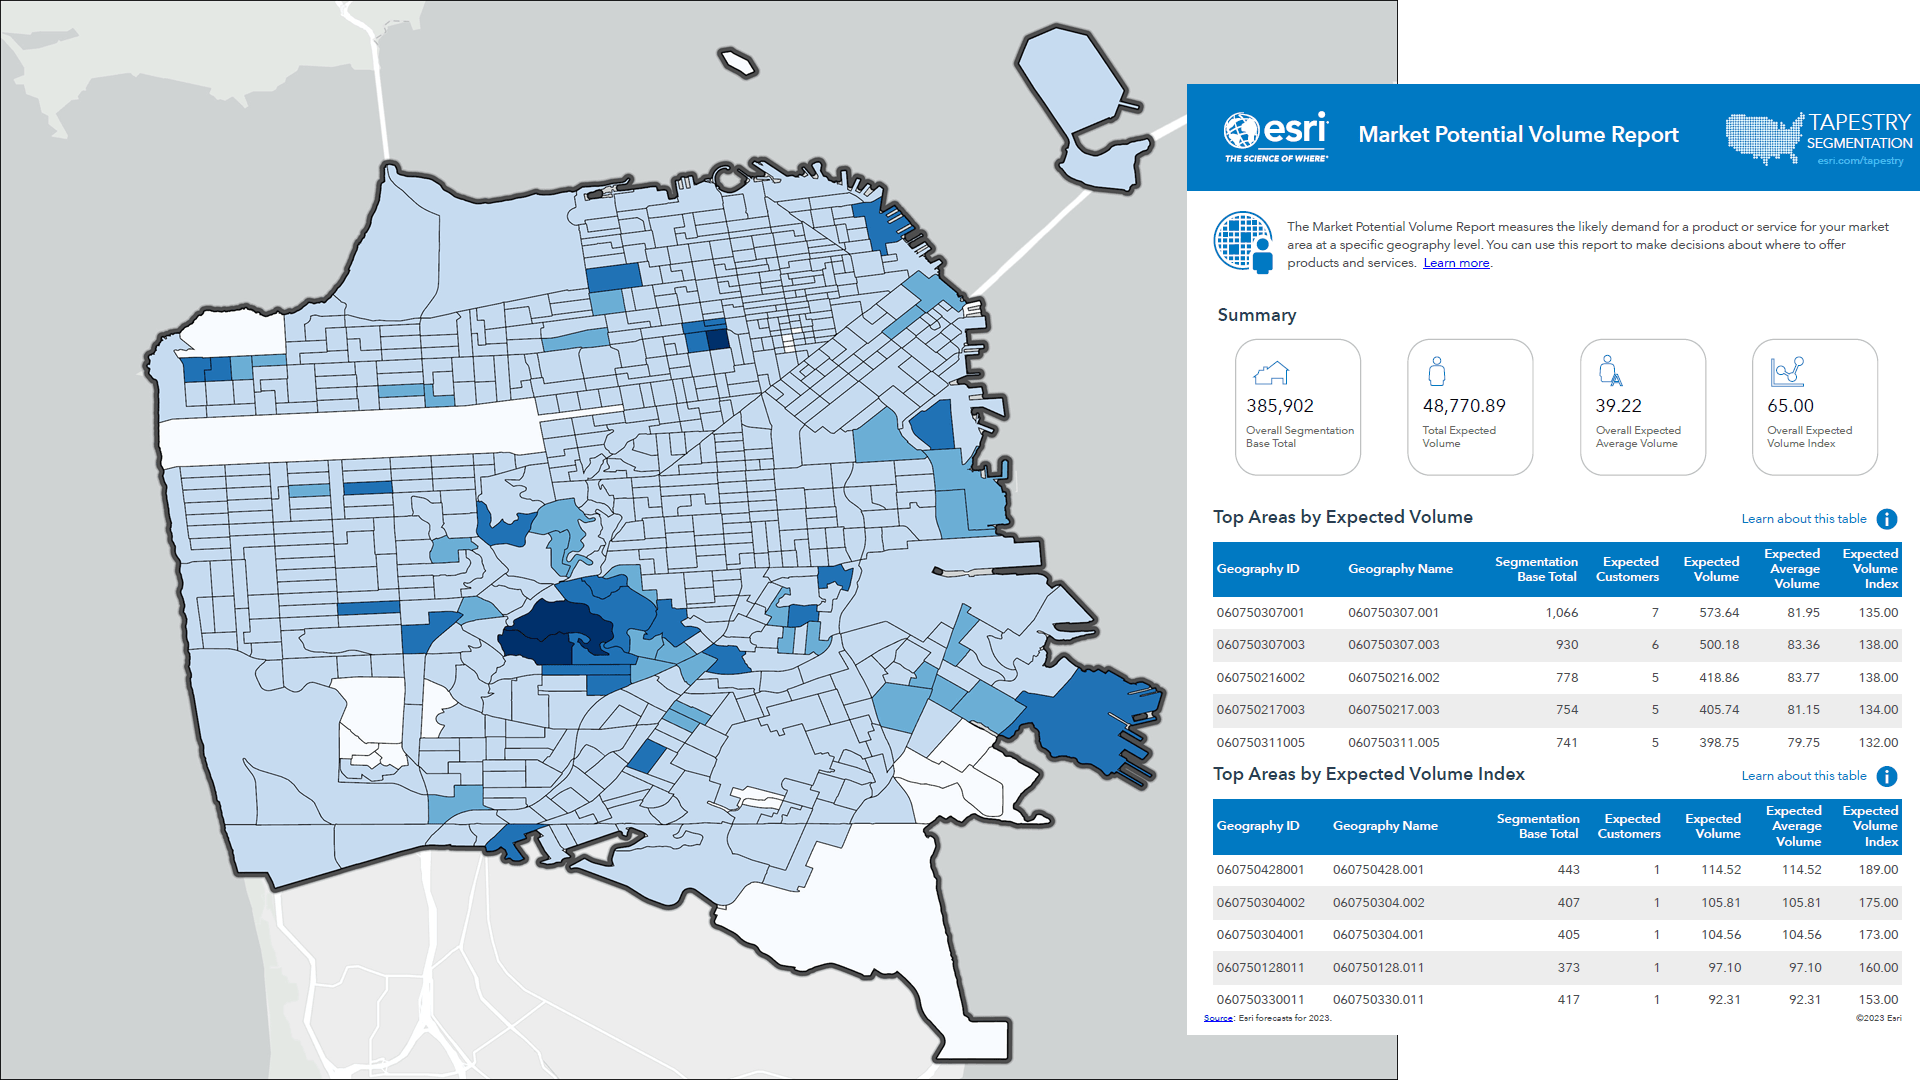
Report: Market Potential Report
The Market Potential Report measures the likely demand for a product or service for your market area at a specific geography level. You can use this report to make decisions about where to offer products and services.
Hover over the different components to see more information and options.

Conclusion
In this article, we walked through using Business Analyst’s Target Marketing Wizard to discover new areas with potential customers similar to our best current customers. The output of the wizard includes powerful maps and reports that help us to find and market to prospects in a new area.
We now have a map (Target Layer (Core)) that shows us where in the Omaha area we should focus our marketing efforts for our business expansion. The Market Potential map tells us how many new customers we can expect to gain in each area – this helps narrow our focus.
The Market Potential report summarizes the data in the map layers so we can understand how many total potential customers are in the Omaha area.
Once we’ve selected our target areas, the Developing Market Strategies helps us decide how to reach these potential customers based on their preferences and habits.
Article Discussion: