Animations can guide the user to better understand how to interact with an application, how the data is changing over time or how something works. Animations are not limited to motion, but in this blog post we will tackle the specific use case of animating a 3D mesh by translating, rotating or scaling it. I’m excited about this new capability in the ArcGIS Maps SDK for JavaScript because I believe such animations can bring a web scene to life (even though it’s a very niche side of animations).
The main idea is that we load a gltf model as a Mesh and then we apply a transformation on every frame using MeshTransform. With version 4.30, ArcGIS Maps SDK for JavaScript supports fast updates to translate, rotate or scale the mesh.
Important disclaimers:
- There are 3 ways of rendering 3D models in ArcGIS Maps SDK for JavaScript: by setting the GLTF model as a point symbol on the renderer, by uploading it to an editable 3D object SceneLayer, by loading it as a mesh using Mesh.createFromGLTF. The animation technique discussed in this blog post only applies to the last one where we import a GLTF model as a mesh.
- This technique doesn’t scale for large datasets. Depending on the complexity of the model, if you load too many models as graphics with a mesh geometry you might run into memory issues.
- With the technique described in this blog post we can only animate the whole model by translating, rotating and scaling it. Animations using GLTF vertex skinning are currently not supported.
- We can only use this technique in custom web applications, not in Scene Viewer.
With that out of the way, let’s look at a few possible animations. Here is a video of a small application I built, where I show examples of such animations:
Keep reading if you want to look into how you can create each one of these animations. But if you just want to look at the code, it lives on GitHub.
Animate with rotation
Did it ever happen to you that you wanted to have a 3D object as a symbol, but from certain angles the object doesn’t look recognisable? Let’s say you want to display a 3D pin point to mark a location. If we look at it from the side, we can’t really tell that it’s a pin point:
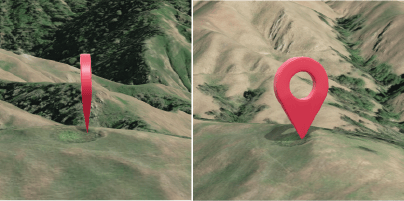
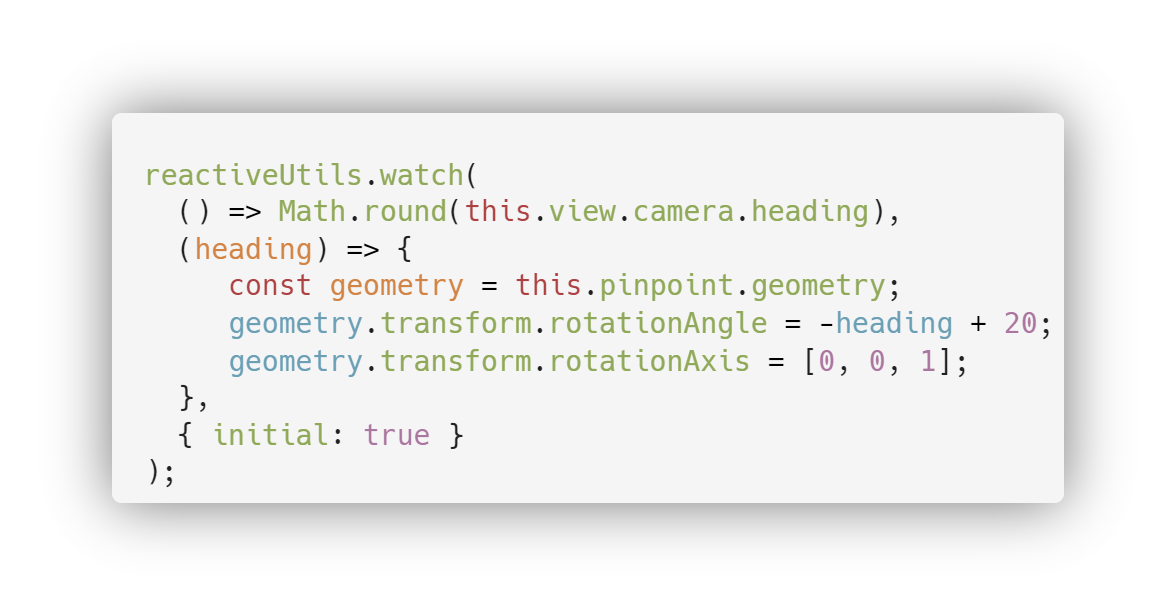
To align the pin point to face the camera, we’ll watch for changes in the camera heading and rotate the pin point accordingly. This means that we’ll rotate it around the z axis with an angle that is the negative of the heading. I am adding a few degrees more because I like to see it a bit from the side to show its 3D shape:
Let’s look at another use case for rotation: a wind turbine. I purchased an offshore wind turbine on Sketchfab. To make the blades rotate, I used Blender to separate them from the tower and I exported both the tower and the blades as separate glb models. The tower is loaded as a 3D object symbol layer, as it consumes less memory and the blades are individual mesh graphics, loaded using the Mesh.createFromGLTF method. Each graphic has a given wind speed and we use it to calculate the revolutions per minute using this formula: RPM = (60 * wind speed * TSR) / (Math.PI * 2 * blade length). The blade length is in meters, wind speed is expressed in meters/second. The tip speed ratio (TSR) is the ratio between the tangential speed of the tip of the blade and the actual speed of the wind. Normally it’s somewhere between 6 and 9.
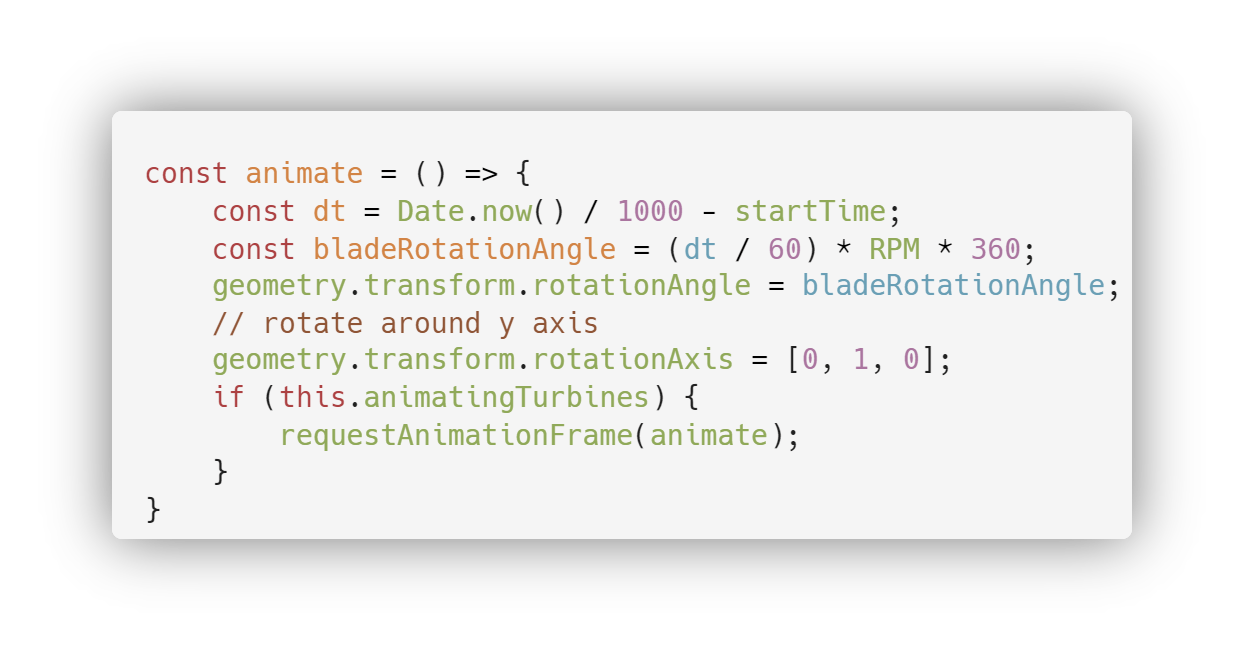
To create the animation we need to calculate the angle of rotation on the y axis based on the elapsed time since the animation started and the RPM value. RPM tells us how many full rotations a blade does in one minute. So the rotation angle will be bladeRotationAngle = elapsedTime * RPM * 360, where elapsedTime is expressed in minutes. I am multiplying by 360 because the rotation takes an angle in degrees.
We then apply the transformation and we make sure the same calculation runs again on the next frame:
Rotation around multiple axes
I added a boat to the 3D diorama and initially, I made it move up and down to mimic the wave movement. But when I showed it to my colleague Hugo, he said: Raluca, we need to add pitch and roll!
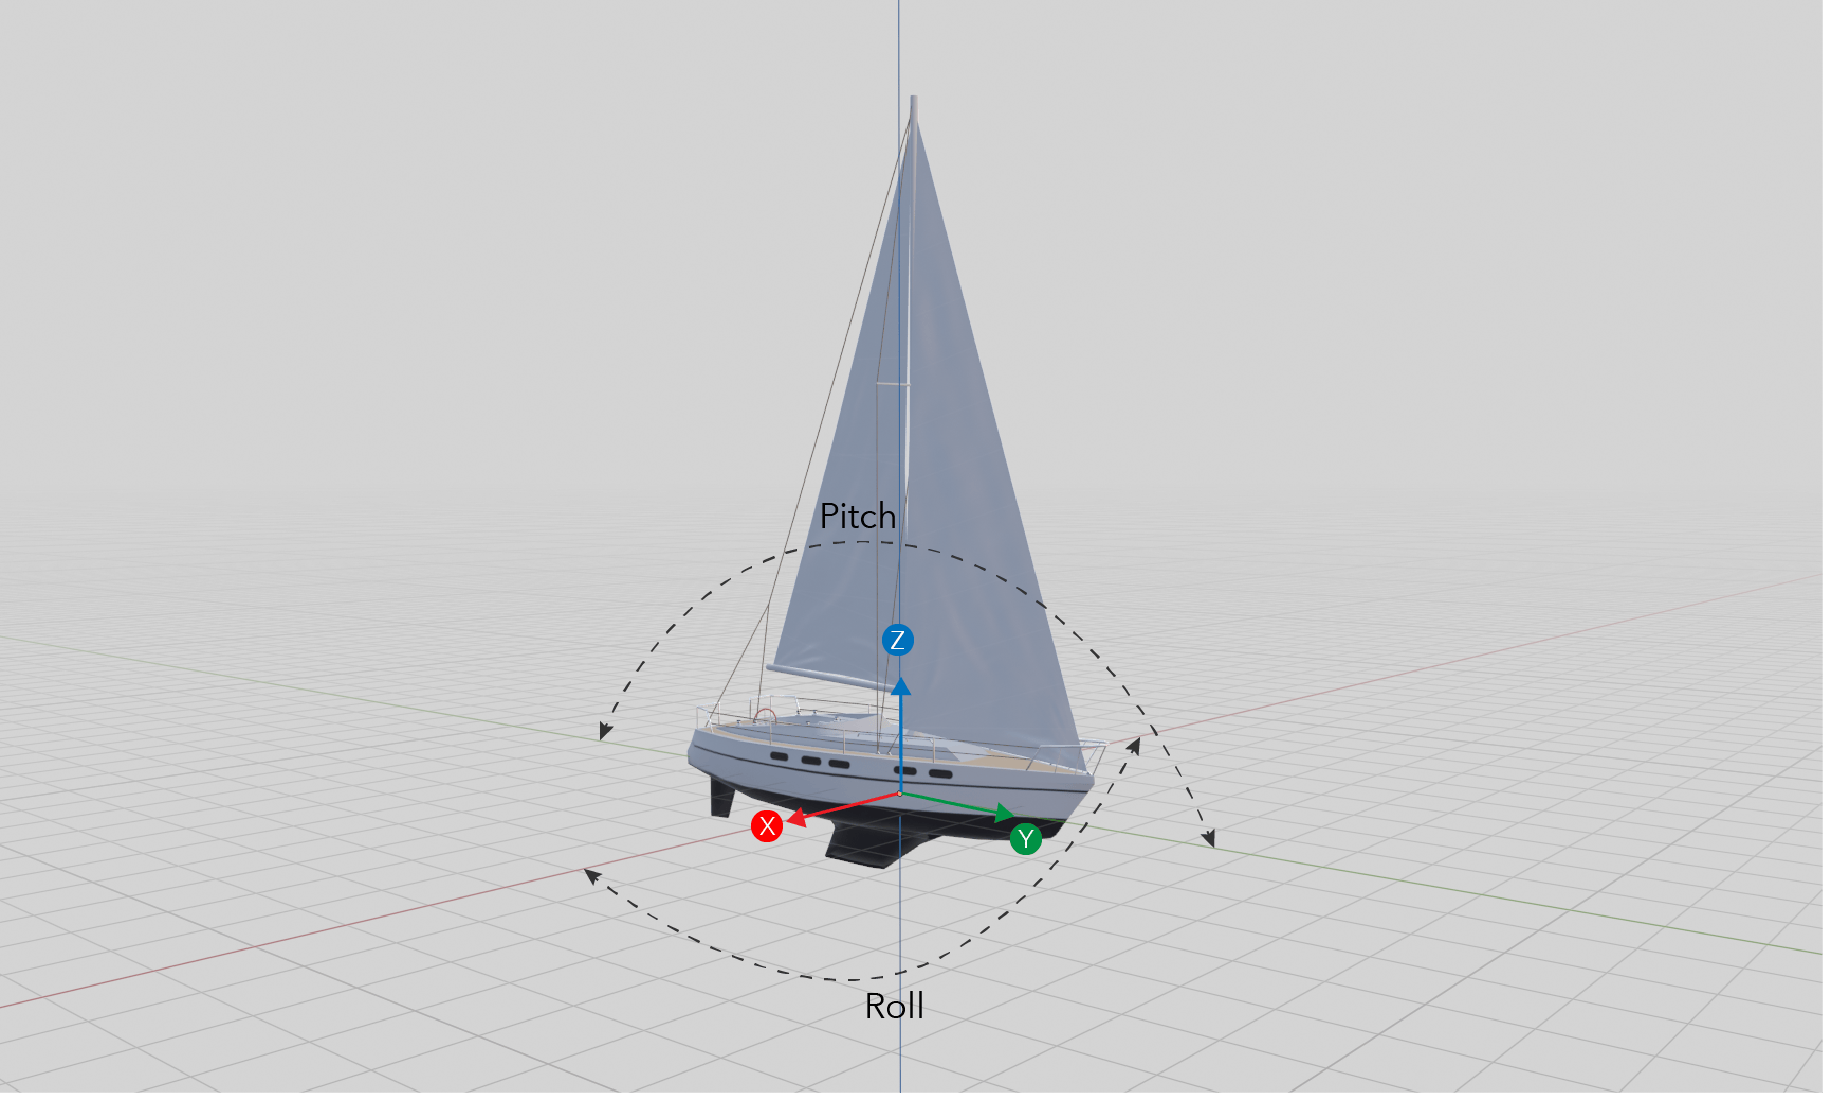
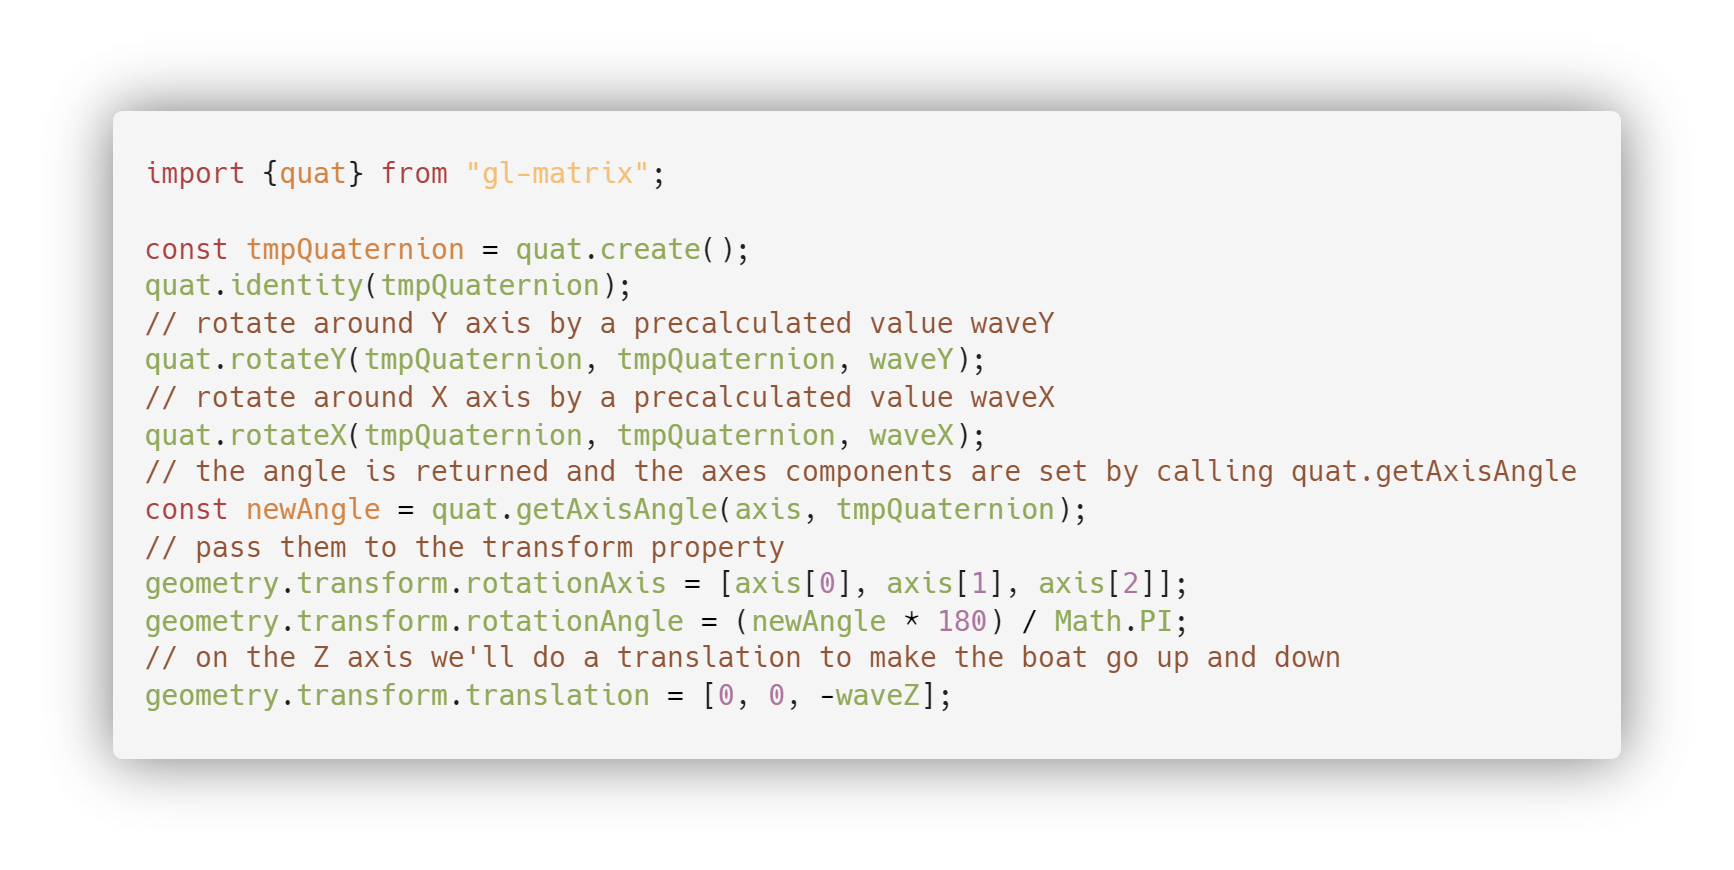
A rotation around an axis obtained by composing x and y is done using quaternions. I won’t attempt to explain them in this blog post, but I’ll drop a link to the best explanation I could find. Basically a quaternion is represented by the formula:q = cos(θ/2) + sin(θ/2)*(ux*i + uy*i + uz*k) where ux, uy, uz are the components of the axis around which we want to rotate and is θ the angle of rotation in degrees. In JavaScript you don’t need to calculate the angle and the rotation axes yourself, you can use a library called GLMatrix that does the calculation. The angle is dependent on the elapsed time and it’s used to calculate waveX, waveY and waveZ.
Animate with scale
How can we use scaling? We could use it to give the user clues on what can be clicked by increasing the size of an object on mouse hover. We could also resize it proportionally to the distance to the camera, so that it’s always visible as we zoom out (we could make it behave like screen space symbols that always keep the same size on screen). In our example we make the 3D pin point pulsate to draw the user’s attention to that location.
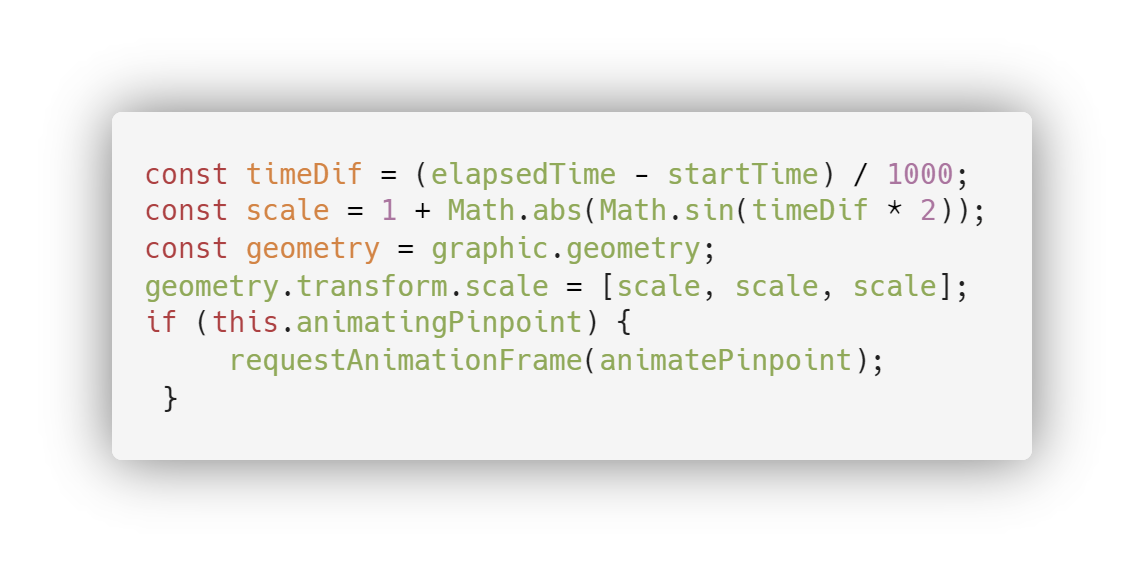
The first thing that comes to mind when I think of something decreasing and increasing is a sinusoidal function. The easiest way to create a pulsation of a 3D object is by scaling it using Math.sin(elapsedTime). Then we pass it into the transform property of the Mesh geometry:
Animate with translation
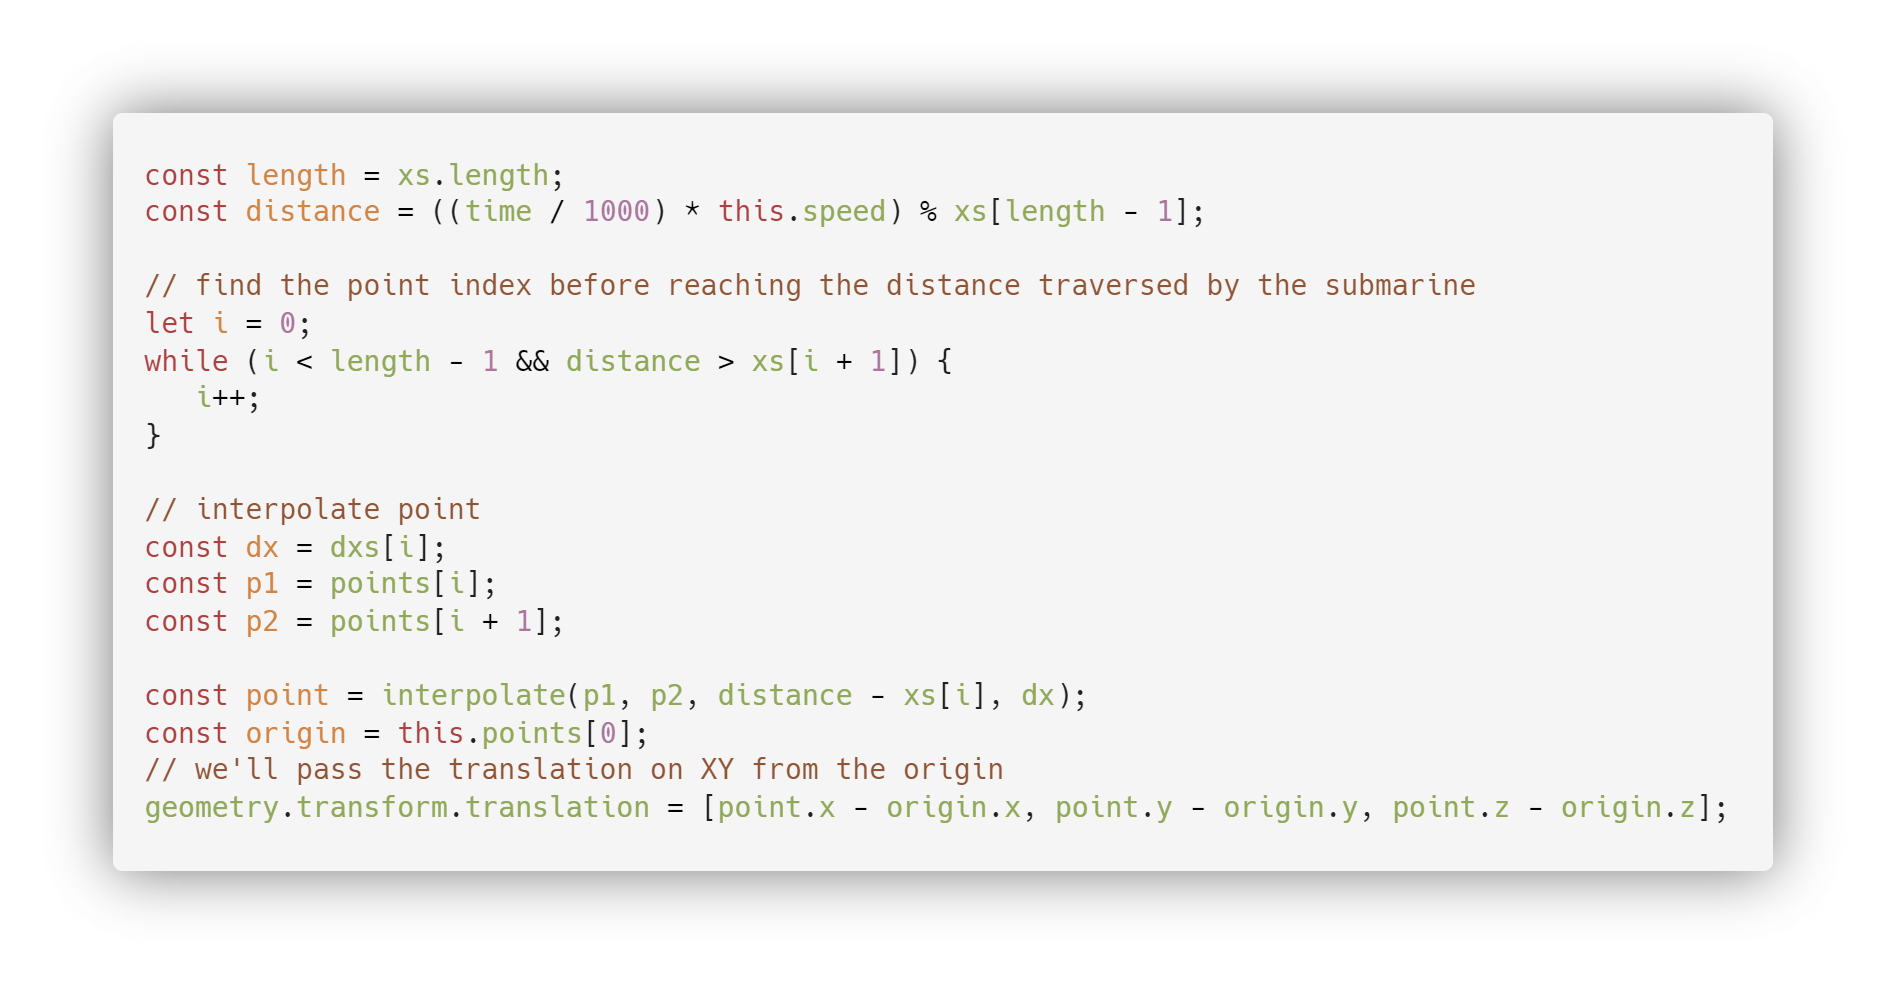
Moving a 3D object along a predefined trajectory is probably one of the most common use cases. In this example we’ll move a submarine along a predefined line. In our fantasy 3D diorama world, we let the submarine travel with 360km/h (that is about 220mph). And every frame we calculate the new position in which we should place it. This technique is taken from Arno’s example where he animates a line to draw itself. The steps are:
- we calculate the distance that the submarine should have traveled already based on the elapsed time and the speed:
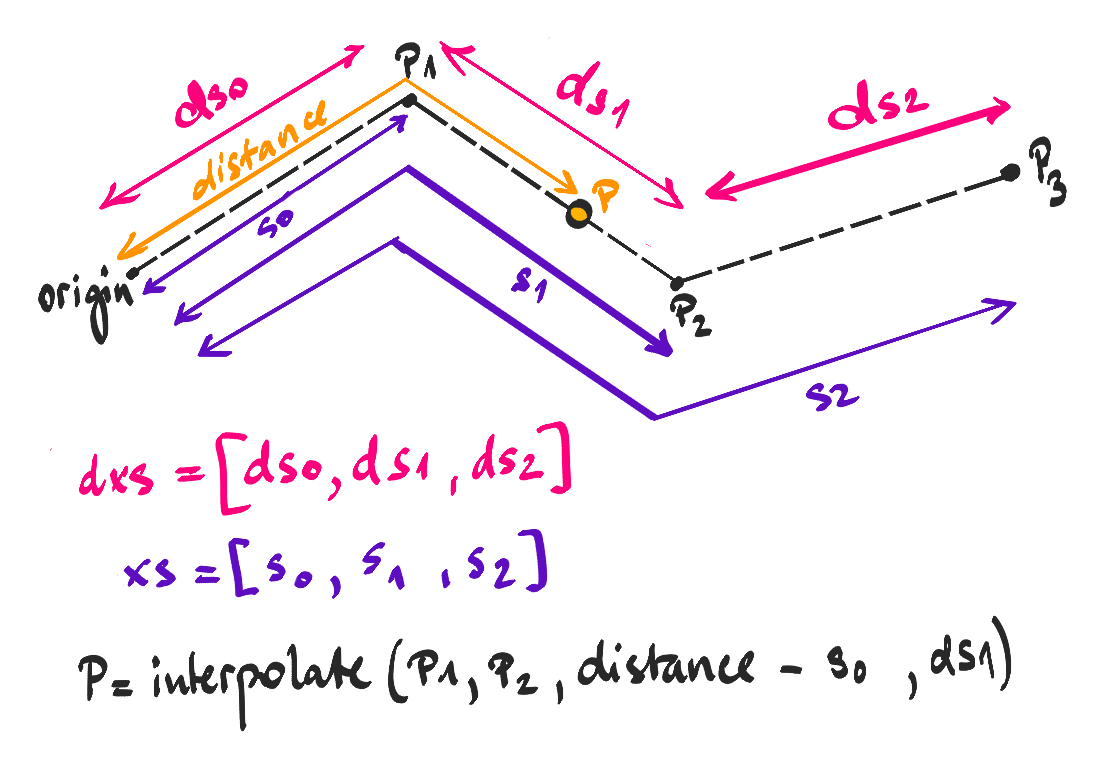
const distance = (elapsedTime/1000) * speed - we loop through the vertices in the polyline, until we find the 2 points between which the submarine should be placed. To figure that out, we look at the sum of the distances between the points and the previously calculated distance.
- when we find the two points, we interpolate between them using the previously calculated distance to figure out the new position.
In case you’ll be using this technique, I’d love to know about it! In the meantime, I’ll leave you with the link to the application and the link to the code.

Article Discussion: