Esri’s June release of 2024/2029 Updated Demographics feature age data that have been re-based using the 2020 Census Demographics and Housing Characteristics (DHC) file. Esri Demographic data now incorporate 2020-based data, rather than 2010-based data, as a starting point for age modeling. This shift provides more accurate estimates, but some age-based variables may show changes when compared to prior releases of Updated Demographics. Updated age data shine a bright light on the accelerated aging of the U.S. population. This blog highlights several trends in age-based data and explores some of the tools available to better understand the dynamics of aging in your areas of interest.
Census and Esri data
The DHC file is the 2020 equivalent of the 2010 Census Summary File 1 (SF1) and is the last major release of Census 2020 data. The DHC provides detailed tables covering topics such as age, race, ethnicity, family type, housing type, occupancy, and tenure. Like the rest of the 2020 Census data products, this release on May 25, 2023, was delayed due to pandemic-related complications.
Esri develops current-year estimates and five-year forecasts for age by sex by leveraging the 2020 Census counts as a starting point. Our models use a cohort component approach to age the population based on components of population change as well as iterative proportional fitting techniques that are a better suited for unique areas like colleges, military bases, and prisons with stable population age structures. Esri’s age by sex data are then used to build out multiple age-based characteristics including the following tables:
- Population by Age, Sex, and Race
- Population by Age, Sex, and Hispanic Origin
- Employed & Unemployed Population 16+
- Employed & Unemployed Population 16+ by Age Group
- Employed & Unemployed Population 16+ by Sex Group
- Employed Population 16+ by Industry
- Employed Population 16+ by Occupation
- Population 25+ by Educational Attainment
- Population 15+ by Marital Status
- Population by Generation
- Households by Income and Age of Householder
- Households by Disposable Income and Age of Householder
- Households by Net Worth and Age of Householder
- Age Dependency Ratio
- Child Dependency Ratio
- Senior Dependency Ratio
- Economic Dependency Ratio
- Child Economic Dependency Ratio
- Working-Age Economic Dependency Ratio
- Senior Economic Dependency Ratio
All the preceding tables will receive a revised age base in 2024/2029 Esri Updated Demographics. Users may experience large changes in these characteristics when transitioning from 2023/2028 Esri Updated Demographics to 2024/2029 because the underlying age model has been updated with the latest decennial census information. The 2023/2028 estimates and projections were derived from Census 2010 age data, thus making the 2023 estimates a 13.25-year forecast horizon and the 2028 projection an 18.25-year forecast horizon. After incorporating Census 2020 DHC data, the 2024/2029 estimates represent 4.25-year and 9.25-year forecast horizons, respectively. While this blog focuses on age, it’s important to note that other 2024/2029 Esri Updated Demographics variables are also rebased on the Census 2020 DHC data including tenure and families.
Renewed age data provide an opportunity for analysis. The results of the 2020 Census have provoked discussions of a “silver tsunami” or a “population timebomb” pending in the US. Let’s look at some of the trends the U.S. is experiencing and discuss some of the challenges that are associated with an aging society.
Americans are older than they have ever been

This chart shows the median age of Americans across multiple censuses and Esri’s current estimates and projections. You can see that the median age has jumped from 28.1 in 1970 up to 39.3 in 2024 and is projected to be 40.4 in 2029. However, this demographic shift is not happening in unison, significant differences exist across the country for median age.

This map shows the variation in the median age by state in 2024. The 2024 US median age is 39.3. Counties with a younger median age than the US are in shades of seafoam, while counties with an older median age are in shades of orange. For reference, the youngest state is Utah at 32.2 years, and the oldest state is Maine at 45.3 years; that’s a spread of over 13 years. However, the youngest county is Madison County, Idaho at 23.4 years, and the oldest county is Sumter County, Florida at 69.3 years, a spread of nearly 46 years.
The share of the population 65+ will soon outnumber the population under 18
The population age 65+ and the population age 0 to 17 are commonly thought of as the non-working-age, or dependent population. The population age 18 to 64 are commonly thought of as the working-age population. Certainly, many persons under age 18 and persons over 64 are part of the workforce, however these age breaks have strong explanatory power around the level of dependence that the younger and older population have on the working population that largely provide the goods, services, and tax base for the entire population.

This chart shows the rapid increase of the population age 65+ and decline of the population under age 18 in the US from 2010 to 2050. The dashed lines represent Census Bureau projections[1]. Based on these projections, the 65+ population will surpass the under 18 population sometime around 2029. Assuming current fertility and migration trends persist, there will likely be significant impacts for our society as older dependents outpace younger dependents, including:
- Increased healthcare needs, number of providers, and caregivers
- Challenges to federal assistance programs like Social Security
- Decreased spending in consumer-driven economy
- Increased tax rates for the working population
- Work force decline threatening innovation and productivity
As the U.S. transitions to a state where the population 65+ is the dominant dependent population it is important to understand that the share of population 65+ is not uniformly distributed throughout the country. Certain areas synonymous with warmer weather and retirement communities tend to have higher concentrations of the 65+ population.
[1] Vintage 2023 US Census Bureau Population Projections Program, middle series.

This map shows Esri’s estimates of the share of the total population that are 65+ in 2024 by county. Large pockets of the 65+ age group are clustered in Florida, Arizona, the upper Midwest, New England, the Las Vegas area, the Austin/San Antonio area, coastal areas, and the eastern PNW.
Dependency ratios can help understand the impacts of an aging society
As the US population ages, dependency ratios can reveal more about the age structure of a society and the potential burdens and impacts of imbalanced age structures. Age Dependency Ratios (ADRs) are the ratios of the nonworking-age population relative to the population of working age. Esri provides three definitions of this ratio:
- The Child Dependency Ratio (CDR) is the population under 18 years of age divided by the working-age population aged 18 to 64.
- The Senior Dependency Ratio (SDR) is the population aged 65 and older divided by the working-age population aged 18 to 64.
- The ADR is the sum of the population under 18 years of age and 65 and older divided by the working-age population aged 18 to 64.

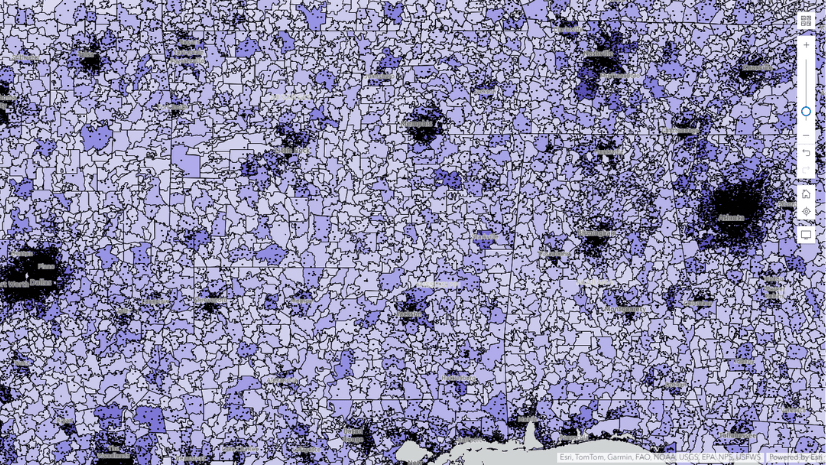
This map displays Esri’s 2024 ADR by county. For reference, state (and equivalent) ADRs range from 40.9 in the District of Columbia to 74.5 in South Dakota. The U.S. ADR is 66.4 in 2024, and counties with higher dependency are in shades of teal whereas counties with lower dependency are in shades of dark yellow. While there are similarities between the county-level median age and share of 65+ maps above, the ADRs at the county level show a more nuanced and complex picture of the potential burdens of an aging population. Keep in mind that an ADR of 100, indicates that there are an equal number of working-age population as dependent population. In 2024 there are 101 (or 3.2%) of counties with an ADR greater than 100. In 2029, that number is expected to rise to 347 (or 11%) of counties in 2029.
In addition to age dependency, Esri also estimates four separate Economic Dependency Ratios (EDRs). The EDRs account for labor force participation by age by measuring the relationship of non-workers to the employed population. View the Use and Interpret Economic Dependency Ratios tutorial for more information.
Summary
In summary, Esri’s age-based variables are refreshed for the June release of Esri 2024/2029 Updated Demographics. Users may see shifts in the underlying age data and distributions in these tables as they are now based on the latest decennial census counts. The 2020 Census data bring into focus the rapid aging of the American population. Analysis of age data is vital to understanding the differential patterns of aging and the impacts that it will have on our society. Esri’s estimates and projections of age, as well as additional measures like dependency ratios, can help with understanding complex age distributions in your areas of interest.
Explore Esri Demographics
Esri Demographics contains over 15,000 demographic and socioeconomic estimates created by Esri’s Data Development team. Topics include population, housing, consumer spending, market potential, tapestry segmentation, and much more. It is available throughout ArcGIS in the following products:
ArcGIS Living Atlas
ArcGIS Online and ArcGIS Pro
- Use Enrich Layer to append location-based data to points, lines, or areas.
ArcGIS Business Analyst
- Identify sites and evaluate markets with ArcGIS Business Analyst, demographic mapping software.
ArcGIS Location Platform
- Enhance workflows and apps with the ArcGIS GeoEnrichment Service – Enrich data with additional location-based information about people and places in a specific area.
Reports and Data
- Just need a report? Buy Esri Reports
- Just need data? Contact datasales@esri.com.


Article Discussion: