The data browser is a powerful interface in ArcGIS Business Analyst Web App and ArcGIS Community Analyst that allows you to search for and add demographic variables to your maps, analyses, infographics, and reports. With thousands of variables to explore, the data browser can help you find data relevant to your project.
When paired with ArcGIS GeoEnrichment Service, you can add data to the geographic boundaries of your choice, such as counties and census tracts (standard geographies) or wards and drive-time areas (nonstandard geographies). This kick-starts any spatial analysis, bringing together the data you need and the places you’re interested in.
In ArcGIS Business Analyst Web App, the data browser plays an essential role when creating color-coded maps, performing a smart map search, conducting suitability analysis, building infographics, and performing other workflows.
What new capabilities are added to the Business Analyst data browser?
In the June 2024 release, the data browser has been redesigned entirely! The updated design prioritizes users’ needs by simplifying the browsing experience and providing more control and transparency. Though the interface has a new look and feel, special attention was paid to retaining familiar hallmarks of the Business Analyst data browser, such as category cards, sorting mechanisms, and all the previous capabilities.

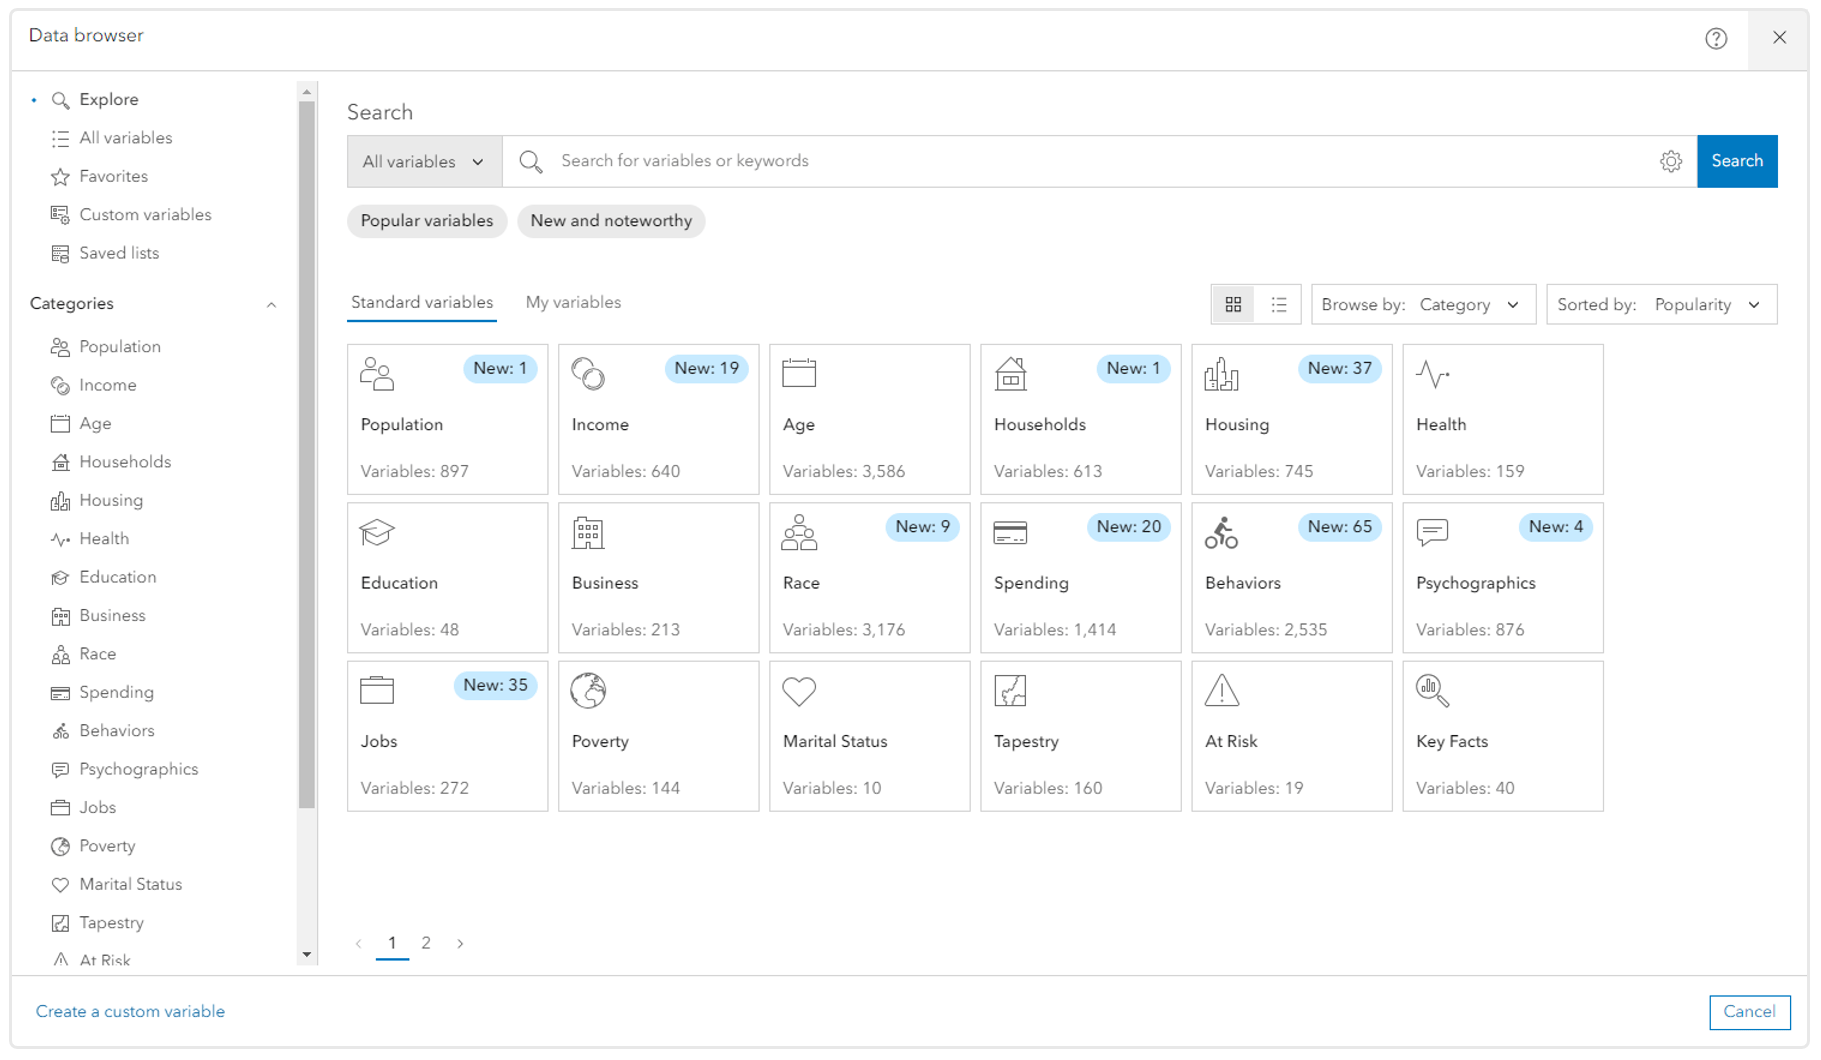
Below are some of the highlights of the new interface.
Improved navigation
Though many Business Analyst Web App users work with and enjoy the category “cards” on the data browser’s main page, the June upgrade couples the card experience with a more transparent navigation option. You now have easy access to all categories, all the time:
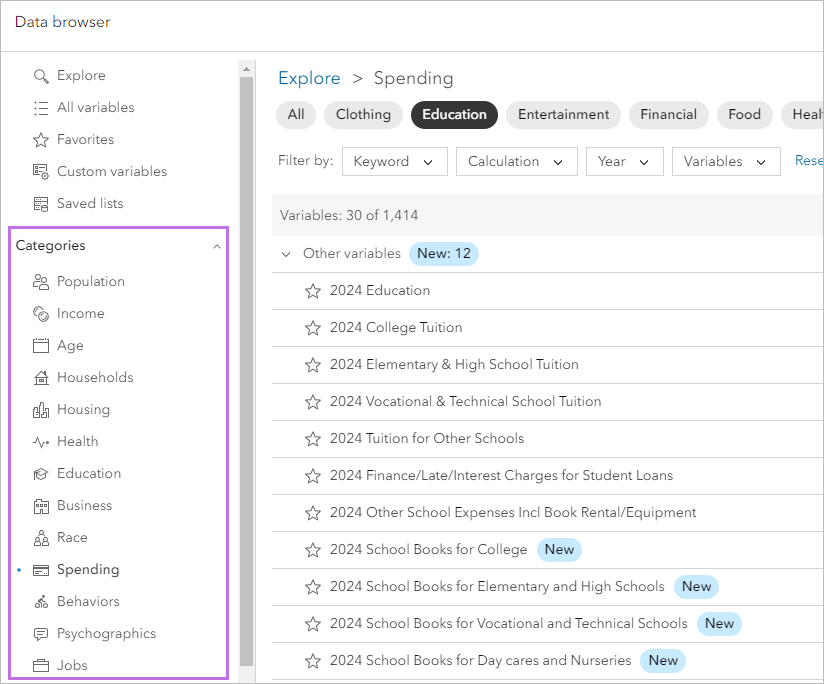
This means you no longer need to reverse out of a deep search in order to browse other categories—the navigation is always with you. And for card lovers, the familiar data browser main page has retained this straightforward organizational principle, but now you can swap the main page view between card view and list view.

More variable options
With this release, content in the data browser has been refreshed with new variables from many datasets. Fittingly, we’re also debuting a quick-search filter called New and noteworthy, highlighting all the data that was added at the most recent release.

Previously, you could see new variables only within individual categories. Now, you can see everything that’s new all at once!

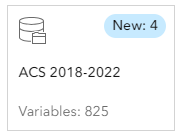
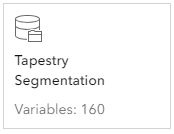
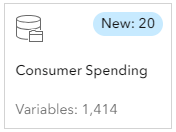
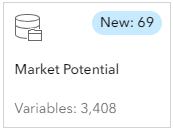
You can also see the overall number of variables in a category, right on the cards on the main page:

Streamlined data-finding capabilities
One of the things that makes the data browser truly a “browsing” experience is the way it surfaces the organization of Esri’s data, allowing you to discover new variables and understand the datasets they come from. It might not be immediately obvious to the casual user that inside a category like, say, Households there are actually data collections that group variables by subject. The redesigned data browser assists in data exploration by displaying each category’s data collections in a row of buttons along the top of the window:

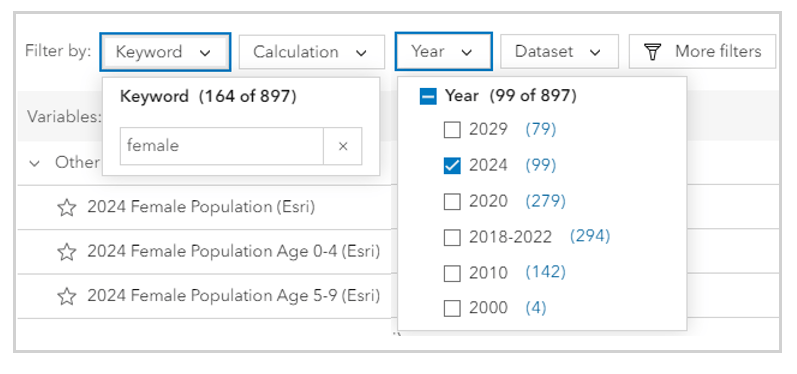
In addition to the data collections as a sorting mechanism, there’s a whole new row of drop-down filters that provide more granularity in your browsing. You might use the Keyword option to search by a specific term within a category, and then use the Year option to pick just one data vintage to view.
What new data has been added to the Business Analyst data browser?
The June 2024 data release brings an array of new variables to both U.S. and global demographic data collections, offering valuable insight into consumer spending, income distribution, and other areas of focus. As an added bonus, the newest data is now readily accessible in the data browser through the New and noteworthy category. You can also browse data by dataset using the Browse by drop-down menu. Some of the highlights include the following:
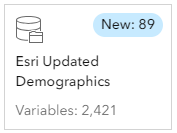
Esri Updated Demographics
Demographic data updates for 2024 and projections for 2029, aggregated to Esri’s 2024 geographic boundaries. There are 89 new variables, including household, housing unit, and population time series variables; contract rent variables; income and income inequality variables; and labor force by race variables.
American Community Survey
Demographic data updates spanning the years 2018-2022, aggregated to Esri’s 2024 geographic boundaries. There are 4 new variables in the Year Householder Moved In variable group.
Census 2020, Census 2010, and Census 2000
Demographic data from previous Census years, which has been standardized and aggregated into Esri’s 2024 geographic boundaries, allowing you to work across Census vintages using the most recent boundaries.

Esri Tapestry Segmentation
Tapestry data updated to use 2024 adult and household base variables.
Esri Consumer Spending
Spending data updates based on the most recent Bureau of Labor Statistics expenditure surveys for the years spanning 2021 to 2023, aggregated to Esri’s 2024 geographic boundaries. There are 20 new variables, including dining out and education estimates for 2024 and 2029.
Esri Market Potential
Consumer demand and preferences data updates based on the 2023 MRI-Simmons Survey of the American Consumer. There are 69 new variables, including consumer demand and psychographic estimates for automobiles & other vehicles, electronics, groceries, health, audio media, TV viewing, pets, phones, shopping, and sports.
Esri Retail Demand by Industry
Industry-specific spending data updates based on consumer expenditure surveys spanning the years 2021 and 2022, aggregated to Esri’s 2024 geographic boundaries.
Esri Business Summary
Business, sales, and employee data updates based on Data Axle’s February 2024 business location data and the 2022 NAICS classification system, aggregated to Esri’s 2024 geographic boundaries. Note that NAICS classifications have been updated from the 2017 NAICS system.
U.S. 2024 geographic boundaries
Geographic boundary updates based on TIGER 2023, the Office of Management and Budget (for CBSAs), The Nielsen Company (for DMAs), and TomTom (for ZIP Codes). New and altered boundaries include Connecticut code structures and CBSA designations.
Additional resources
We hope that you find these new demographic data variables and data browser enhancements useful. For more information about the June 2024 Esri Demographics and ArcGIS Business Analyst Web App releases, check out these resources:


Article Discussion: