The June 2024 release of ArcGIS Business Analyst Mobile App is available! For iOS users, the updated app is available in the Apple App Store, and the updated Android version is available in the Google Play Store.
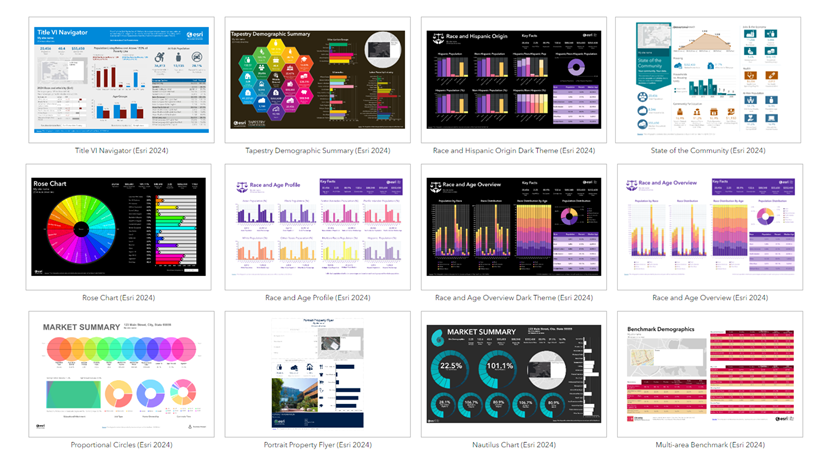
New in this release of BA Mobile App is the capability to run gallery infographics for sites. This article will give a brief overview of the infographics gallery in Business Analyst, and how to run gallery infographics in BA Mobile App – for example, the Rose Chart infographic which you can see in the banner image above, and the Nautilus Chart infographic, both of which feature salient information expressed using distinctive chart styles:

What are gallery infographics?
Business Analyst infographics present information about your sites in a visually compelling form. In BA Mobile App, you can browse infographics organized in folders. The Esri infographics folder includes ready-to-use infographics.

For example, the Key Facts infographic displays the most salient information about a site, such as the total population and median household income. The Gallery infographics folder includes additional infographics curated for industry-specific purposes, infographics created for a particular geographic region, and infographics showcasing new designs and concepts. For example, the Transportation to Work infographic includes information on how people travel to work. The Key Facts – 6 Part Circle infographic contains similar information to the Key Facts infographic in the Esri infographics section, but features a different visual design.
Run gallery infographics in BA Mobile App
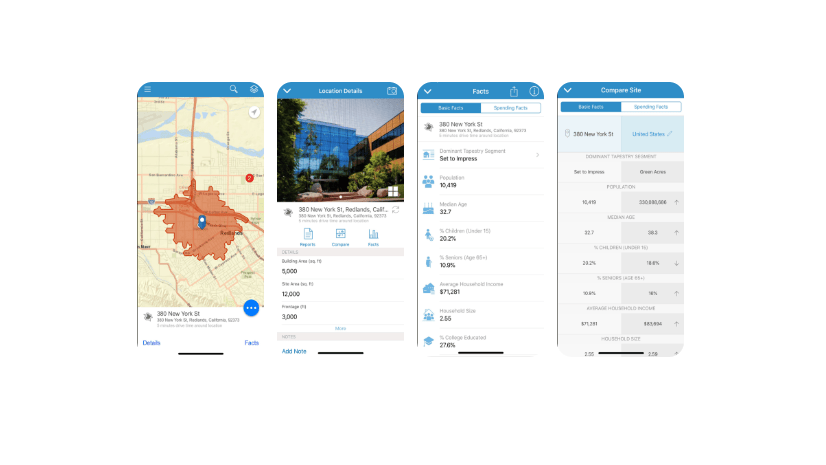
BA Mobile App is designed as a companion app to BA Web App. It can be useful to install BA Mobile App on your mobile device and use it on-the-go. For example, consider the scenario where you are out in the field and feel the need to look at transportation to work-related information about an address in that area. When you launch BA Mobile App, if you have location access enabled, the map will already be zoomed in to the area where you are located. Tap the Search bar at the top and start typing the address you’re interested in. You can complete typing the address or select it if it appears as a suggestion, as in the following screen capture. The suggestions are filtered by your current map extent.

Then click Create site and apply, say, a 5–minute drive time. The site will be created on the map. Tap the Site options button to view more options for the site. Tap Run Reports.

The Reports screen opens, with the Infographics tab selected by default. Tap Gallery Infographics. The Gallery Infographics screen opens. Swipe upwards on your mobile device screen to scroll through the list and tap Transportation to Work.

The Transportation to Work infographic is run, and you can scroll through it and view the information for your site.
Note that you can tap the Export button in the top right of the screen, to export it to your device as a PDF – this capability was added in the January 2024 release.
Isn’t it great to have these capabilities available to you on-the-go through BA Mobile App! The Business Analyst team expect that you will find these features useful. Please share your thoughts by commenting on this article. You can also use the Send Feedback option available within Business Analyst Mobile App.

Article Discussion: