Over the past few months, ArcGIS for Microsoft 365 has gotten a significant makeover. To accompany the enhanced user experience, navigation, and overall look and feel, you may also notice new or upgraded tools and features that make enabling GIS within your organization easier and more efficient.
One of these enhancements can be seen in the Create buffer/drive time analysis tool. Using the new Buffer style dropdown menu, you can now mix and match buffer styles based on your specific business question.
In this article, we explore three different ways you can use this tool by implementing various buffer techniques in ArcGIS for Excel: overlap buffer, dissolve buffer, and multiple rings buffers.
Just what is a buffer anyway?
Buffering is one of the more commonly used spatial analysis techniques. When you create a buffer, you create an area based on a time or distance from a specific feature of interest. A buffer can answer questions like “What protected areas are more than 10 kilometers away from a highway?”, “Where are coastal zones that will be impacted by a flood zone?”, or “Which customers live within a given radius of a business?”
Depending on the Analysis type, Distance, and Buffer style you choose to answer your business question, the information you can gain from your analysis can vary. Three buffer types commonly used in GIS analyses are overlap buffer, dissolve buffer, and multiple ring buffers (shown left to right below).

Types of buffers
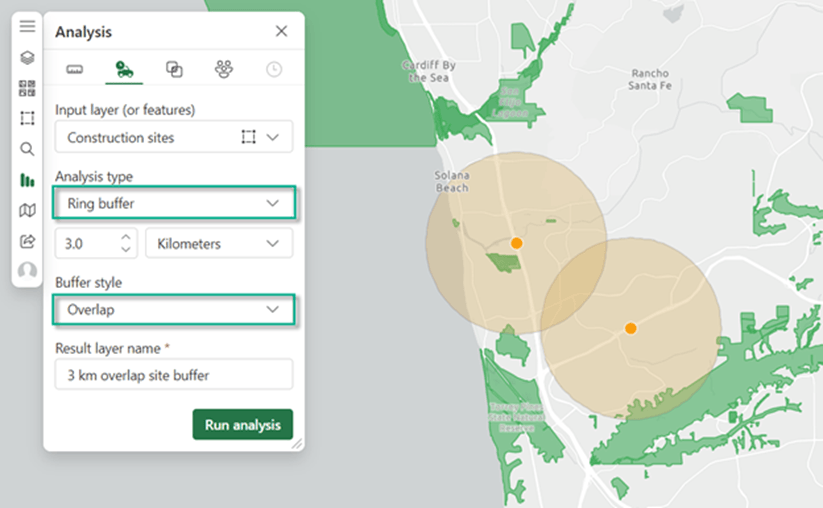
An overlap buffer creates a fixed distance buffer around a feature while maintaining all buffer boundaries. This style is useful when you want to preserve the distinct characteristics of each individual buffer region. The map below uses two proposed construction sites (orange) to create an Overlap style buffer region (tan). This map would allow city planners to identify all areas of ecological importance (green) which might experience direct environmental or noise impacts.

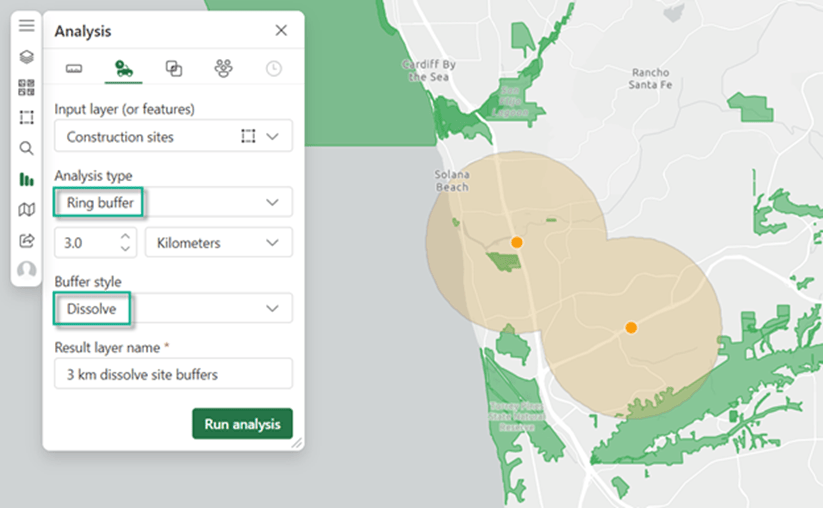
With certain datasets, the output regions (or buffered areas) overlap which make it difficult to identify the overall impact. You can simplify the results by setting the Buffer style to Dissolve to merge all overlapping regions into a single, unified area. This type of buffer is a great choice when you want to produce a clean, easier-to-read map by reducing visual clutter. In the following map, the single dissolved buffer region makes it easier to identify the cumulative impacts of two construction sites (tan) will have on the surrounding protected areas (green).

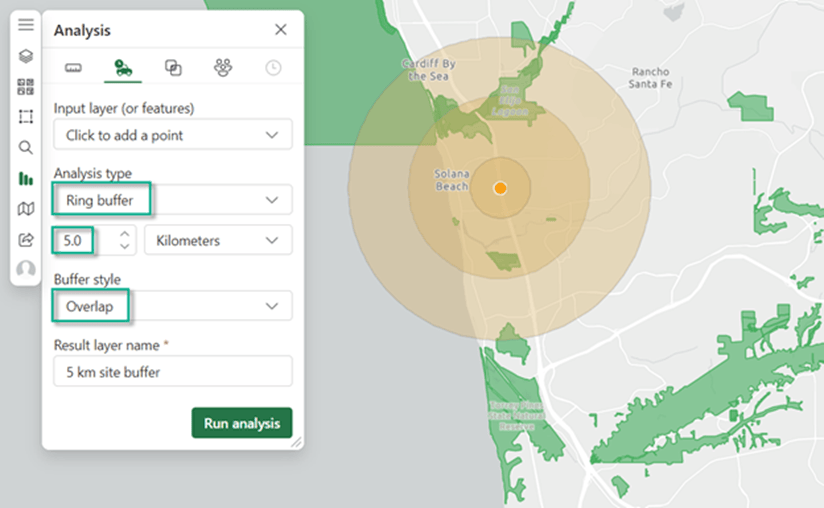
Finally, by running the buffer tool multiple times, you can create multiple ring buffers for planning, mitigation, and scenario modeling to visualize the impact of the same event at different distances. You can do this by creating an Overlap buffer style multiple times at different distances. To add some extra flair to your results, style each buffer area with different colors or even transparency levels, making it easier for your stakeholders to visually identify the differences. In the map below, stakeholders can understand the varying degrees of potential impact on protected areas (green), with each buffer ring (tan) representing a different impact zone.

Conclusion
Using various buffer techniques in ArcGIS for Excel provides a powerful tool for planning and decision making directly inside the spreadsheet you are already working in. By creating overlapping buffers, dissolved buffers, or multiple ring buffers we are able to gain insight on how different distances and overall effects might influence areas of interest. Ultimately, the choice of how to use the combination of buffer parameters available within the Create buffer/drive time analysis tool depends on your data and the question at hand.
Visit our user documentation to learn more about buffers and other great features in ArcGIS for Excel and ArcGIS for Microsoft 365. We also want to hear from you in our ArcGIS for Excel Esri User Community forum to learn how you use spatial analysis in your organization.

Article Discussion: