ArcGIS Solutions helps you make the most of your GIS by providing purpose-driven, industry-specific configurations of ArcGIS.
In her recent blog, Carrie Speranza introduced Watch Center, a new ArcGIS Solution for ArcGIS Online designed to help Emergency Operations Centers, Security Operations Centers, or Facility Operations Centers continuously monitor a diverse set of threat and hazard feeds so they can understand the impact to people and places of interest.
This blog will go one step deeper and provide an overview of Watch Center capabilities.
Real-time all-hazard feeds
Watch centers track various sources, from traditional news to social media, for threats and hazards that could impact their organization. When performed manually, organizations risk delayed response or even missed threats as watch officers face information overload and struggle to keep up.
To overcome this challenge, Watch Center includes ready-to-use connections to real-time hazard feeds from the ArcGIS Living Atlas and pre-configured connections for threat feeds in ArcGIS Marketplace.
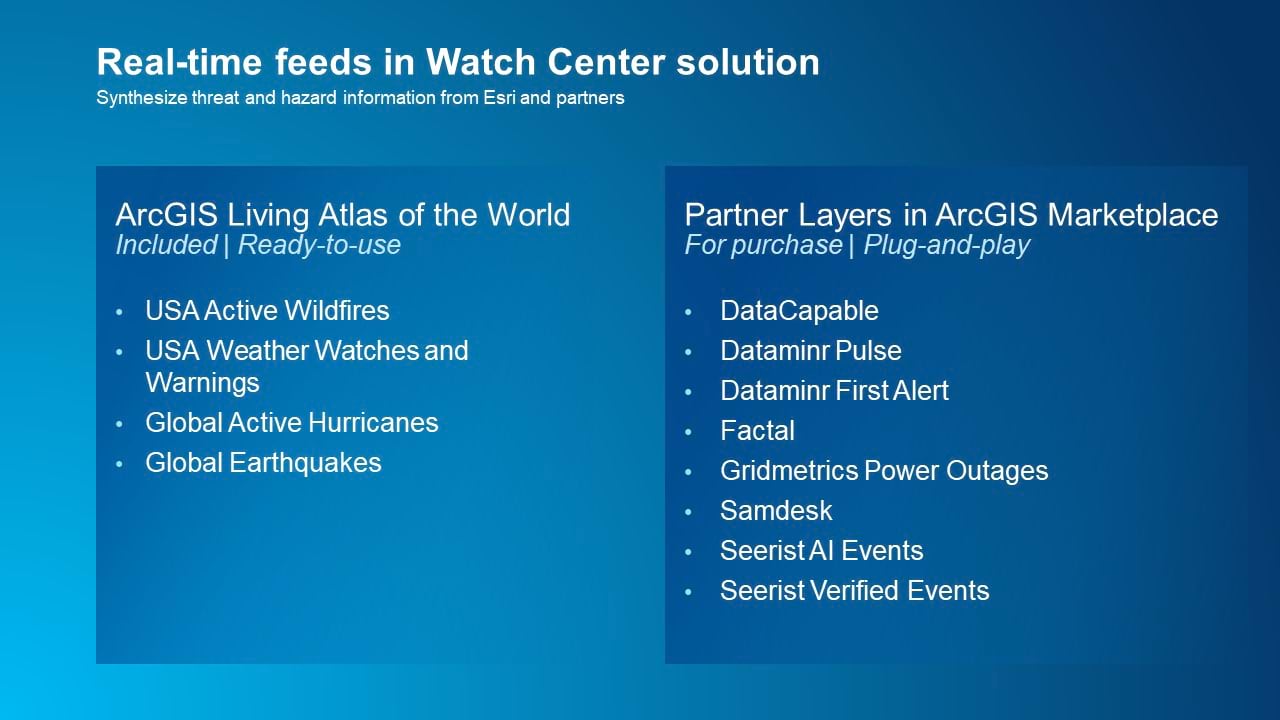
The feeds available for purchase on ArcGIS Marketplace include industry leaders in curated real-time risk intelligence. Use of the partner feeds in the solution is optional, but recommended. Watch Center also includes an ArcGIS Velocity analytic to poll, standardize, and merge real-time feeds, then trigger watch alerts when events occur within your watch areas. A second analytic monitors for updates to your organizational locations so your watch areas stay up to date.
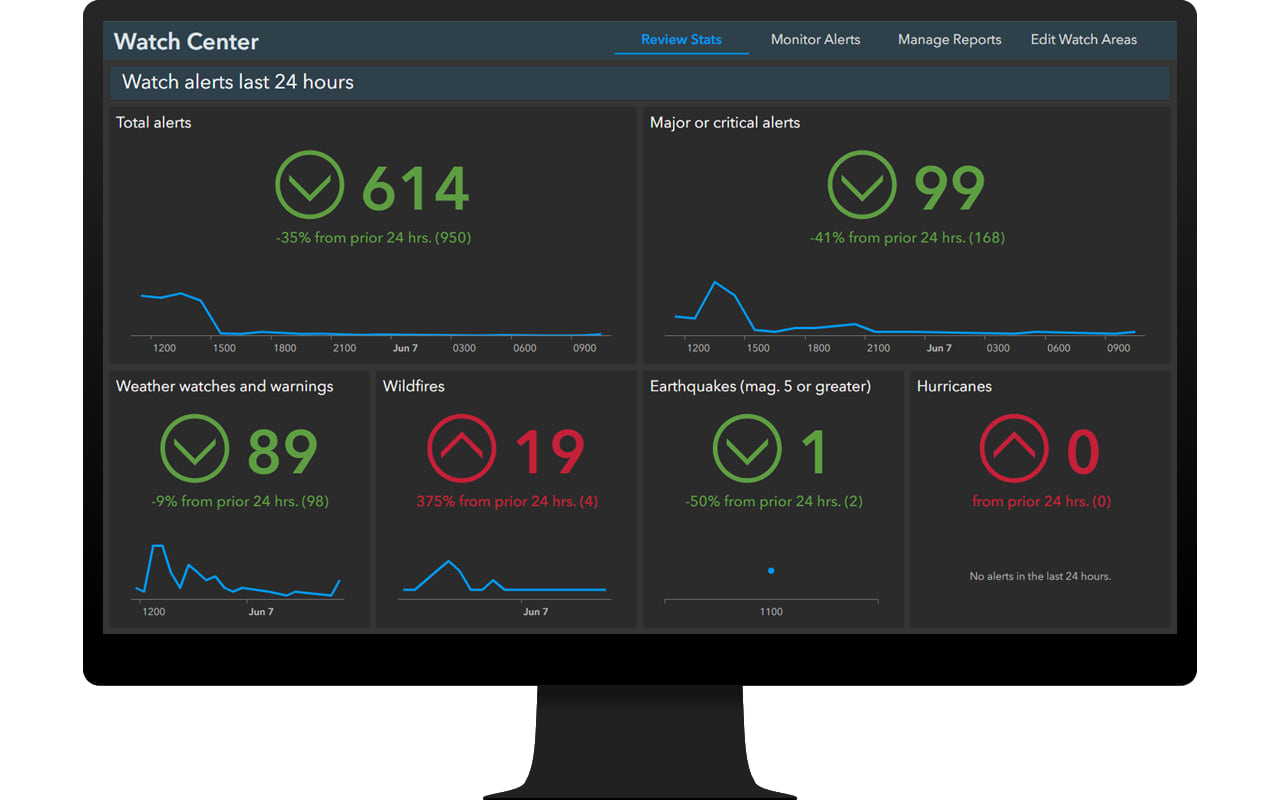
Streamline all-hazards event monitoring
The Watch Center app is used by watch officers to monitor for alerts occurring in your watch areas, create and manage reports to stakeholders, and manage your watch areas. As watch officers may need to work on the go, the app is fully supported on mobile browsers.
The app displays watch alert statistics for the past 24 hours by category, so watch officers can passively monitor emerging trends. The categories displayed are fully configurable, so that organizations can focus on monitoring topics of greatest importance.
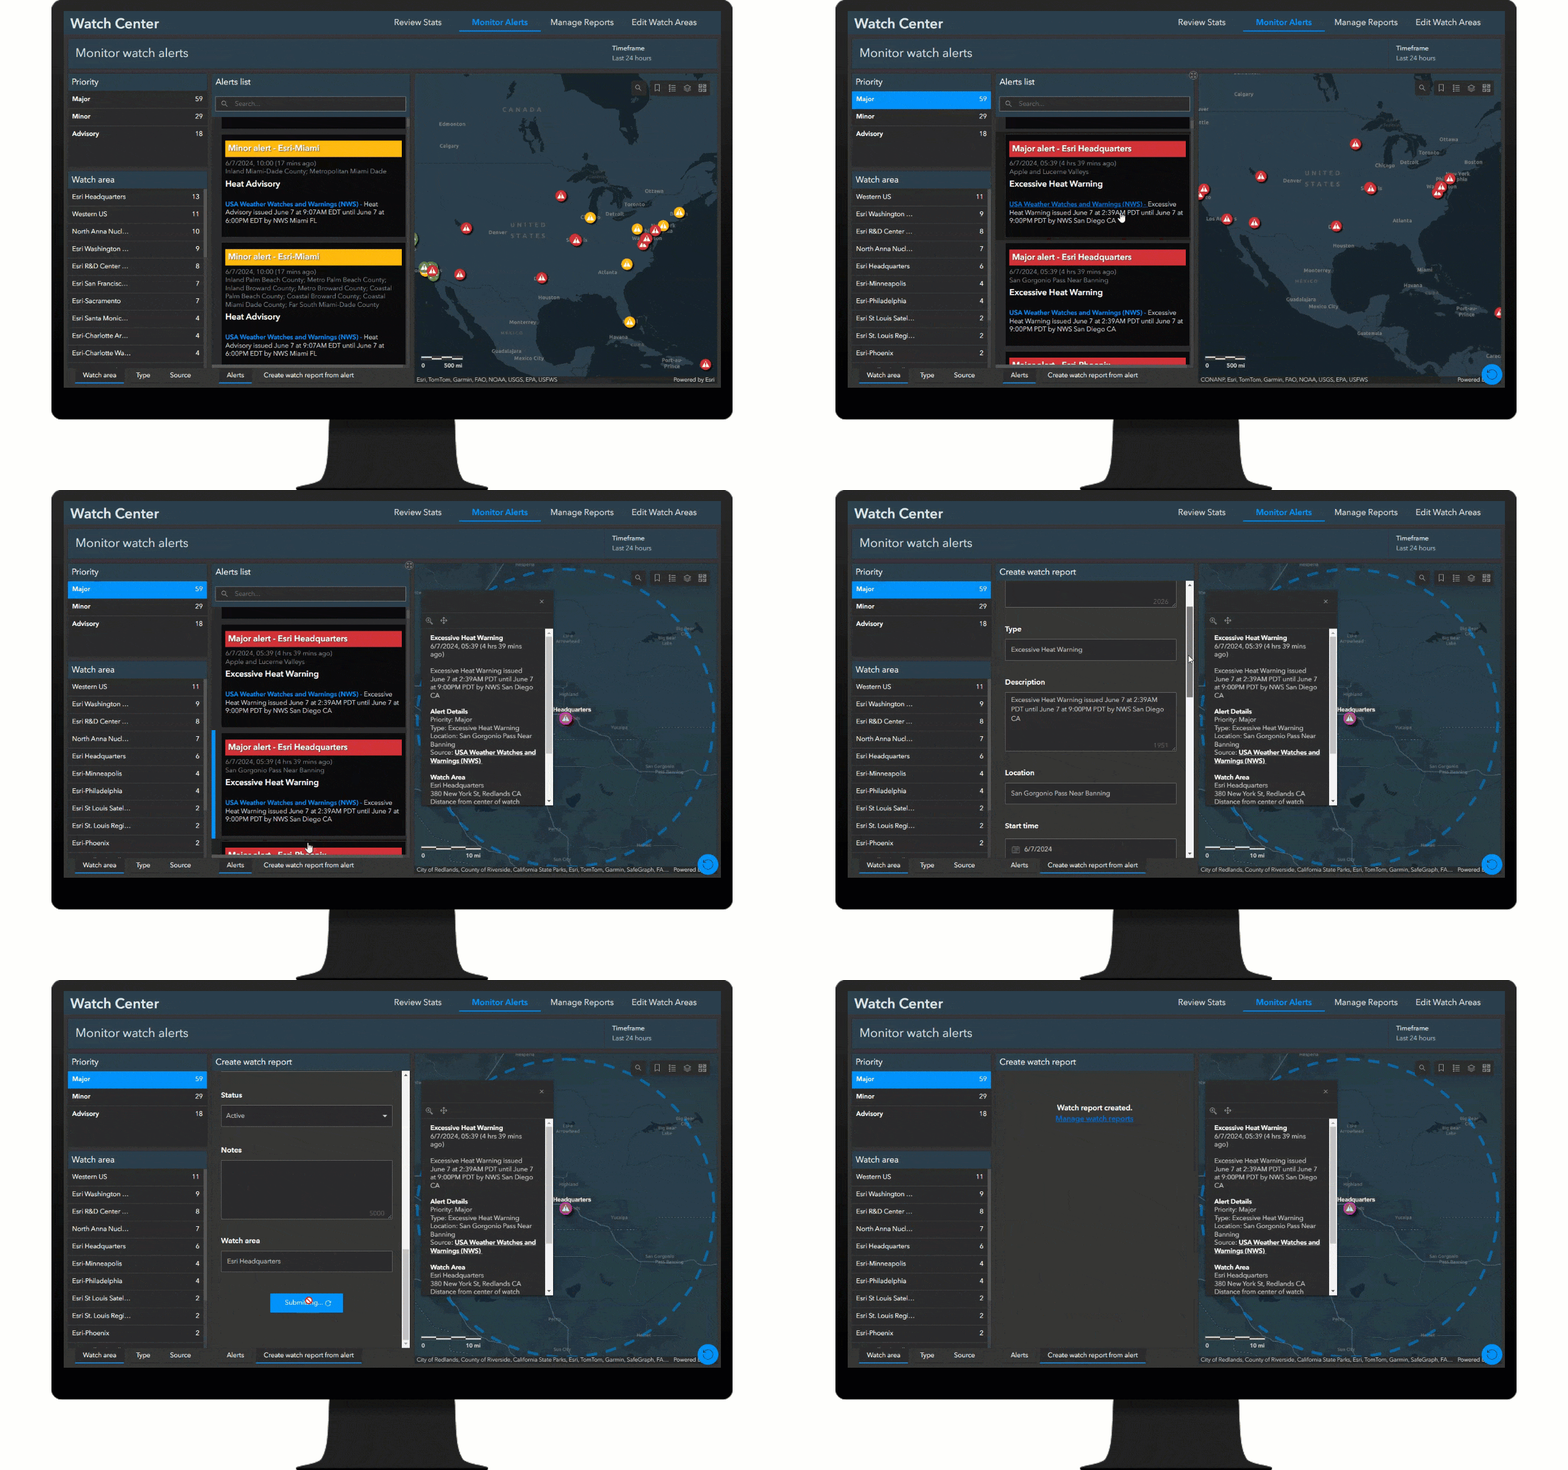
The Watch Center app is also used to monitor alerts in your watch areas. Alerts can be filtered and reviewed on the map relative to their watch area and other contextual layers, and pop-ups include alerts details and original source links. If an alert poses risk, the app can be used to create a watch report for stakeholders. If an alert is not relevant, it can be dismissed from the list.

Watch reports can also be managed using the the Watch Center app. Watch officers can view and update active reports, create new manual reports, generate emails to share with stakeholders, and view and edit point of contact data.
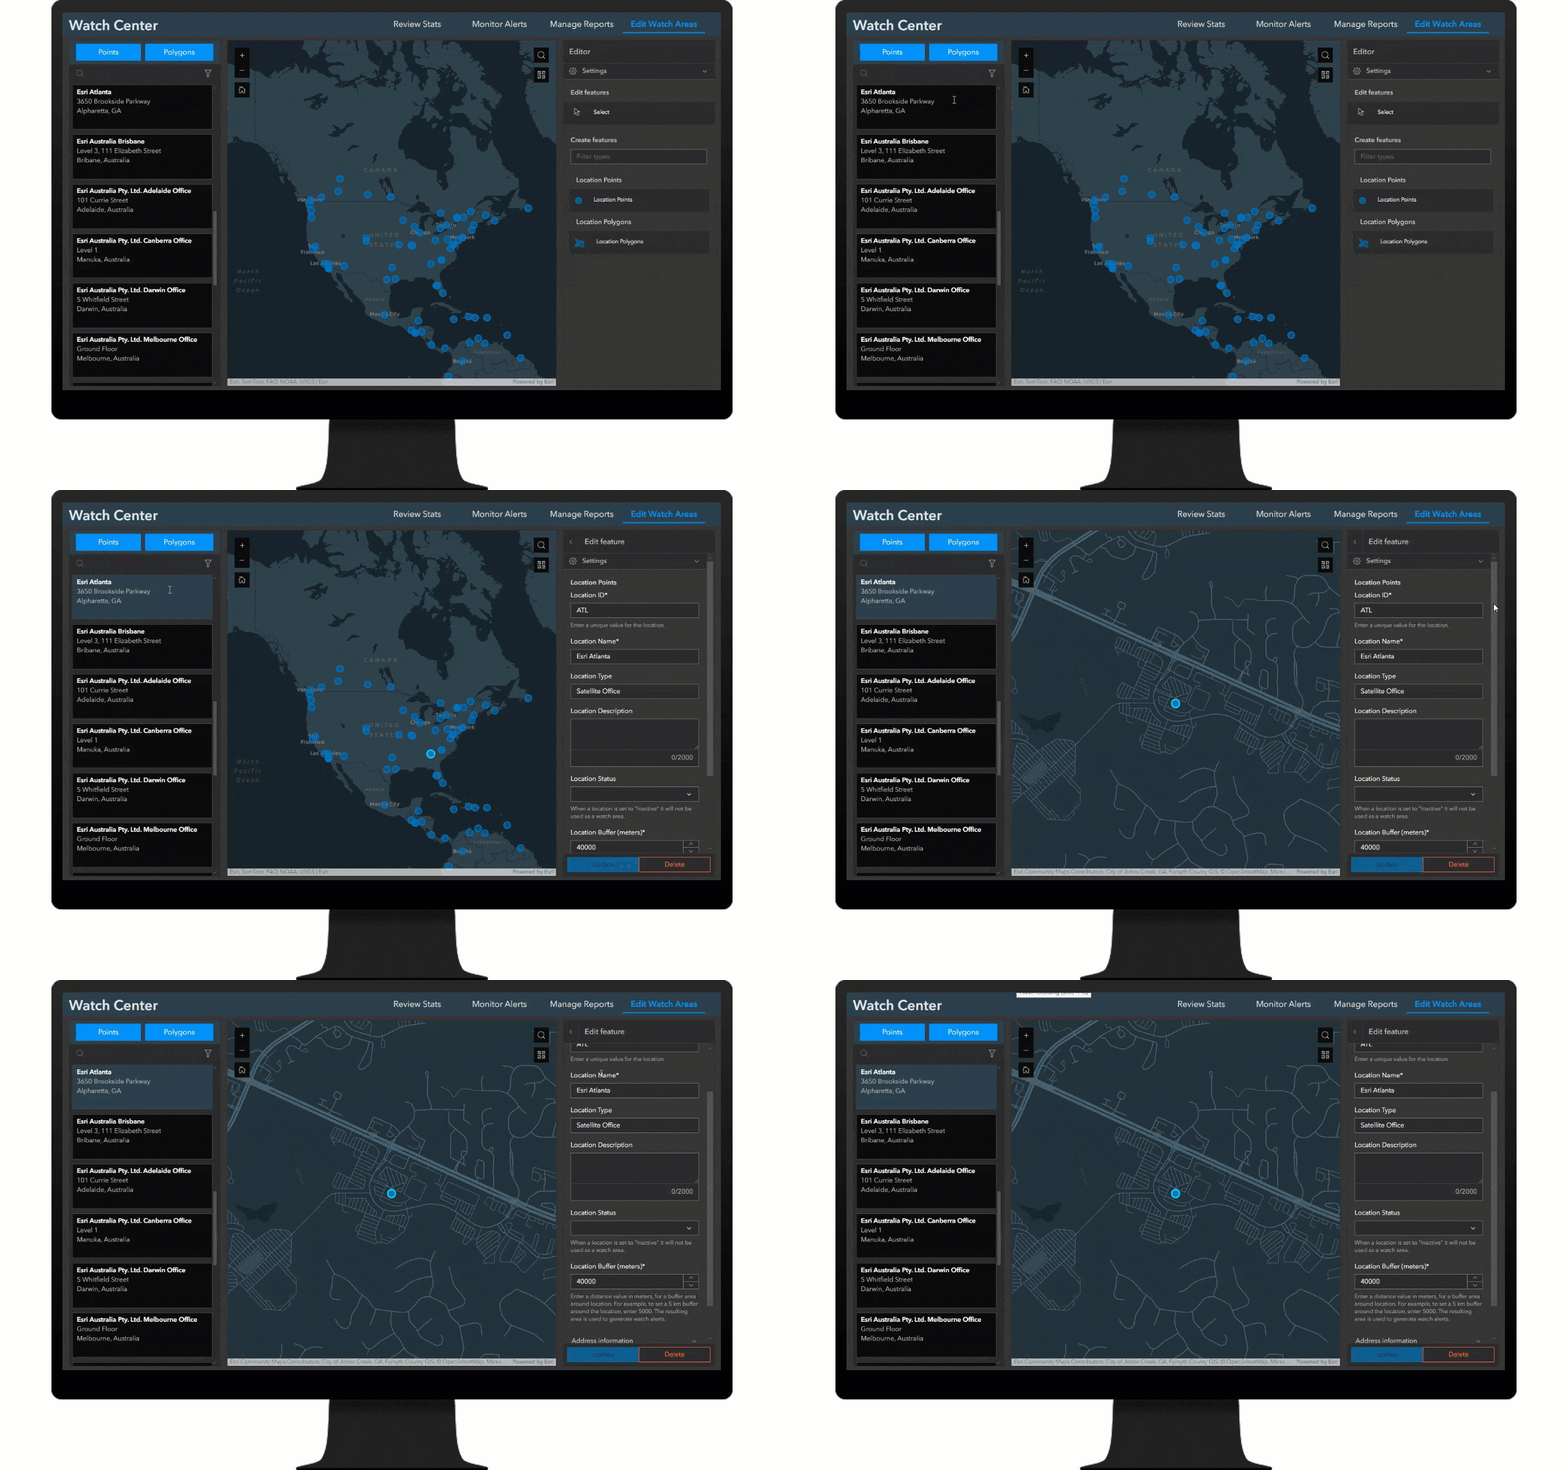
Lastly, the Watch Center app helps manage the watch areas where alerts can occur. Watch officers can create and update location points and polygons used as watch areas, including buffer distances, status, and points of contact.
Quickly understand risks
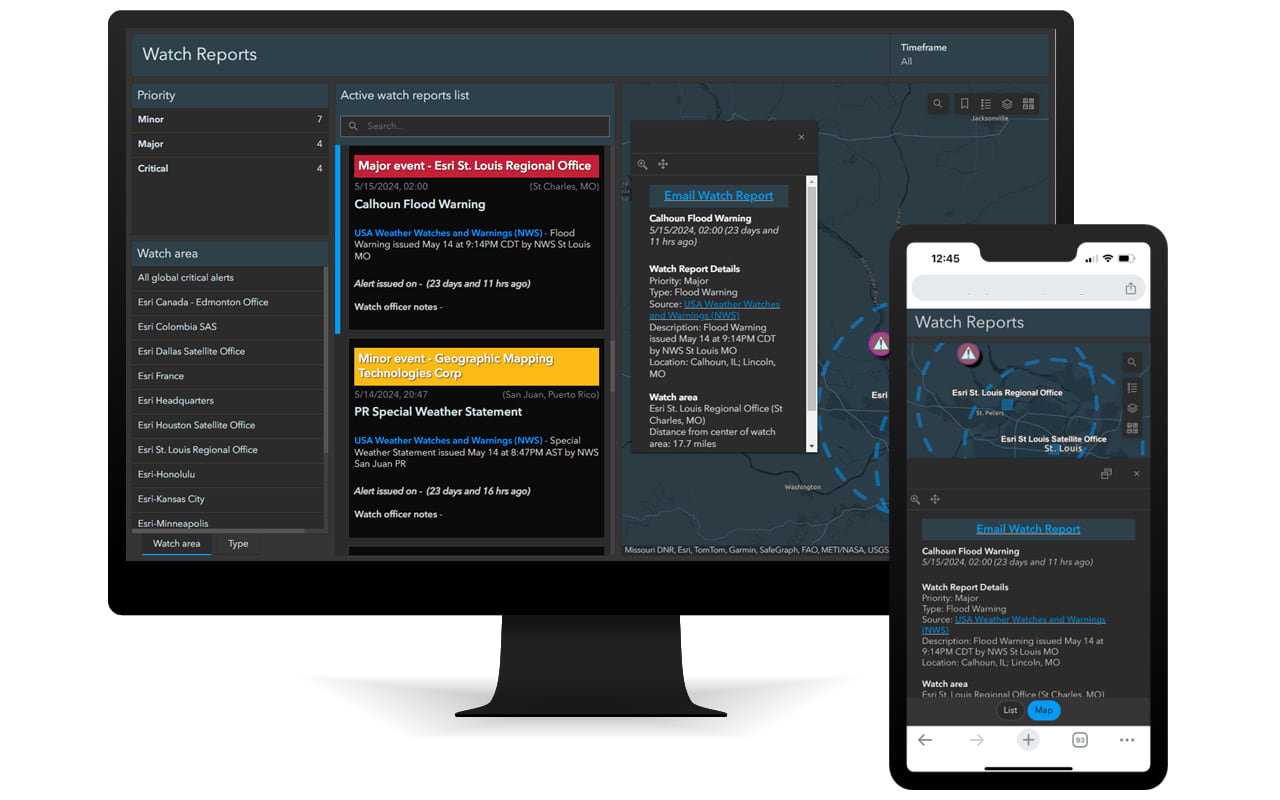
The Watch Reports dashboard is used by stakeholders and decision-makers to view the watch reports created by watch center officers. The dashboard is supported in desktop and mobile views so decision-makers have access anytime and anywhere they need it. They can easily view all active reports as a list and on a map, filter reports by timeframe, priority, watch area, and type, and review the details of each report so they can determine how to respond.
Learn more
For more information about the Watch Center solution, check out the following resources:
- Learn how to deploy, configure, and use the solution.
- View a demo video.
- Learn more about ArcGIS Solutions.
- Chat with us on Esri Community.

Article Discussion: