ArcGIS Solutions helps you make the most of your GIS by providing purpose-driven, industry-specific configurations of ArcGIS.
According to the Centers for Disease Control and Prevention (CDC), more than 1 million people have died from drug overdoses in the last couple of decades, with a majority of these deaths involving an opioid.
These chilling statistics represent an epidemic that affects virtually every community and cannot be ignored. And since the opioid epidemic is a community issue, it makes sense that improving outcomes starts at the community level.
In most communities, it is up to public health agencies to provide resources that educate residents about opioids, offer prevention services, and, if necessary, connect people with a substance use disorder to the appropriate treatment and recovery resources. But keeping an accurate and up-to-date inventory of these resources can be complicated; new providers become available while others close down, and operating hours and contact information can change over time.
Opioid resources must be available when people need them. The Opioid Epidemic Outreach solution helps public agencies create and maintain a resource inventory, communicate important information about the severity of the epidemic, and promote resources available to community members in need.
Plan
Like so many communities, Mahoning County, Ohio, has seen an increase in unintentional drug overdoses and overdose deaths in recent years. While the county provides great programs and services, its public health department knew they could be even more effective and could reach more people if they increased awareness of their work. They wanted to make information about these services more widely available, for example, and they hoped to create an easier and more comprehensive display of the data that they had been collecting since 2016.
In 2023, Bharat Chaturvedi, a public health epidemiologist with Mahoning County Public Health (MCPH), attended the Esri User Conference in San Diego, California. At the ArcGIS Solutions Expo booth, he discussed the issue with a product engineer, who introduced Chaturvedi to the Opioid Epidemic Outreach solution. The product engineer described how organizations similar to MCPH—including a neighboring Ohioan county—had adopted the solution with great results, and Chaturvedi knew he had found the answer.
Provide
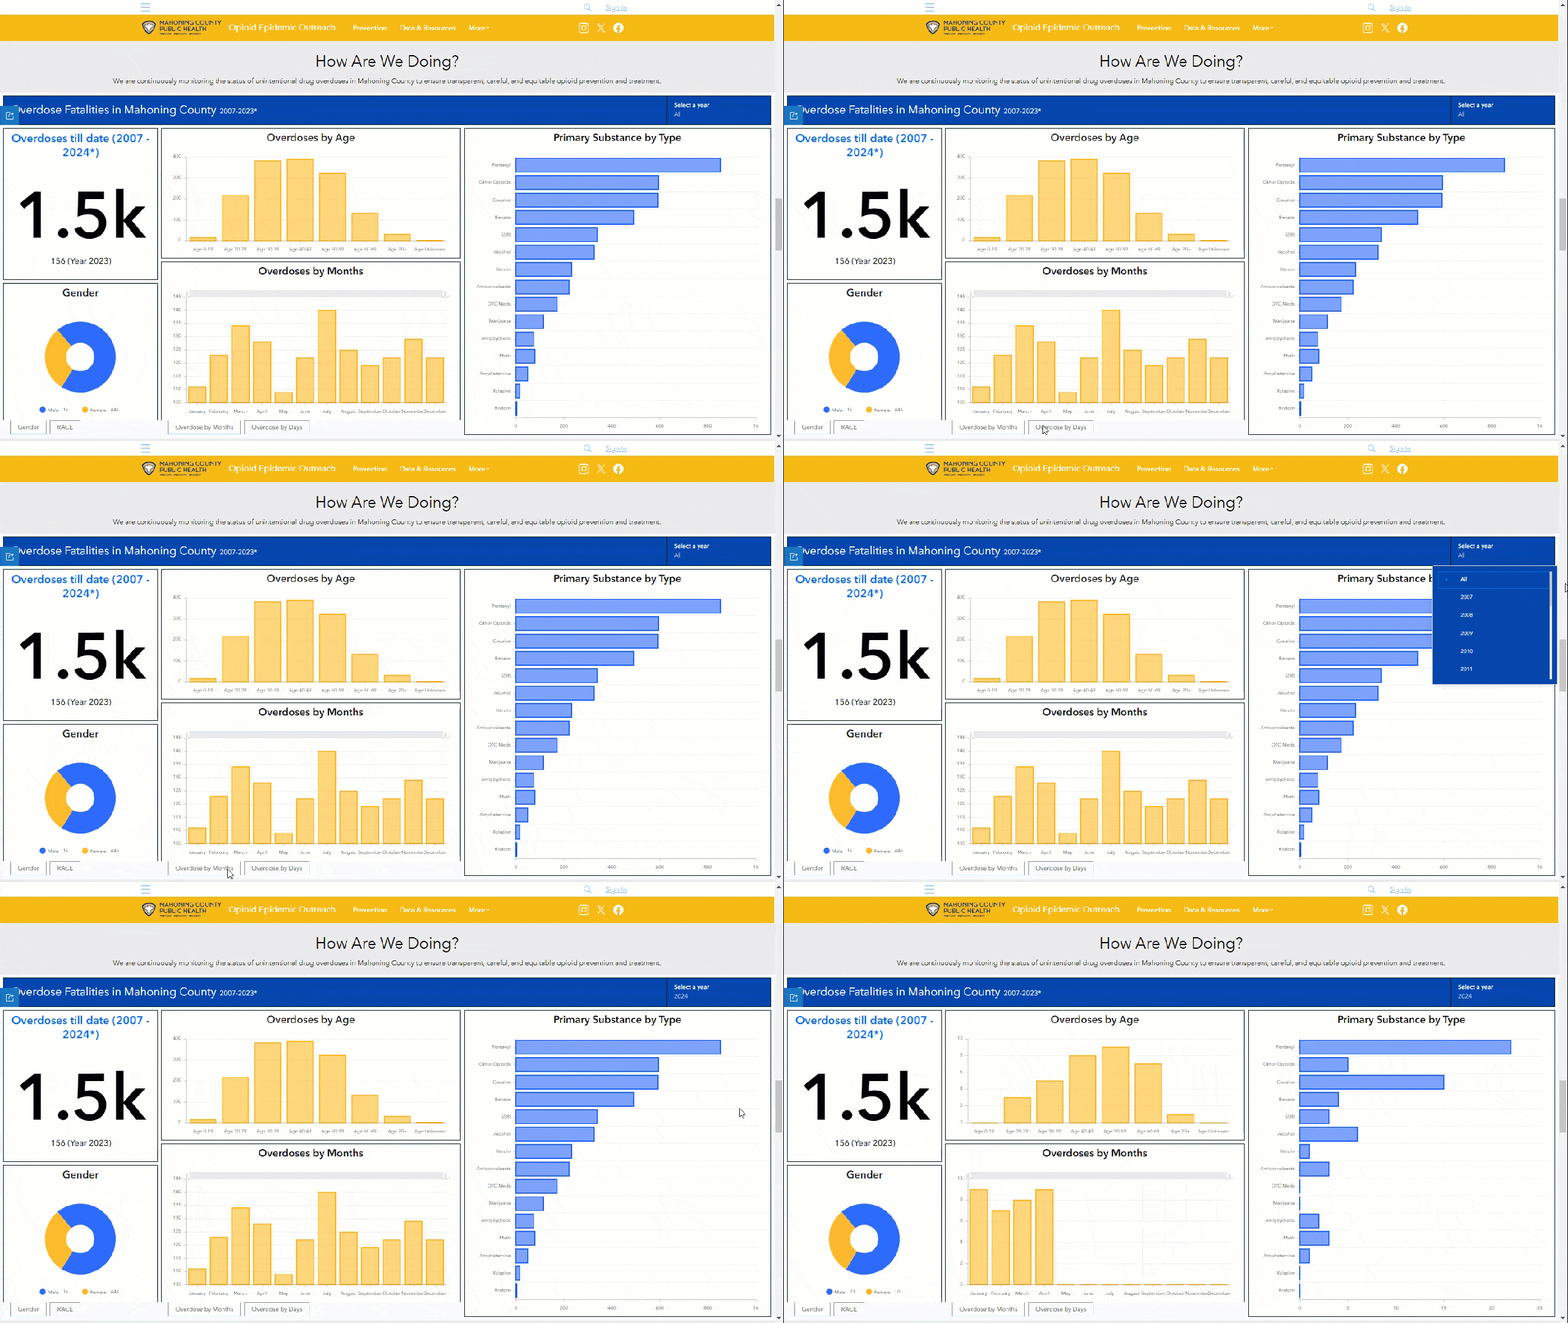
Prior to deploying the Opioid Epidemic Outreach solution, the county’s process was consistent but somewhat slow: Analysts entered monthly epidemic data into Excel and then used the same software to produce charts. The resulting infographics were copied into a Word document and distributed monthly as a static report through an email LISTSERV. Each report displayed only that month’s data along with cumulative data for the year.
The Opioid Epidemic Outreach dashboard has streamlined our data sharing with our community partners.
Adopting the Opioid Epidemic Outreach solution has enabled MCPH to create a hub of important information for its community. Now, outside agencies can visit MCPH’s Opioid Epidemic Outreach ArcGIS Hub site to easily access the data they need for grant writing and community reports. “Instead of sending out multiple reports and links to communicate information,” says Chaturvedi, “we have a one-stop shop for all things related to the opioid epidemic here in Mahoning County.”

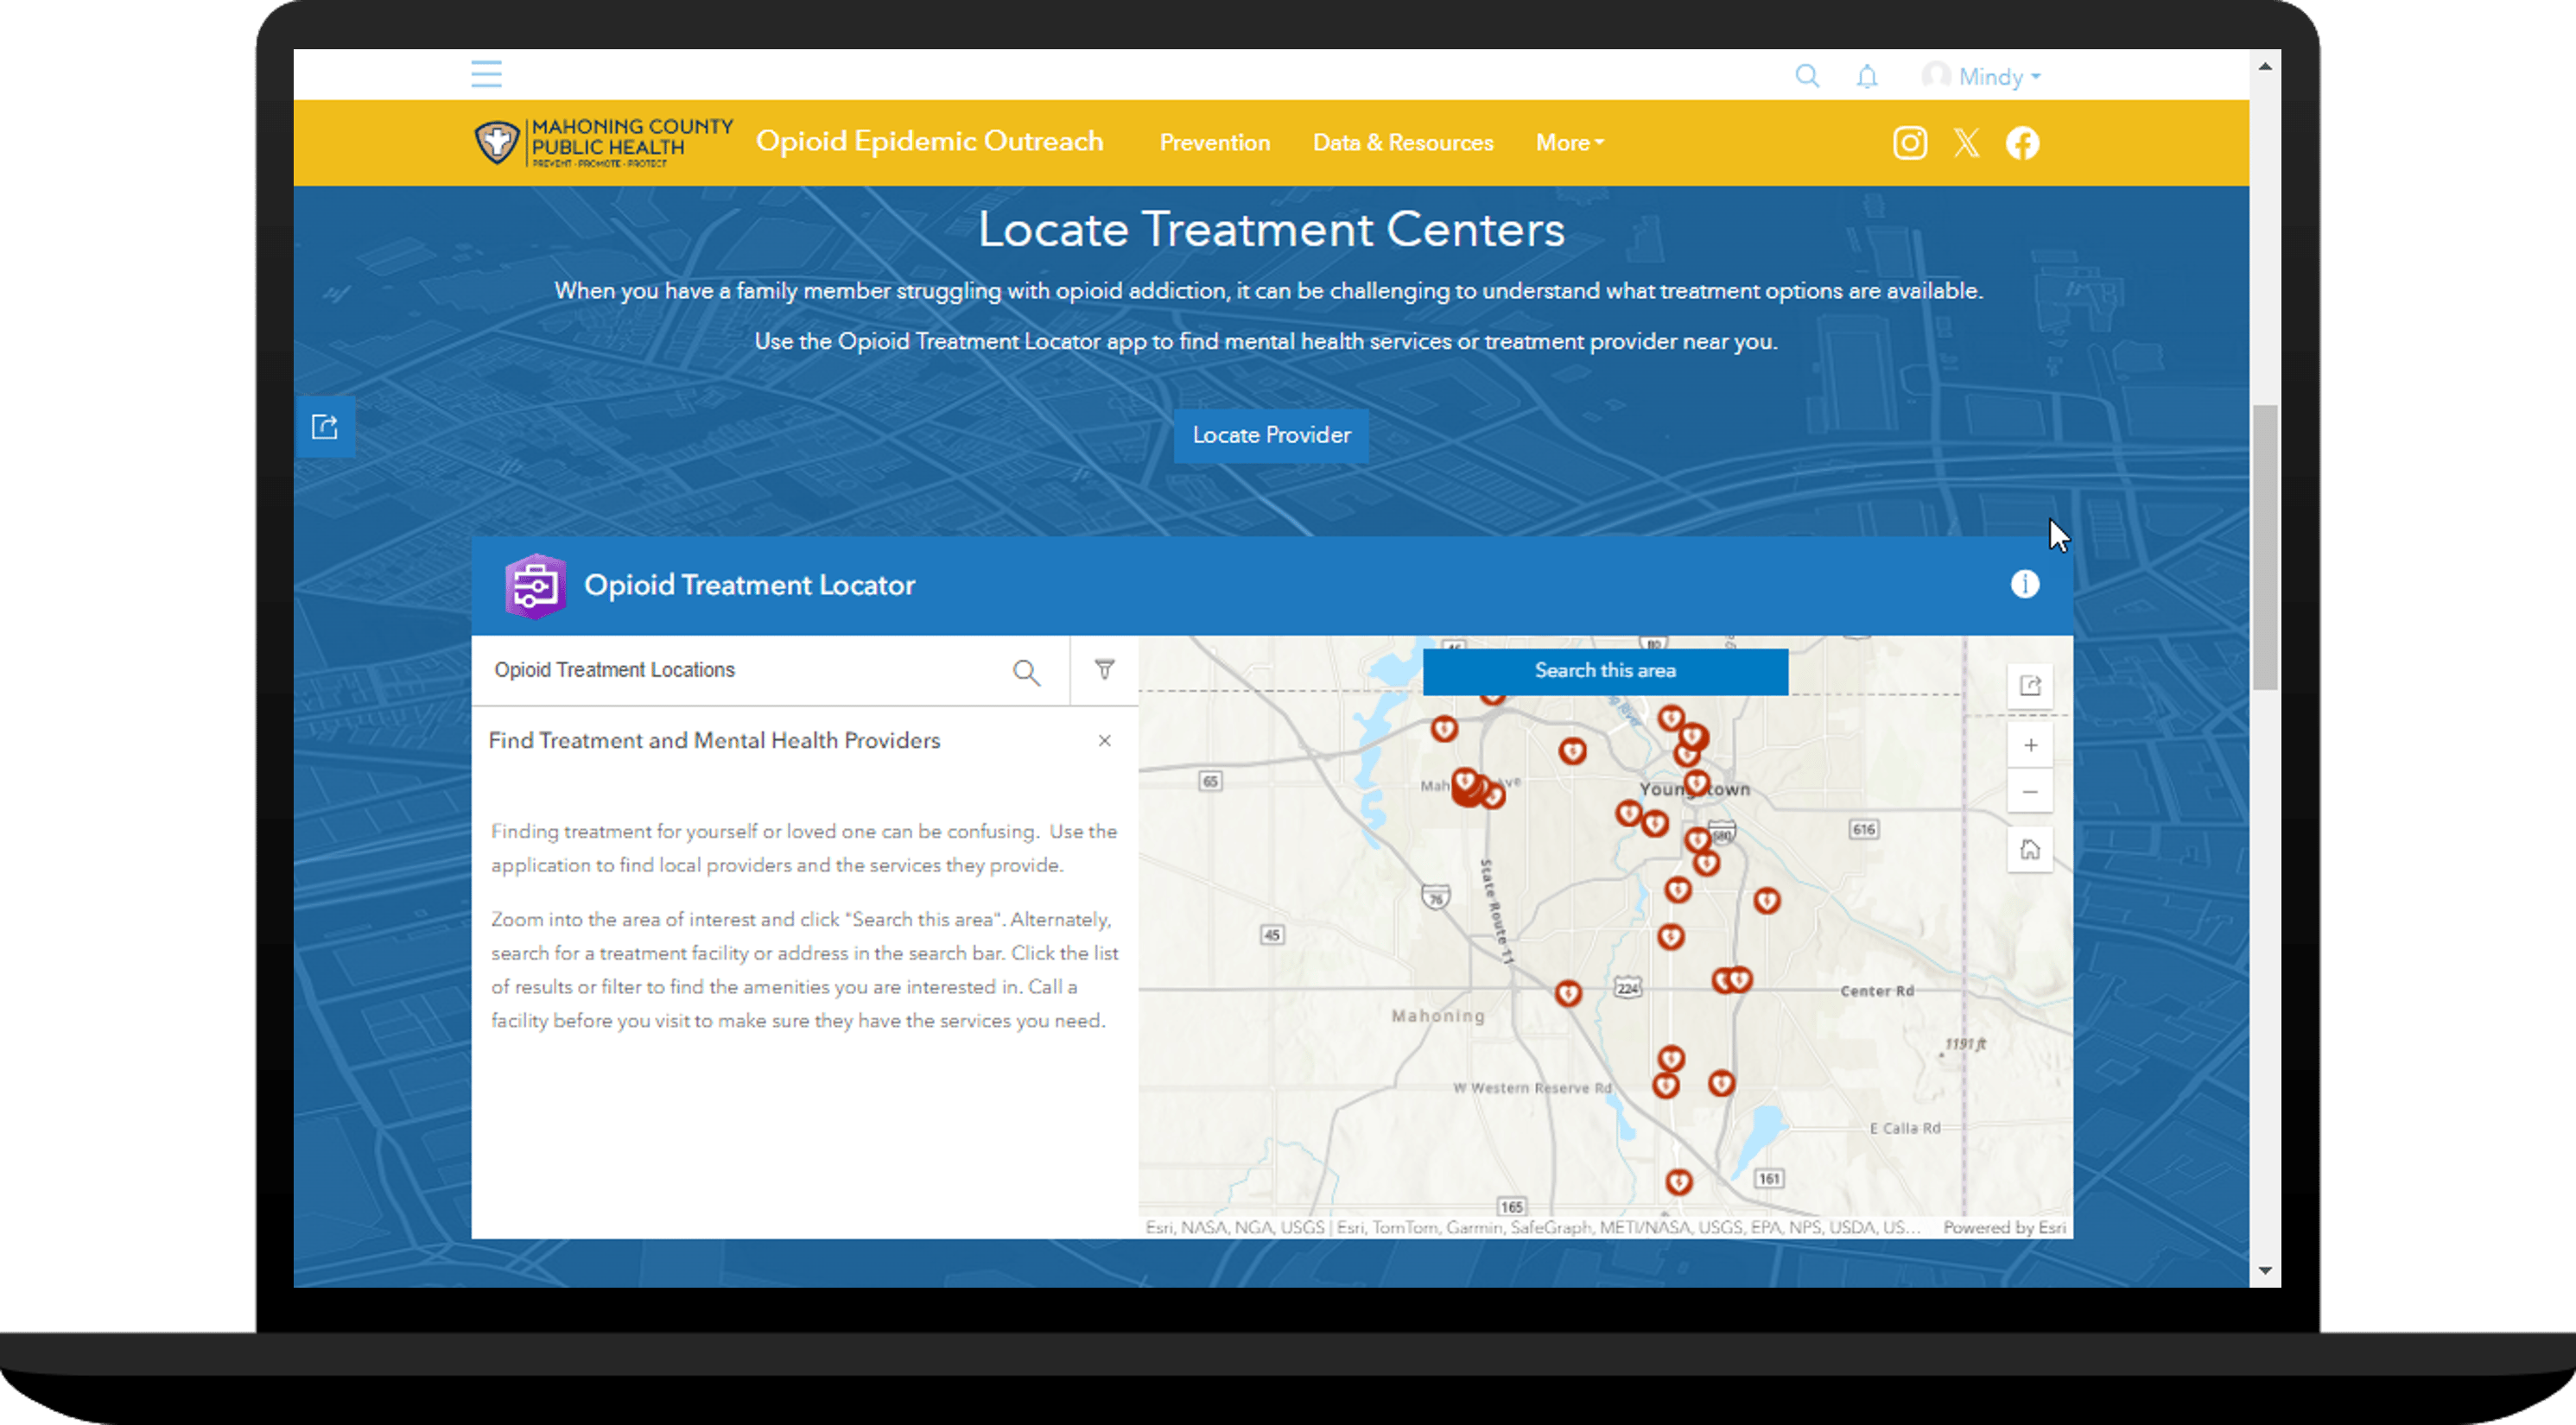
The site also enables MCPH to provide resources that they couldn’t before. Community members can visit the site to find information about prevention, treatment and recovery, or harm reduction, and they can access overdose and Quick Response Team data clearly displayed in a series of charts.

MCPH’s Hub site now serves as the heart of the county’s efforts to provide critical information about substance use disorders and treatment options available to the community. Chaturvedi notes that now, for both the agency and the whole community, anything and everything related to overdose resources is just one click away.
Learn more
For more information about the Opioid Epidemic Outreach solution, check out the following resources:
- Learn how to deploy, configure, and use the solution.
- View related videos:
- Read the Opioid Epidemic Outreach Solution Released blog post.
- Learn more about ArcGIS Solutions.


Commenting is not enabled for this article.