The Armed Conflict Location & Event Data Project (ACLED) is a disaggregated data collection, analysis, and crisis mapping project. ACLED is the highest quality and most widely used global, real-time data and analysis source on political violence and demonstrations around the world (information on methodology can be found in the ACLED Resource Library). Practitioners, researchers, journalists, risk analysts, corporate security managers, and governments depend on ACLED for the latest reliable information on current disorder patterns.
ACLED Available to All ArcGIS Users
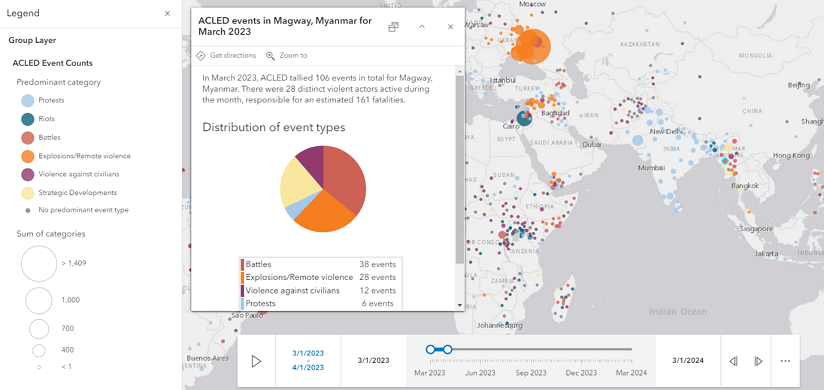
An aggregated ACLED data file is now available through ArcGIS Living Atlas of the World. There are three items to explore: a feature layer, a group layer of key indicators, and a web map with time configuration. The data are presented as counts by month for the past year, and they are mapped to a centroid of the first administrative division (ex. Province) as defined by ACLED. These counts include:
- The total number of events per administrative division (disaggregated by event type) per month
- A conservative estimate of reported fatalities per administrative division
- The total number of distinct violent actors active in the corresponding administrative division

With these new resources, you can visualize and analyze key conflict statistics over time to understand current global and regional patterns of conflict. For example:
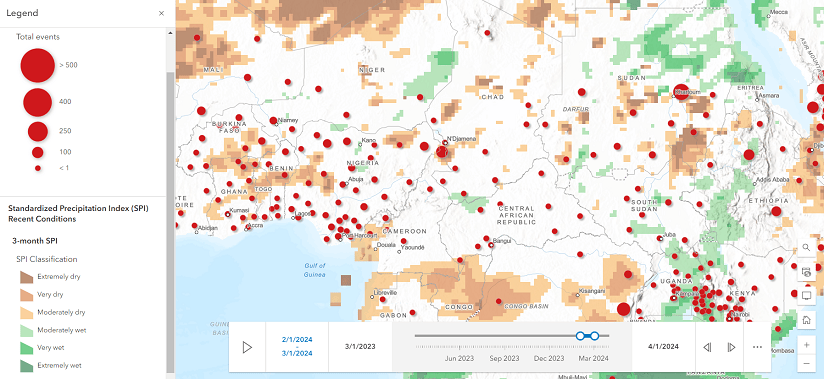
- Compare recent ACLED data to other Living Atlas data like the Standard Precipitation Index (SPI). This shows where existing conflict may get worse due to increasing environmental stressors and where humanitarian intervention planning may therefore be needed:

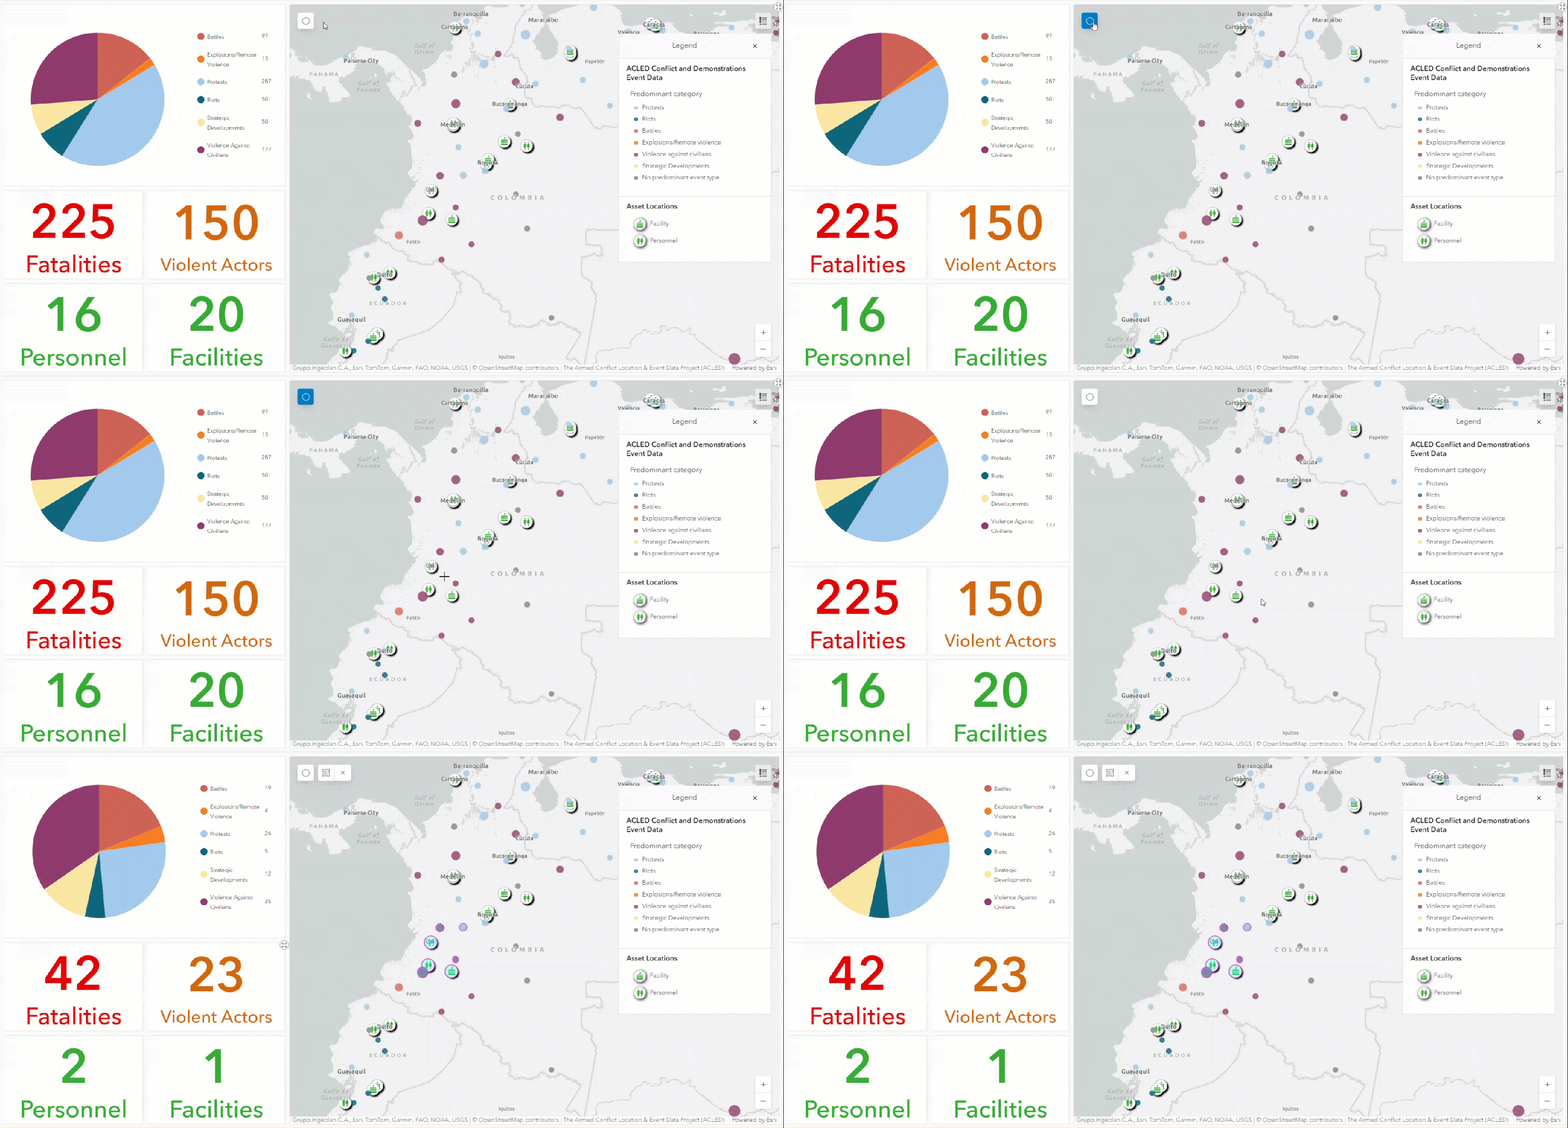
- Use an ArcGIS Dashboard to monitor trending conflict and demonstration activity in proximity to your organization’s assets, supply lines, and staff locations. This can help inform corporate security needs and actions:

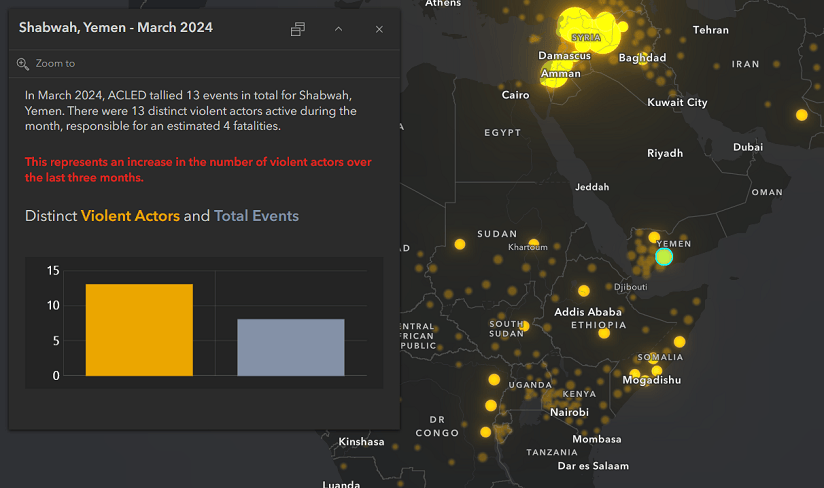
- Configure an Arcade expression in the pop-up to compare ACLED statistics over a specific time period. It can report if the number of violent actors is increasing or decreasing in an area, which can aid national security strategy:

More Data Options from ACLED
While this aggregated data is available to all ArcGIS users via Living Atlas, fully disaggregated data (subject to some limitations based on your type of organization) can be obtained by registering through the Access Portal on the ACLED website and exporting via the Data Export Tool. You can also explore the data through other interactive tools.
Thanks!
Thanks to ACLED for collaborating with us to provide this compelling data to ArcGIS users throughout the world via Living Atlas. We look forward to seeing its impact on the work being done by the Esri user community.

Commenting is not enabled for this article.